2221
Improving the B0 homogeneity in 7 T MRSI applications using a 24-channel local array of shim coils
Philipp Lazen1, Sahar Nassirpour2, Paul Chang2, Lukas Hingerl1, Karl Rössler3, Siegfried Trattnig1,4, Wolfgang Bogner1, and Gilbert Hangel1,3
1Department of Biomedical Imaging and Image-guided Therapy, Medical University of Vienna, Vienna, Austria, 2MR Shim GmbH, Reutlingen, Germany, 3Department of Neurosurgery, Medical University of Vienna, Vienna, Austria, 4Christian Doppler Laboratory for Clinical Molecular MR Imaging, Vienna, Austria
1Department of Biomedical Imaging and Image-guided Therapy, Medical University of Vienna, Vienna, Austria, 2MR Shim GmbH, Reutlingen, Germany, 3Department of Neurosurgery, Medical University of Vienna, Vienna, Austria, 4Christian Doppler Laboratory for Clinical Molecular MR Imaging, Vienna, Austria
Synopsis
A 24-channel array of local shim coils in a 7 T Siemens Terra Fit was tested on eight healthy volunteers. Significant improvements of the homogeneity of the static magnetic field could be achieved and were qualitatively shown and quantitatively analyzed. The standard deviation of the resonance frequency decreased from 42.5 Hz for the standard shim (up to second order spherical harmonics) to 34.5 Hz for the 24-channel local shim array. The full width at half maximum and the signal to noise ratio also improved with the better shim. Lastly, some preliminary MRSI results could be gathered.
Introduction
In magnetic resonance spectroscopic imaging (MRSI), inhomogeneities of the static magnetic field (B0) present a significant challenge. Diligent care must be taken that the B0 field is as homogeneous as possible before any MRSI data is acquired. Contrary to magnetic resonance imaging, where the scanner’s second order shim already results in good image quality, MRSI requires further improvement of the shim. Often, even after manual adjustment and optimization of the shim values, some residual local inhomogeneities that cannot be compensated for using the default spherical harmonic shim coils remain. In previous work, we have shown that using a 3D concentric ring trajectory MRSI sequence at 7 T, we are able to acquire high quality volumetric metabolite maps [1]. However, there is a significant decrease of data quality, especially in challenging brain regions such as the basal regions close to cavities. In this study we investigated the effect of improved B0 shimming using a local array of shim coils to reduce the local magnetic field inhomogeneity and thereby improve the prerequisites for high quality MRSI [2]. For the purpose of evaluation, we acquired B0 maps as well as preliminary MRSI data.Methods
The B0 shimming system (MR Shim GmbH, Reutlingen, Germany) consisted of an array of 24 Elara head shim coils arranged in two rows, a set of three Jupiter shim amplifiers capable of a maximum current of 2.5 A per channel and the Arche shim software. Each shim coil was constructed of circular copper loops of diameter 75 mm with 14 turns. For system calibration, reference B0 maps were acquired on a phantom from each shim channel (at 1.5 A) using a 3D dual-echo GRE sequence with the following parameters: FOV = 260x260x338 mm³, in-plane resolution = 3.17x3.17 mm², slice thickness = 3.2 mm, TR = 4.4 ms, delta TE = 2.04ms, flip angle = 10°.After acquiring approval by our institutional review board, we measured eight consenting healthy volunteers at our 7 T Siemens Terra Fit scanner using a 1Tx/32Rx head RF coil (Nova Medical, USA). The measured protocol consisted of a morphological T1 weighted image and an isotropic B0 image with similar parameters as the one described above (TA = 45 s). Additionally, a CRT-FID-MRSI acquisition using WET water suppression was conducted in three volunteers (matrix size = 64x64x39, FOV = 220x220x133 mm³, acquisition delay = 1.3 ms, TR = 450 ms, flip angle = 39°) [1]. The B0 field mapping and the MRSI measurement were performed once with and once without the 24-channel shim coil array.
The post processing of the MRSI data involved Hamming filtering and zero filling as well as L2-regularization. Subsequently, LC Model was used to quantify the resulting spectra. The final evaluation was focused on parameters such as the signal to noise ratio (SNR) and the full width at half maximum (FWHM) in all brain voxels. The standard deviations of the frequency shifts in the resulting B0 maps were evaluated as a measure of field homogeneity.
Results
The 24-channel local shim coil array improved the B0 field homogeneity on all volunteers. The standard deviations of the frequency shifts for each shim setting are listed in figure 1. For the scanner shim, the average standard deviation of the resonance frequency was 42.5 Hz; for the 24-channel array shim, it was 34.5 Hz, corresponding to an improvement of field homogeneity of around 20%. The mean absolute current used to shim with the local array of shim coils is also listed in figure 1 and ranges from 0.65 to 1.22 A.Figure 2 shows representative B0 maps for each of the shim settings in three orientations. It can be seen that the local array of shim coils was able to compensate for the local inhomogeneity patterns especially in the frontal lobe and lower basal regions. Across all volunteers, average B0 shim quality improvements of 29% and 22% were observed in the cerebellum and the frontal lobe region, respectively.
Figure 3 and 4 show some representative metabolite maps acquired with and without the 24-channel local shim array. The improved B0 shim quality results in artifact reduction in the metabolite maps. For example, in figure 4 artificially dark or hot spots are reduced in regions where the local B0 inhomogeneity is compensated for.
The FWHM decreased in basal brain regions, indicating lower line widths, and the SNR increased in some areas near the top of the brain (figure 5).
Discussion
Applying the 24-channel shim improved the field homogeneity significantly. This effect is most pronounced in more challenging shimming regions such as the frontal lobe and the cerebellum (figure 2). Some improvements of the MRSI data quality, especially in slices which are further basal in the brain, where the spectral quality often deteriorates significantly, could be observed as well (figures 3 and 4).Future work, including tailoring the arrangement of the shim coils to the anatomy and using the local array of shim coils for real-time field stabilization, may improve the data quality further. Aside from that, this work is limited by the comparatively small number of volunteers and thus, more data must be acquired.
Acknowledgements
This study was supported by the Austrian Science Fund (FWF): KLI-646, P 30701 and P 34198.References
[1] Hingerl et al., Investigative Radiology 2020, doi: 10.1097/RLI.0000000000000626.
[2] Juchem et al., NMR in Biomedicine 2020. doi: 10.1002/nbm.4350.
Figures
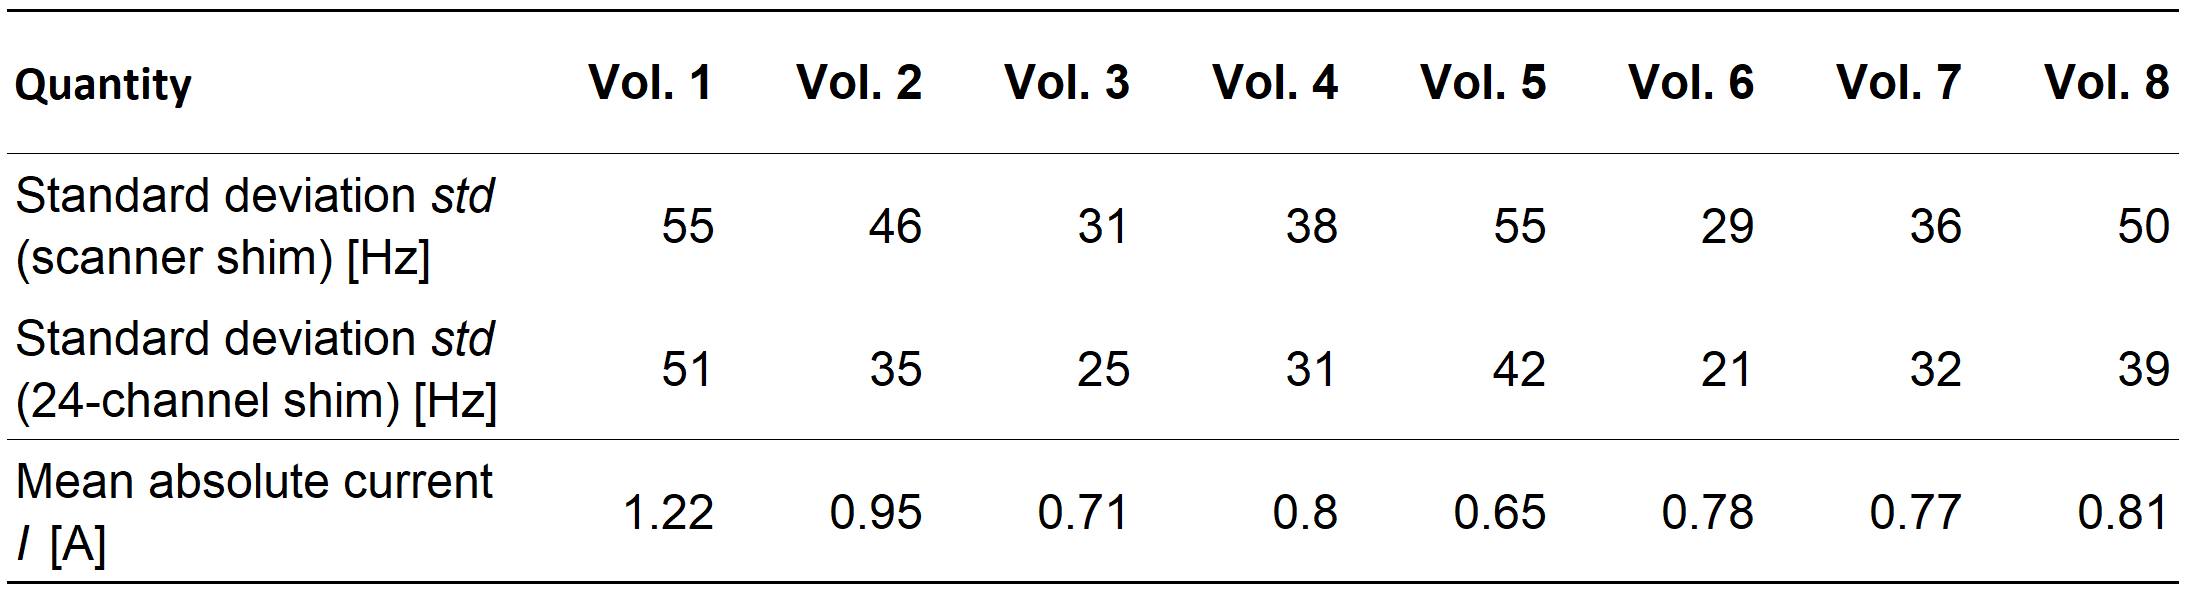
Figure 1: Standard deviation (std) of the frequency shifts due to B0 inhomogeneities across all volunteers are reported for both shim settings: once only with the scanner shim of up to second order spherical harmonics and once with the 24-channel local shim array. The mean absolute current (I) used to perform shimming using the local array of shim coils is also reported.
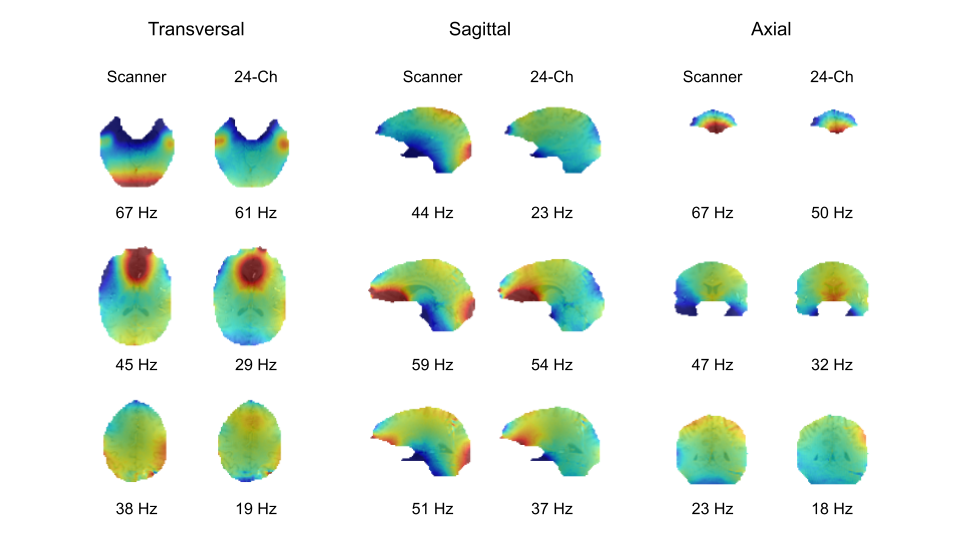
Figure 2: Representative B0 maps for both shim settings (once only with scanner shim of up to second order spherical harmonics and once with the 24-channel local shim array) are shown in three orientations overlaid on anatomical images for a single volunteer. B0 maps are plotted between [-100Hz,100Hz]. The standard deviation of the frequency shifts are reported under each corresponding B0 map.
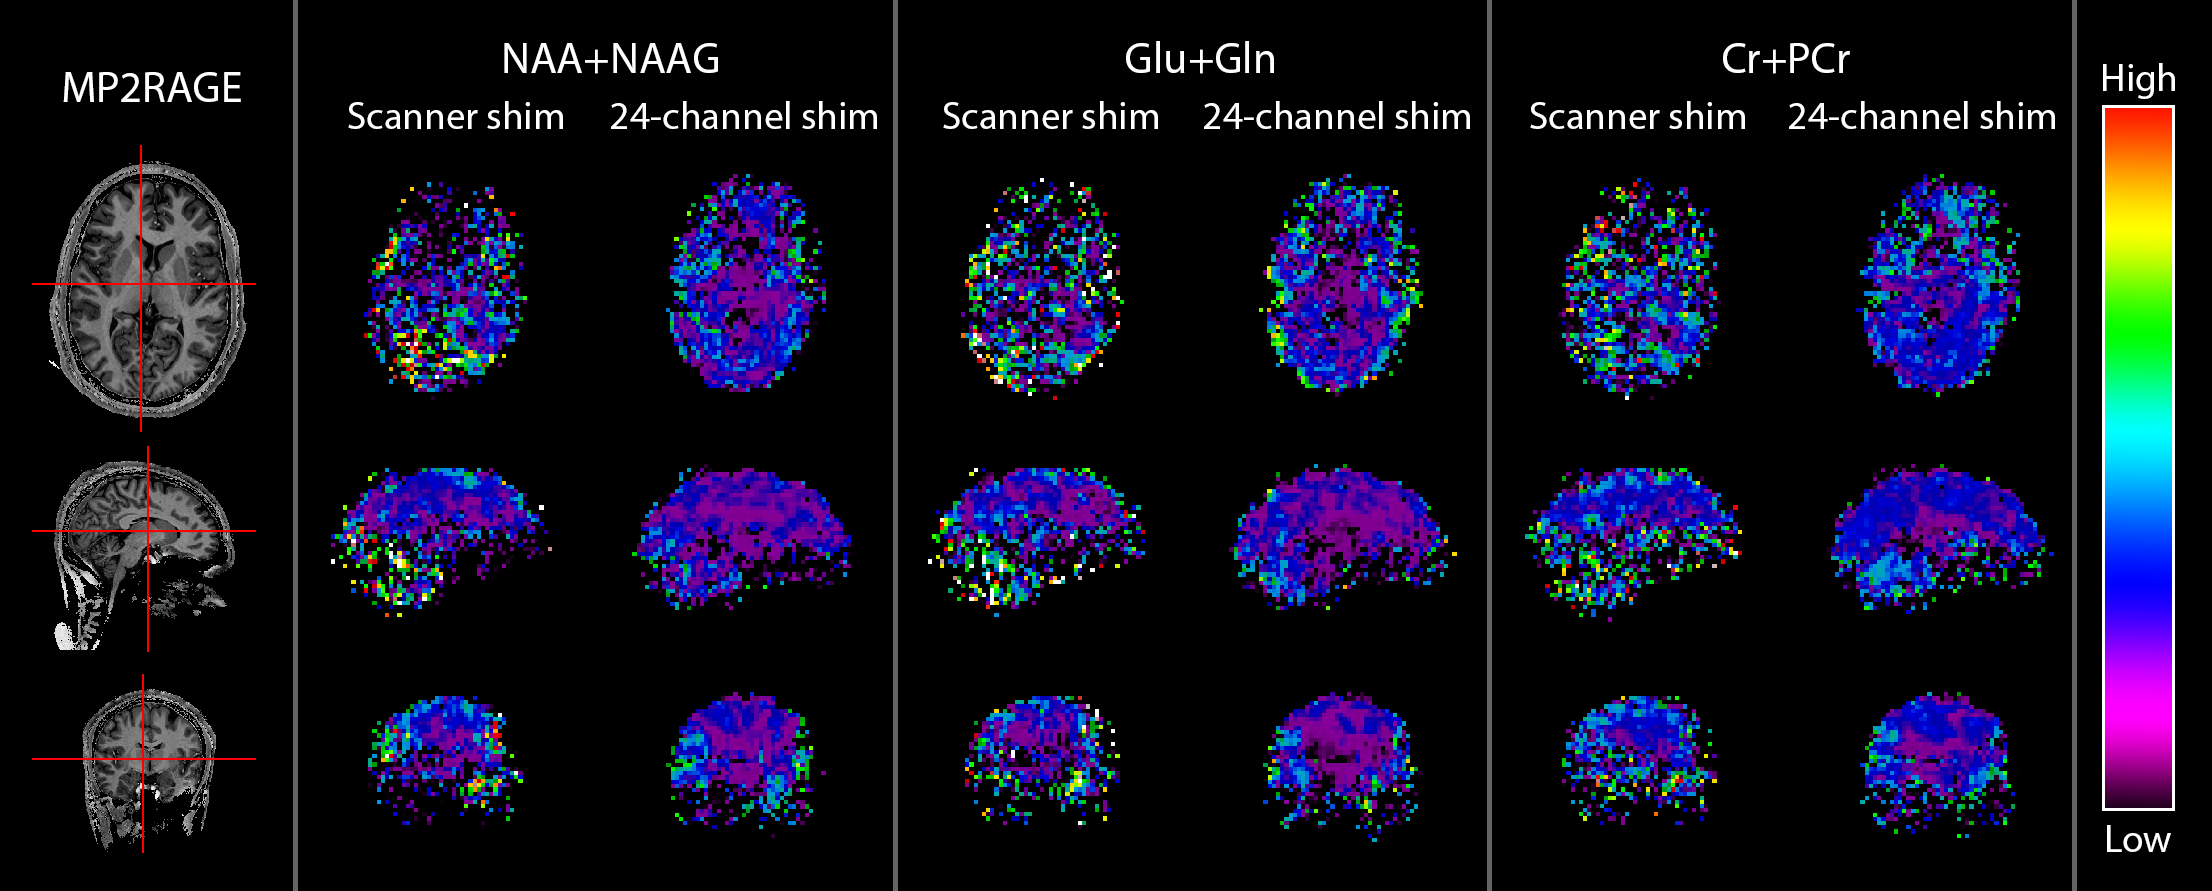
Figure 3: Transversal, sagittal and coronal view of the different metabolite maps in a healthy volunteer, comparing the standard shim with the improved 24-channel shim. Displayed are maps of N-acetylaspartate and N-acetylaspartylglutamate (NAA+NAAG), glutamate and glutamine (Glu+Gln), and creatine and phosphocreatine (Cr+PCr). The transversal slice shown here is located relatively basal in the brain, where the magnetic field is often too bad to get reliable results. A wide color window was used to illustrate the
recovery of lost voxels as a results of the enhanced shim quality.
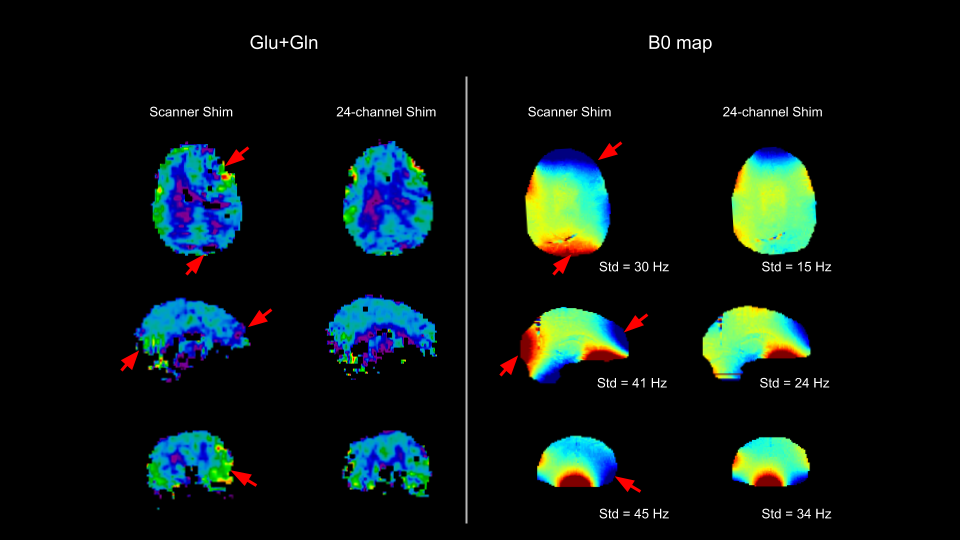
Figure 4: Representative map of glutamate and glutamine (Glu+Gln) for the standard scanner shim and the 24-channel shim, along with the corresponding B0 maps. Regions that suffer from poor B0 shimming quality with the scanner shim are marked by red arrows. The B0 maps are plotted between -60 Hz (blue) and 60 Hz (red) and the corresponding standard deviations are noted below each B0 map.
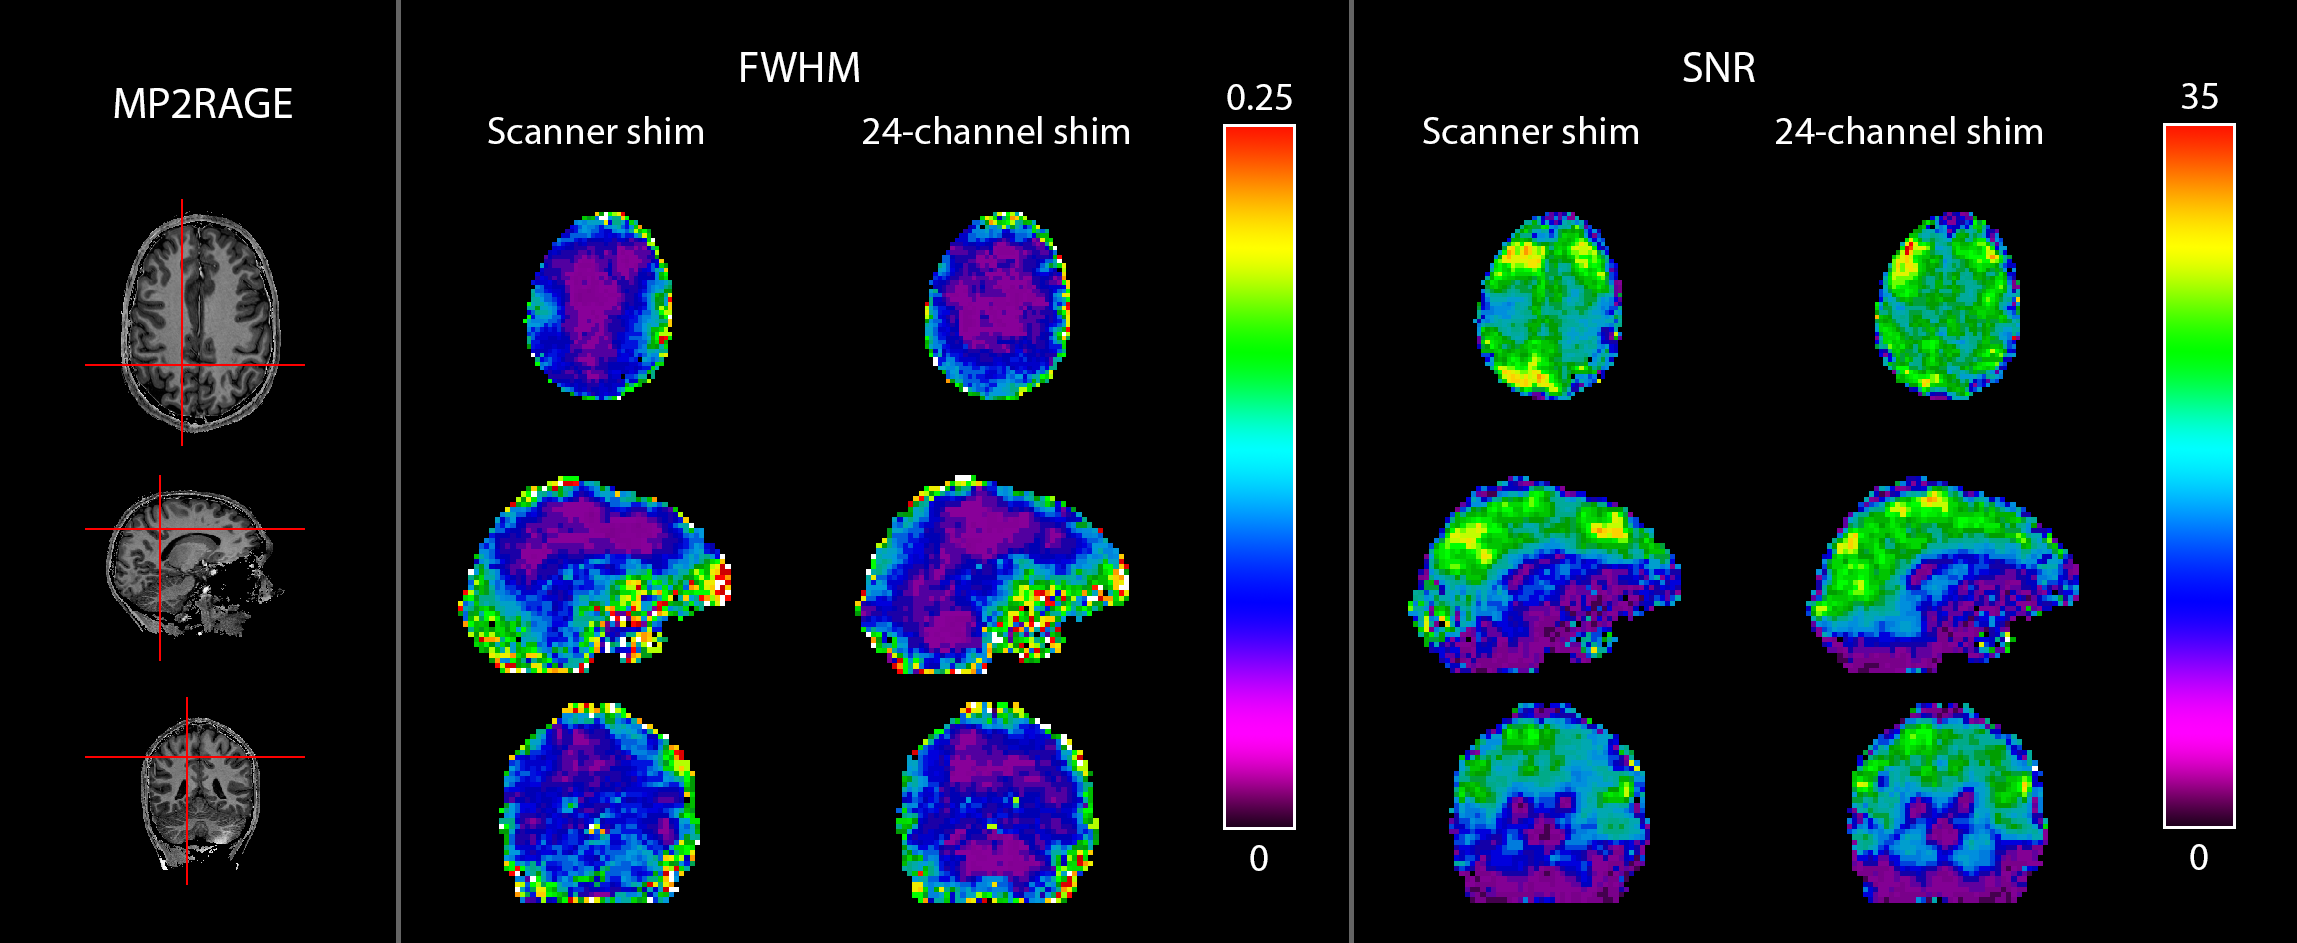
Figure 5: Maps of the full width at half maximum (FWHM in ppm, lower is better) and signal to noise ratio (SNR, higher is better) for the scanner shim and the 24-channel shim. In the basal brain regions, FWHM is overall decreased for the 24-channel shim, corresponding to narrower line widths. Furthermore, some regional improvements of the SNR are also visible.