2219
Assessing the agreement between 3T and 7T MRS measures of in-vivo neurochemistry.1McGill University, Montreal, QC, Canada, 2Centre d'Imagerie Cérébrale, Douglas Mental Health University Institute, Montreal, QC, Canada, 3Radiology, University of Calgary, Calgary, AB, Canada, 4Hotchkiss Brain Institution, Calgary, AB, Canada, 5Alberta Children's Hospital Research Institute, Calgary, AB, Canada
Synopsis
A key challenge in magnetic resonance spectroscopy in the human brain is assessing the reliability of metabolite concentration estimates, since the ground truth is generally unknown. This project assesses the correlations between 3T MRS metabolite measures against two “gold standard” 7T sequences as a means to assess which 3T sequences are the most reliable at detecting common metabolites of interest. This work will help researchers to make informed choices about which sequences to use for optimal detection of their metabolites of interest.
Introduction
A key challenge in in-vivo proton magnetic resonance spectroscopy (1H-MRS) of the brain is that the true concentrations of tissue metabolites are unknown. In-vivo measures are affected by noise and hardware issues, as well as the choice of data-processing and analysis strategies. It is generally thought that the use of ultra-high field strength scanners (7T+) provides increased measurement reliability compared to clinical 1.5 and 3T scanners due to increased SNR and decreased linewidth1. However, most studies do not have access to such systems. Thus, the goal of this work is to understand how well metabolite measures obtained using a 3T scanner corresponds to measures obtained using a 7T scanner.This study compares in-vivo data from participants scanned at 3T and 7T. Using six common 3T pulse sequences and two optimized 7T pulse sequences we aim to determine the reliability of metabolites quantified at both 3T and 7T. This study will help researchers decide which pulse sequence to use at 3T in order to measure specific metabolites of interest.
Methods
13 participants (6M,7F) underwent MRS acquisitions on a 3T Siemen’s Prisma and a 7T Siemen’s Terra scanner. The two imaging sessions were completed on consecutive days at the same time using a counterbalanced field-strength order. Sessions began with a T1-weighted image for voxel placement and segmentation. A voxel measuring 2.5 x 2.5 x 2.5 cm3 was placed in the parietal cortex centred on the midline (Figure 1). Six acquisitions were performed at 3T: four PRESS acquisitions (TR=2000ms, 128 averages) with the echo times of 20ms, 30ms, 40ms, and 80ms; an optimized STEAM acquisition (TE/TR/TM=8/2000/32, 128 averages); and SPECIAL (TE/TR=8.5/2500, 128 averages) sequences were acquired. At 7T, an optimized STEAM acquisition (TE/TR/TM=8/5000/40ms, 64 averages), and short echo semi-LASER (TE/TR=34/5000ms, 64 averages)2 were performed.Data were processed using FID-A3 and analysed in LCmodel4 using custom-made basis sets (components shown in Figure 2) including macromolecule parameterizations5. Tissue segmentation was performed using FSL FAST6,7 and absolute metabolite concentrations (mmol/L) were estimated using tissue correction to account for tissue dependent T1, T2, and water density8. Correlations between 7T and 3T measures were assessed using Pearson’s correlation. If a sequence failed to detect a metabolite in >25% of participants, those measures were excluded from analysis.
Results and Discussion
SNR ranged from 31-114 and linewidth (FWHM) ranged from 0.016-0.037 ppm. There was generally good agreement between the 7T STEAM and semi-LASER measures, while there was substantial departure when comparing the 3T and 7T data to one another (Figure 2). The average overall correlation between 3T and 7T measures was relatively low, with 3T 30ms PRESS and 7T 34ms semi-LASER having the highest correlation (r=0.31, averaged across all metabolites, Figure 3). In the figures that follow, selected metabolites of interest will be discussed in greater detail.Choline: 7T STEAM was unable to detect phosphocholine (PCh) in >¾ of participants (Figure 2). Aside from 20ms and 30ms PRESS which was undetected , we found high correspondence between all PCh 3T measures and 7T semi-LASER (r>0.6) (Figure 4A). In comparison, glycerophosphocholine (GPC) was either undetectable at 3T or poorly correlated with the 7T semi-LASER measure. The tCho correlations between 3T measures and 7T semi-LASER were lower than the individual PCh peak (r=0.17-0.63). This is puzzling due to the fact that GPC has a more prominent peak than PCh9, indicating that it should be more reliably quantified. One possible explanation may be that GPC levels fluctuate to a greater degree on a day-by-day basis, compared to PCh, and thus are poorly correlated between the 3T and 7T scans which were completed on consecutive days.
Creatine: 7T STEAM had higher correlations with the 3T measures for creatine than 7T semi-LASER (Figure 2). Overall, creatine, phosphocreatine, and even tCr had generally poor correlations between 3T and 7T measures (Figure 4B), a surprising finding given the prominence of the creatine peaks at both 3T and 7T. Interestingly, phosphocreatine’s correlation between 3T measures and 7T STEAM appears to decrease as echo time of the 3T measure is increased.
NAA: 7T STEAM had higher correlations with the 3T measures for NAA than 7T semi-LASER (Figure 2). Overall, tNAA was slightly more correlated between 3T measures and the 7T STEAM, but similarly to tCr, the level of correlation between 3T and 7T measures were both low (Figure 4C).
Myo-Inositol and Glycine: Glycine was generally poorly quantified with the pulse sequences used in this study at both 3T and 7T (Figure 5). In >½ of participants, glycine was not detected using 3T 20ms and 30ms PRESS. Even when detected, there were inconsistent correlations between 3 and 7T measures. Interestingly, myo-inositol was better correlated between 3T and 7T measures than the summed myo-inositol+glycine peak. This is likely due to unreliable glycine detection and the resulting noise added into this summed peak, suggesting that at 3T researchers may be better off analysing the myo-inositol peak alone, rather than the summed peak.
Conclusion
These findings provide evidence for the reliability of common metabolite MRS acquisition methods at both 3T and 7T. It is hoped that this work will help researchers to make informed decisions about which pulse sequences to use in order to detect certain metabolites of interest.Acknowledgements
Jamie Near is funded by CIHR (PJT-165869) and NSERC (RGPIN-2020-05917).
Ashley Harris is funded by NSERC (RGPIN-2017-03875) and holds a Canada Research Chair in MRS in Brain Injury.
Tiffany Bell is funded by the Hotchkiss Brain Institute.
References
1. Tkác, I., Oz, G., Adriany, G., Uğurbil, K., & Gruetter, R. (2009). In vivo 1H NMR spectroscopy of the human brain at high magnetic fields: metabolite quantification at 4T vs. 7T. Magnetic resonance in medicine, 62(4), 868–879. https://doi.org/10.1002/mrm.22086
2. Klomp DW, Bitz AK, Heerschap A, Scheenen TW. Proton spectroscopic imaging of the human prostate at 7 T. NMR Biomed. 2009;22:495-501.
3. Simpson, R., Devenyi, G. A., Jezzard, P., Hennessy, T. J., & Near, J. (2017). Advanced processing and simulation of MRS data using the FID appliance (FID‐A)—an open source, MATLAB‐based toolkit. Magnetic resonance in medicine, 77(1), 23-33.Provencher, S. W. (2014).
4. LCModel & LCMgui user’s manual. LCModel Version, 6-2.
5. Fowler, C. F., Madularu, D., Dehghani, M., Devenyi, G. A., & Near, J. (2020). Longitudinal Quantification of Metabolites and Macromolecules Reveals Age-and Sex-Related Changes in the Healthy Fischer 344 Rat Brain. bioRxiv.
6. Jenkinson, M., Beckmann, C. F., Behrens, T. E., Woolrich, M. W., & Smith, S. M. (2012). FSL. NeuroImage, 62(2), 782–790. https://doi.org/10.1016/j.neuroimage.2011.09.015
7. Zhang, Y. and Brady, M. and Smith, S. Segmentation of brain MR images through a hidden Markov random field model and the expectation-maximization algorithm. IEEE Trans Med Imag, 20(1):45-57, 2001.
8. Dhamala, E, Abdelkefi, I, Nguyen, M, Jay Hennessy, T, Nadeau, H, Near, J. Validation of in vivo MRS measures of metabolite concentrations in the human brain. NMR in Biomedicine. 2019; 32:e4058. https://doi.org/10.1002/nbm.4058
9. Govindaraju, V., Young, K., & Maudsley, A. A. (2000). Proton NMR chemical shifts and coupling constants for brain metabolites. NMR in Biomedicine: An International Journal Devoted to the Development and Application of Magnetic Resonance In Vivo, 13(3), 129-153.
Figures
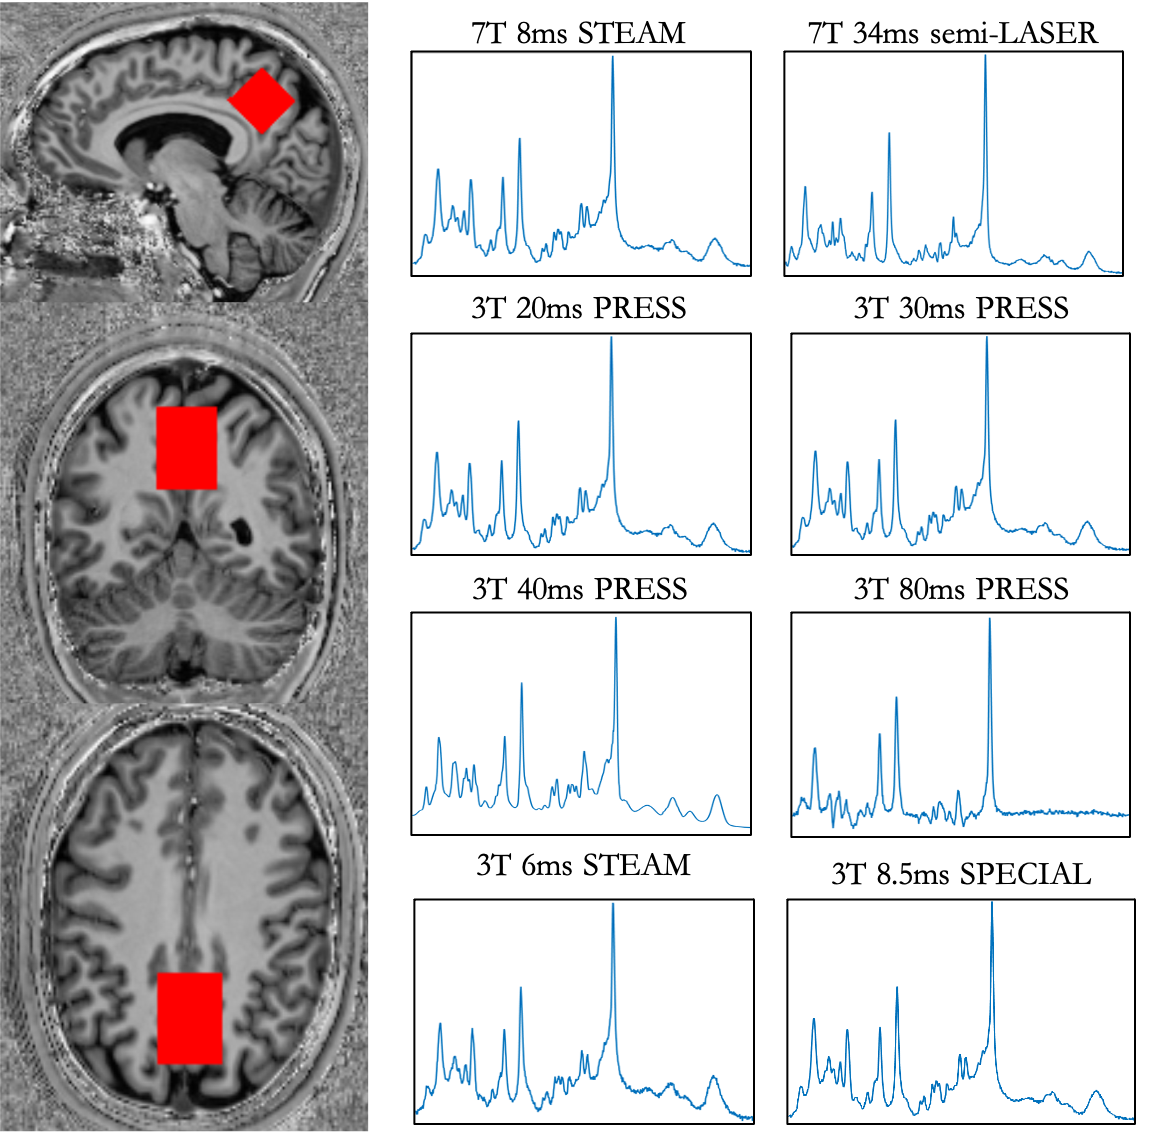
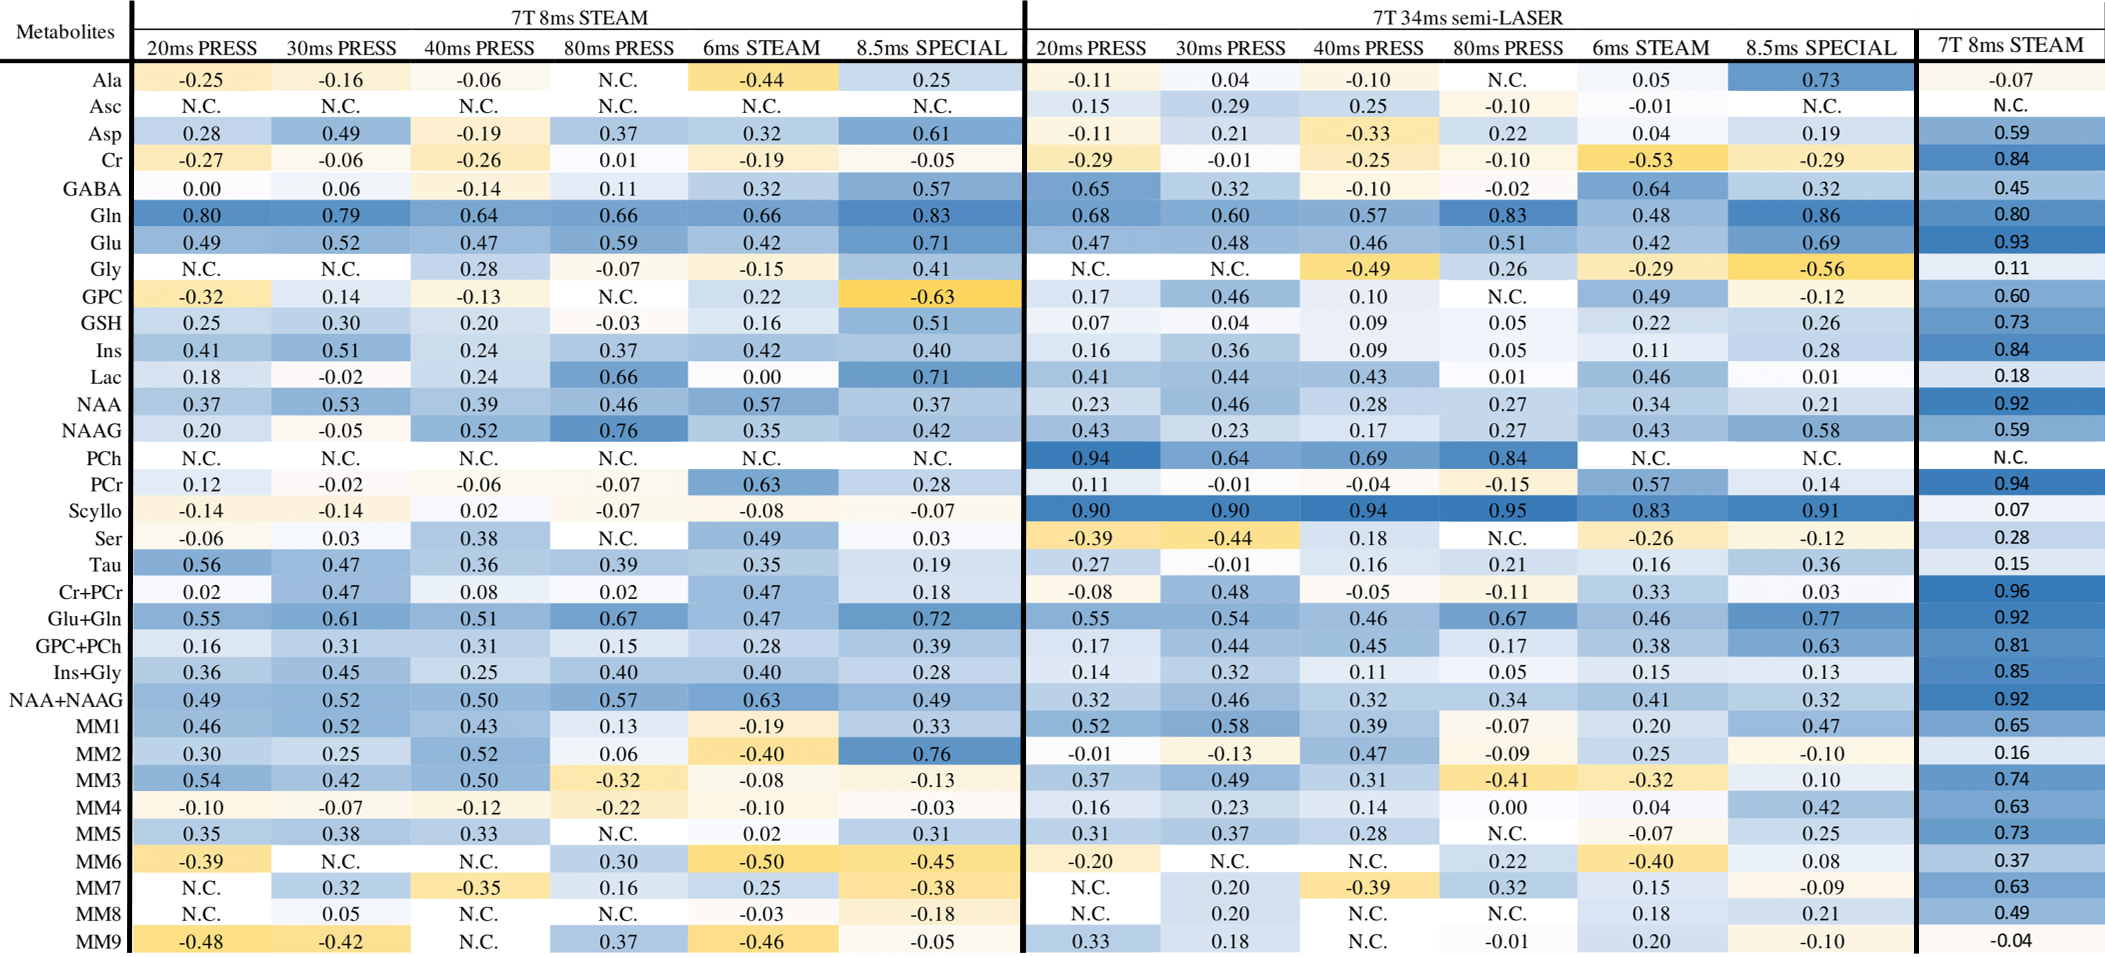
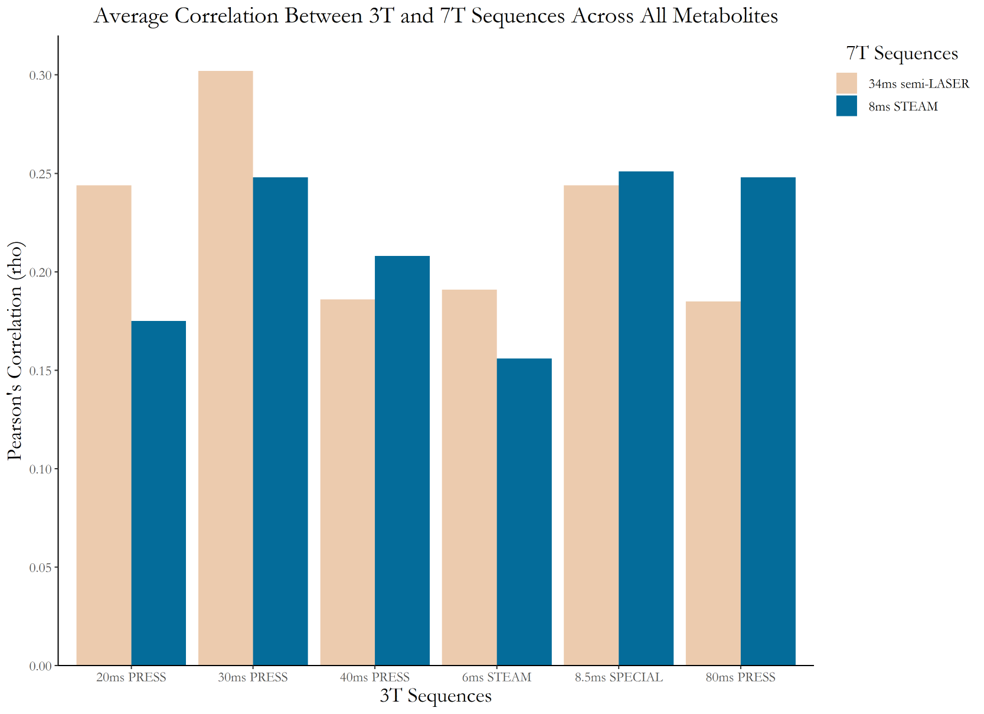
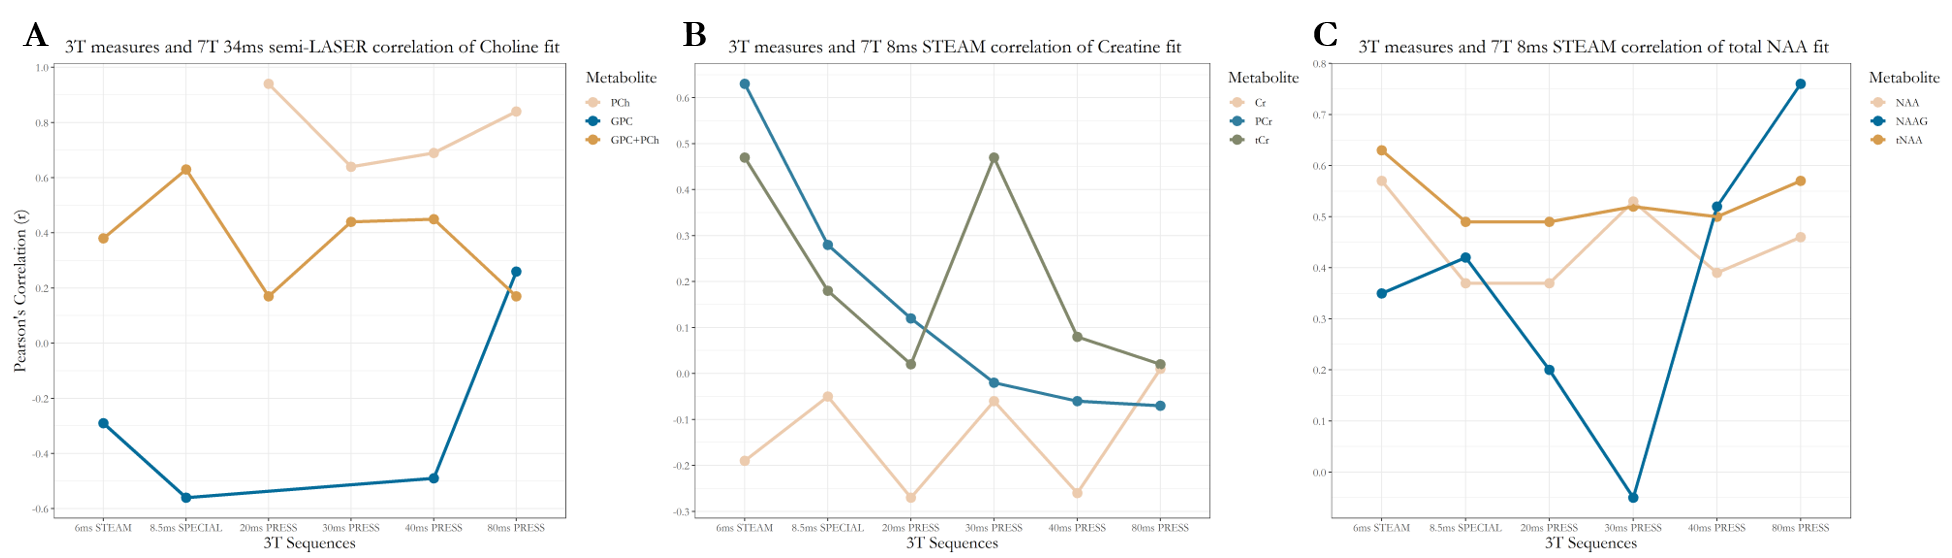
Figure 4. Evaluation of the correlations between 3T and 7T measures of the three major peaks found in MRS measures of the human brain. A. Pearson’s correlation coefficient (r) between 3T sequences and 7T 34ms semi-LASER for phosphocholine, glycerophosphocholine, and total choline. B. R-value between 3T and 7T 8ms STEAM for creatine, phosphocreatine, and total creatine. C. R-value between 3T and 7T 8ms STEAM for NAA, NAAG, and tNAA.
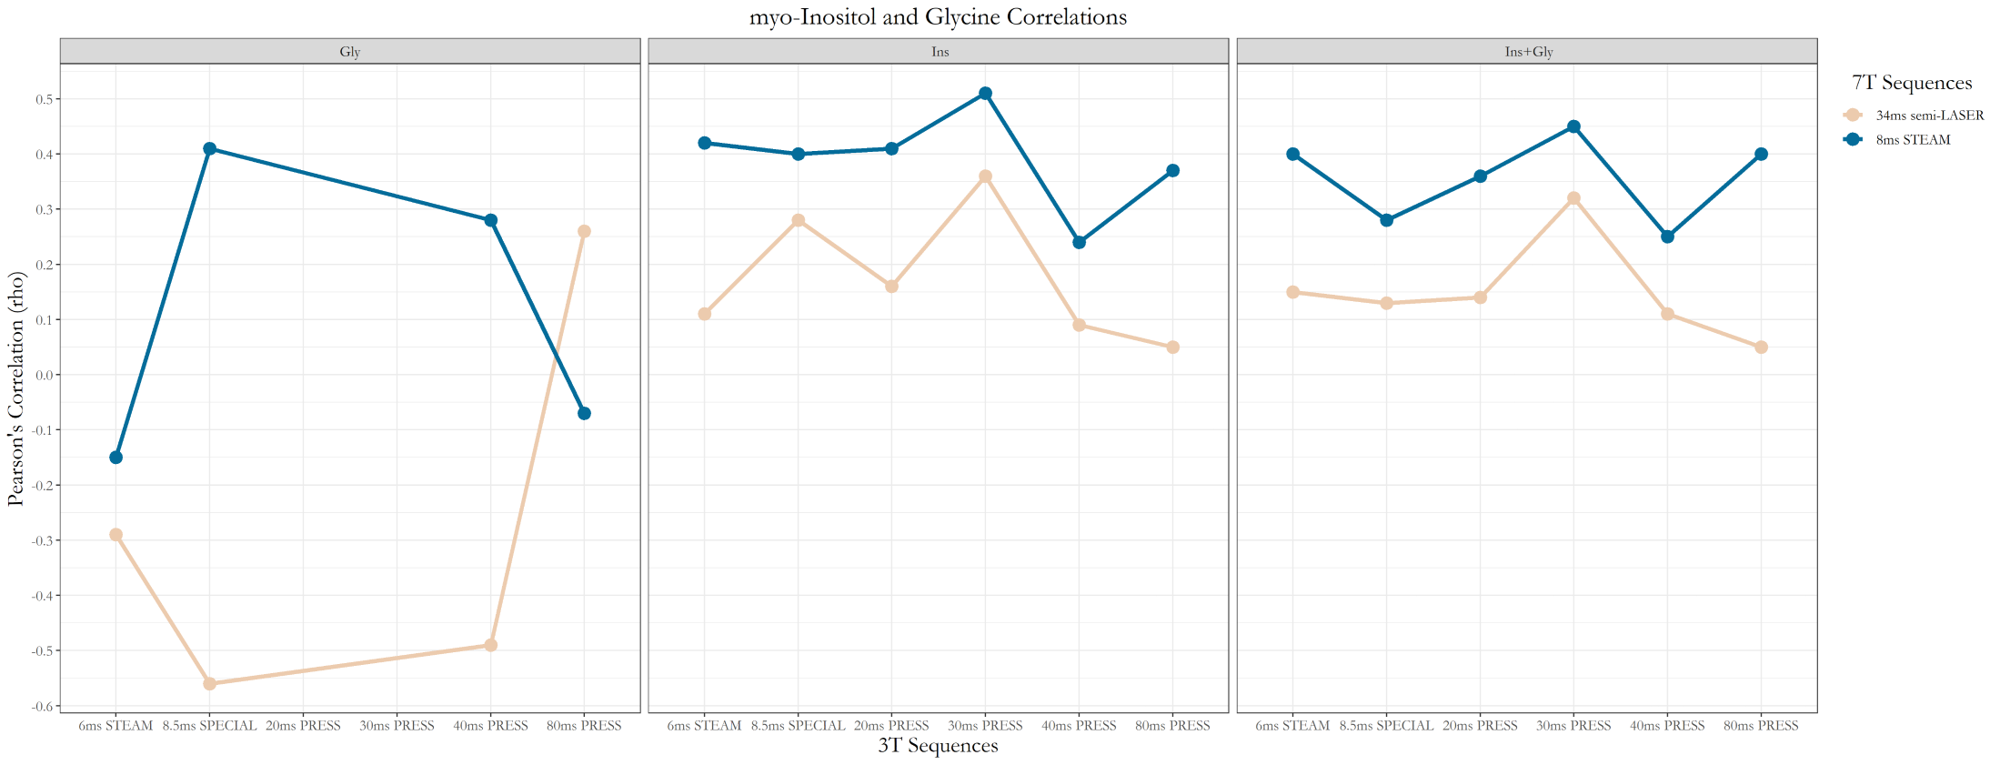
Figure 5. Pearson’s correlation coefficient (r) shown for the absolute quantification of Glycine (left), myo-Inositol (middle) and summed myo-Inositol + Glycine peaks between 3T and 7T sequences. Overall, Glycine is poorly quantified at both 3T and 7T and is not detected using PRESS 20ms or 30ms sequences. myo-Inositol appears to be more highly correlated between 3T and 7T measures than summed Ins+Gly due to the high variability of the Glycine quantification.