2218
1H MR spectroscopic imaging for identifying diffuse abnormalities in mild traumatic brain injury: initial results from a reproducibility study
Anna M Chen1, Teresa Gerhalter1, Seena Dehkharghani1,2, Rosemary Peralta1, Fatemeh Adlparvar1, Martin Gajdošík3, Mickael Tordjman1,4, Julia Zabludovsky1, Sulaiman Sheriff5, James S Babb1, Tamara Bushnik6, Jonathan M Silver7, Brian S Im6, Stephen P Wall8, Guillaume Madelin1, and Ivan I Kirov1,2,9
1Center for Biomedical Imaging, Department of Radiology, New York University Grossman School of Medicine, New York, NY, United States, 2Department of Neurology, New York University Grossman School of Medicine, New York, NY, United States, 3Department of Biomedical Engineering, Columbia University School of Engineering and Applied Science, New York, NY, United States, 4Department of Radiology, Cochin Hospital, Paris, France, 5Department of Radiology, University of Miami Miller School of Medicine, Miami, FL, United States, 6Department of Rehabilitation Medicine, New York University Grossman School of Medicine, New York, NY, United States, 7Department of Psychiatry, New York University Grossman School of Medicine, New York, NY, United States, 8Ronald O. Perelman Department of Emergency Medicine, New York University Grossman School of Medicine, New York, NY, United States, 9Center for Advanced Imaging Innovation and Research, Department of Radiology, New York University Grossman School of Medicine, New York, NY, United States
1Center for Biomedical Imaging, Department of Radiology, New York University Grossman School of Medicine, New York, NY, United States, 2Department of Neurology, New York University Grossman School of Medicine, New York, NY, United States, 3Department of Biomedical Engineering, Columbia University School of Engineering and Applied Science, New York, NY, United States, 4Department of Radiology, Cochin Hospital, Paris, France, 5Department of Radiology, University of Miami Miller School of Medicine, Miami, FL, United States, 6Department of Rehabilitation Medicine, New York University Grossman School of Medicine, New York, NY, United States, 7Department of Psychiatry, New York University Grossman School of Medicine, New York, NY, United States, 8Ronald O. Perelman Department of Emergency Medicine, New York University Grossman School of Medicine, New York, NY, United States, 9Center for Advanced Imaging Innovation and Research, Department of Radiology, New York University Grossman School of Medicine, New York, NY, United States
Synopsis
We present initial results from a reproducibility study of 1H MRSI in mild traumatic brain injury. In line with previous investigations in a separate cohort, linear regression analysis revealed white matter differences between patients and controls, which persisted when comparing only non-recovered patients to controls. In contrast to previous findings, however, the differences were not in N-acetyl aspartate (NAA), but in the glial markers creatine (Cr), choline (Cho), and myo-inositol (mI). Correlations were found between metabolites and neuropsychological testing in grey matter (GM), and between metabolites and symptomatology in white matter (WM).
Introduction
Traumatic brain injury (TBI) is a global health concern1, with mild TBI (mTBI) accounting for 75%-90% of cases2,3. TBI sequelae can be histologically explained by axonal varicosities known as diffuse axonal injury4,5, but this pathology is not detectable using conventional CT and MRI6. Proton (1H) MRS is a technique sensitive to neurochemical alterations which may enable more precise evaluation of TBI severity and prognostication7 when macroscopic structural damage is lacking. N-acetyl-aspartate (NAA), glutamate plus glutamine (Glx), creatine (Cr), choline (Cho), and myo-inositol (mI), markers for neuronal integrity, glutamate cycle, cellular energy, membrane turnover, and astroglia, respectively, are altered after TBI8,9. Unfortunately, varying results in regard to which metabolite(s) are most likely to be affected and what brain region(s) should be sampled, contribute to the limited clinical use of MRS in TBI. 1H MR spectroscopic imaging (1H MRSI) has shed light on the regional distribution of metabolite findings, but a key part of translating the new knowledge to the clinic rests on determining how reproducible are the results of any particular study. We present initial data from a project intending to test the reproducibility of findings from previous studies10–12 with a different mTBI cohort, while keeping the following key parameters constant: MRSI post-processing (global linear regression), patient source (metropolitan ER and concussion clinic), proportion of complicated mTBI (mostly MRI-negative) and time from injury (~20 days post-TBI). Additionally, we are acquiring previously unavailable patient outcome measures, including neuropsychological testing. We hypothesized that, as previously reported10–12, abnormalities would be predominantly (1) diffuse, (2) confined to WM, (3) comprising of low NAA and normal glial markers; and that these findings would (4) correlate with clinical presentation.Materials & Methods
17 mTBI patients (12 female, 33.2±9.9 years) within about one month after injury and 13 age- and gender-matched healthy controls (7 female, 30.1±8.8 years) were scanned at 3T (Siemens MAGNETOM Prisma) with a 20-channel transmit-receive head coil. Imaging parameters are outlined in Table 1A. 3D MPRAGE was acquired for anatomical localization, along with FLAIR and SWI for radiological assessment. 1H-MRSI was obtained with a whole-brain 3D EPSI sequence, as described previously13. Data were processed using the PRANA module within the Metabolite Imaging and Data Analyses System package, as described previously14,15. Spectra included in the analysis met the following quality criteria: Cramer–Rao lower bound (CRLB) <20% and linewidth 2-12 Hz. Voxels valued ≥3 standard deviations from the mean were defined as outliers and excluded16,17. Linear regression analysis was performed for eight bilateral atlas-defined lobar brain regions. Left and right hemispheric data were averaged to obtain metabolite levels for frontal, parietal, temporal, and occipital lobes. All patients underwent the following clinical and neuropsychological testing: Rivermead post-concussion symptoms questionnaire (RPQ)18, the Glasgow Outcome Scale – Extended (GOSE)19, and the Brief Test of Adult Cognition by Telephone (BTACT)20. Patients and controls were compared using a Mann-Whitney (MW) test. Spearman rank correlations with and without adjustment for elapsed time from injury were used to assess the association between metabolite concentrations and BTACT and RPQ. Statistical significance was defined as p<0.05.Results
Demographics, clinical and neuropsychological testing results are compiled in Table 1B. At the time of scanning, two patients had recovered (GOSE=8). Examples of spectroscopic maps (Fig. 1) and spectra (Fig. 2) are presented. Linear regression analysis showed a trend of unidirectionally higher mean and median WM Cho and Cr in patients compared to controls across all lobes (Fig. 3), with statistically significant differences only detected for Cho in the occipital, and Cr in the occipital and parietal lobes. Cohen’s d for these comparisons ranged from -0.20 to -0.43 for Cho, and -0.24 to -0.49 for Cr (Table 2A). These statistically significant differences remained when comparing non-recovered patients (GOSE<8) to controls (Table 2B). Statistically significant direct and partial correlations (without and with adjustment for the elapsed time from injury to imaging, respectively) with assessments revealed positive associations both between GM and BTACT, and between WM and RPQ (Table 2C).Discussion
Our initial data (40% of the planned final sample size) provide preliminary evidence in support of three of the four hypotheses. Linear regression analysis yielded statistically significant results only in WM, supporting previous findings of global WM, but not global GM injury10 (hypotheses 1 and 2). In contrast to hypothesis 3, however, the findings were among the glial markers Cho, Cr and mI, not NAA. Correlations with clinical presentations (hypothesis 4) were not seen for all abnormalities, and RPQ and BTACT correlated with metabolites which did not differ between patients and controls. BTACT correlated only with metabolites in GM, while RPQ correlated only with metabolites in WM. Given the connection between cognition (measured by the BTACT) and GM, and somatic symptoms (assessed by the RPQ) and WM, these preliminary results are noteworthy. We also noted that in the lobes where WM Cr and Cho did not show statistically significant differences, the effect sizes were unidirectional (Table 2A), suggesting lack of statistical power12, rather than lobe-specific injuries. Completing our enrollment and data analysis will test this hypothesis and reveal the extent to which 1H MRSI results can be expected to vary within similar study designs.Acknowledgements
This work was supported by grants R01NS097494 and R01EB026456 from the National Institutes of Health (NIH).References
- Dewan MC, Rattani A, Gupta S, et al. Estimating the global incidence of traumatic brain injury. J Neurosurg. 2019;130(4):1080-1097. doi:10.3171/2017.10.JNS173522.
- Prince C, Bruhns M. Evaluation and Treatment of Mild Traumatic Brain Injury: The Role of Neuropsychology. Brain Sci. 2017;7(12):105. doi:10.3390/brainsci70801053.
- Kay T, Harrington DE, Adams R. American Congress of Rehabilitation Medicine, Head Injury Interdisciplinary Special Interest Group. Definition of mild traumatic brain injury. J Head Trauma Rehabil. 1993;8(3):86-87. https://www.acrm.org/wp-content/uploads/pdf/TBIDef_English_10-10.pdf%0Apapers2://publication/uuid/1E91D994-F6EB-44E6-9508-05A5E2A870D6.4.
- Johnson VE, Stewart W, Smith DH. Axonal pathology in traumatic brain injury. Exp Neurol. 2013;246:35-43. doi:10.1016/j.expneurol.2012.01.0135.
- Davceva N, Basheska N, Balazic J. Diffuse Axonal Injury—A Distinct Clinicopathological Entity in Closed Head Injuries. Am J Forensic Med Pathol. 2015;36(3):127-133. doi:10.1097/PAF.00000000000001686.
- Blennow K, Brody DL, Kochanek PM, et al. Traumatic brain injuries. Nat Rev Dis Prim. 2016;2(1):16084. doi:10.1038/nrdp.2016.847.
- Marino S, Ciurleo R, Bramanti P, Federico A, De Stefano N. 1H-MR Spectroscopy in Traumatic Brain Injury. Neurocrit Care. 2011;14(1):127-133. doi:10.1007/s12028-010-9406-68.
- Lin AP, Liao HJ, Merugumala SK, Prabhu SP, Meehan WP, Ross BD. Metabolic imaging of mild traumatic brain injury. Brain Imaging Behav. 2012;6(2):208-223. doi:10.1007/s11682-012-9181-49.
- Kierans AS, Kirov II, Gonen O, et al. Myoinositol and glutamate complex neurometabolite abnormality after mild traumatic brain injury. Neurology. 2014. doi:10.1212/WNL.000000000000010510.
- Kirov II, Tal A, Babb JS, Lui YW, Grossman RI, Gonen O. Diffuse axonal injury in mild traumatic brain injury: a 3D multivoxel proton MR spectroscopy study. J Neurol. 2013;260(1):242-252. doi:10.1007/s00415-012-6626-z11.
- Kirov II, Tal A, Babb JS, et al. Proton MR Spectroscopy Correlates Diffuse Axonal Abnormalities with Post-Concussive Symptoms in Mild Traumatic Brain Injury. J Neurotrauma. 2013;30(13):1200-1204. doi:10.1089/neu.2012.269612.
- Davitz MS, Gonen O, Tal A, Babb JS, Lui YW, Kirov II. Quantitative multivoxel proton MR spectroscopy for the identification of white matter abnormalities in mild traumatic brain injury: Comparison between regional and global analysis. J Magn Reson Imaging. 2019;50(5):1424-1432. doi:10.1002/jmri.2671813.
- Ding XQ, Maudsley AA, Sabati M, Sheriff S, Dellani PR, Lanfermann H. Reproducibility and reliability of short-TE whole-brain MR spectroscopic imaging of human brain at 3T. Magn Reson Med. 2015. doi:10.1002/mrm.2520814.
- Maudsley AA, Darkazanli A, Alger JR, et al. Comprehensive processing, display and analysis for in vivo MR spectroscopic imaging. NMR Biomed. 2006;19(4):492-503. doi:10.1002/nbm.102515.
- Maudsley AA, Domenig C, Govind V, et al. Mapping of brain metabolite distributions by volumetric proton MR spectroscopic imaging (MRSI). Magn Reson Med. 2009. doi:10.1002/mrm.2187516.
- Maudsley AA, Domenig C, Sheriff S. Reproducibility of serial whole-brain MR Spectroscopic Imaging. NMR Biomed. 2010;23(3):251-256. doi:10.1002/nbm.144517.
- Kreis R. Issues of spectral quality in clinical1H-magnetic resonance spectroscopy and a gallery of artifacts. NMR Biomed. 2004;17(6):361-381. doi:10.1002/nbm.89118.
- King NS, Crawford S, Wenden FJ, Moss NEG, Wade DT. The Rivermead Post Concussion Symptoms Questionnaire: a measure of symptoms commonly experienced after head injury and its reliability. J Neurol. 1995;242(9):587-592. doi:10.1007/BF0086881119.
- Wilson JTL, Pettigrew LEL, Teasdale GM. Structured interviews for the glasgow outcome scale and the extended glasgow outcome scale: Guidelines for their use. J Neurotrauma. 1998;15(8):573-580. doi:10.1089/neu.1998.15.57320.
- Tun PA, Lachman ME. Telephone assessment of cognitive function in adulthood: The Brief Test of Adult Cognition by Telephone [3]. Age Ageing. 2006;35(6):629-632. doi:10.1093/ageing/afl095
Figures
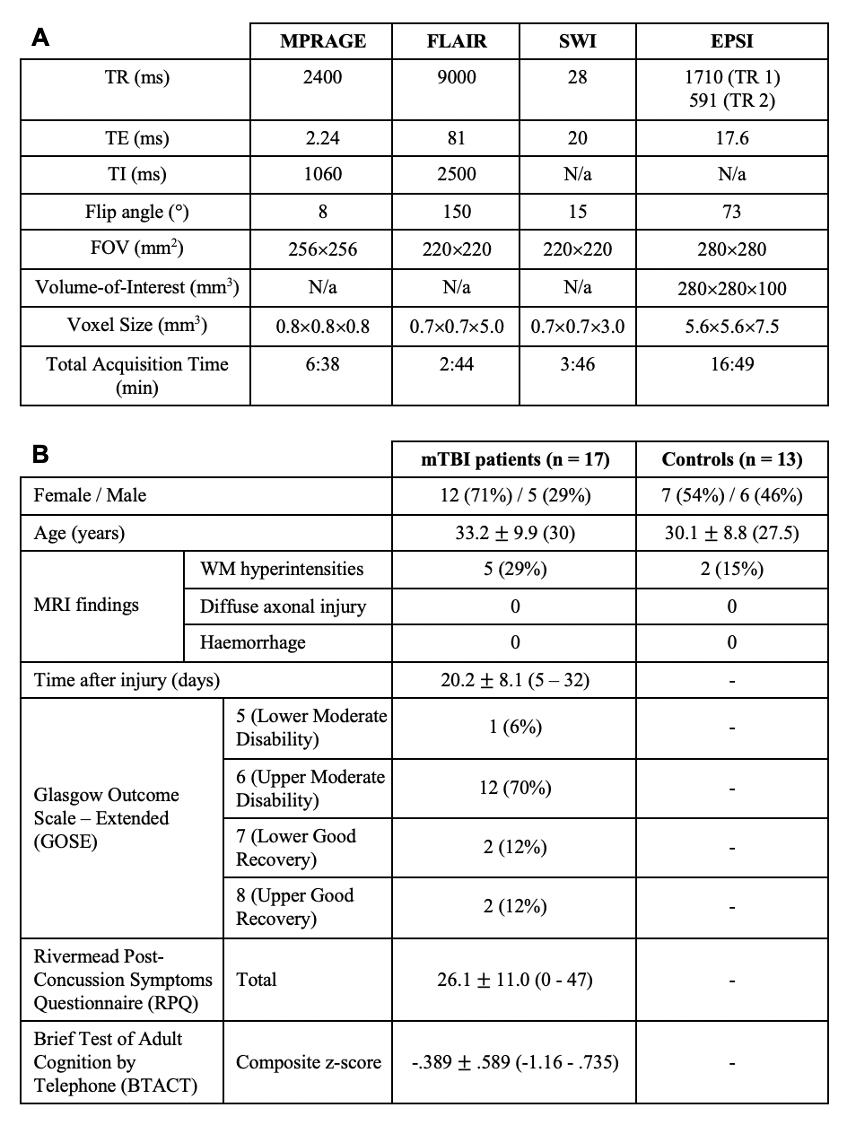
Table 1: Imaging parameters (A) and demographics and clinical characteristics of study population (B). Median value, range or percentage of population are presented in parentheses. The Rivermead Post-Concussion Symptoms Questionnaire (RPQ) measures symptom severity and is summarized in the RPQ total score18. The Brief Test of Adult Cognition by Telephone (BTACT) provided sub-scores in memory, executive function, and reasoning, which are summarized in a composite z-score of cognitive function20.
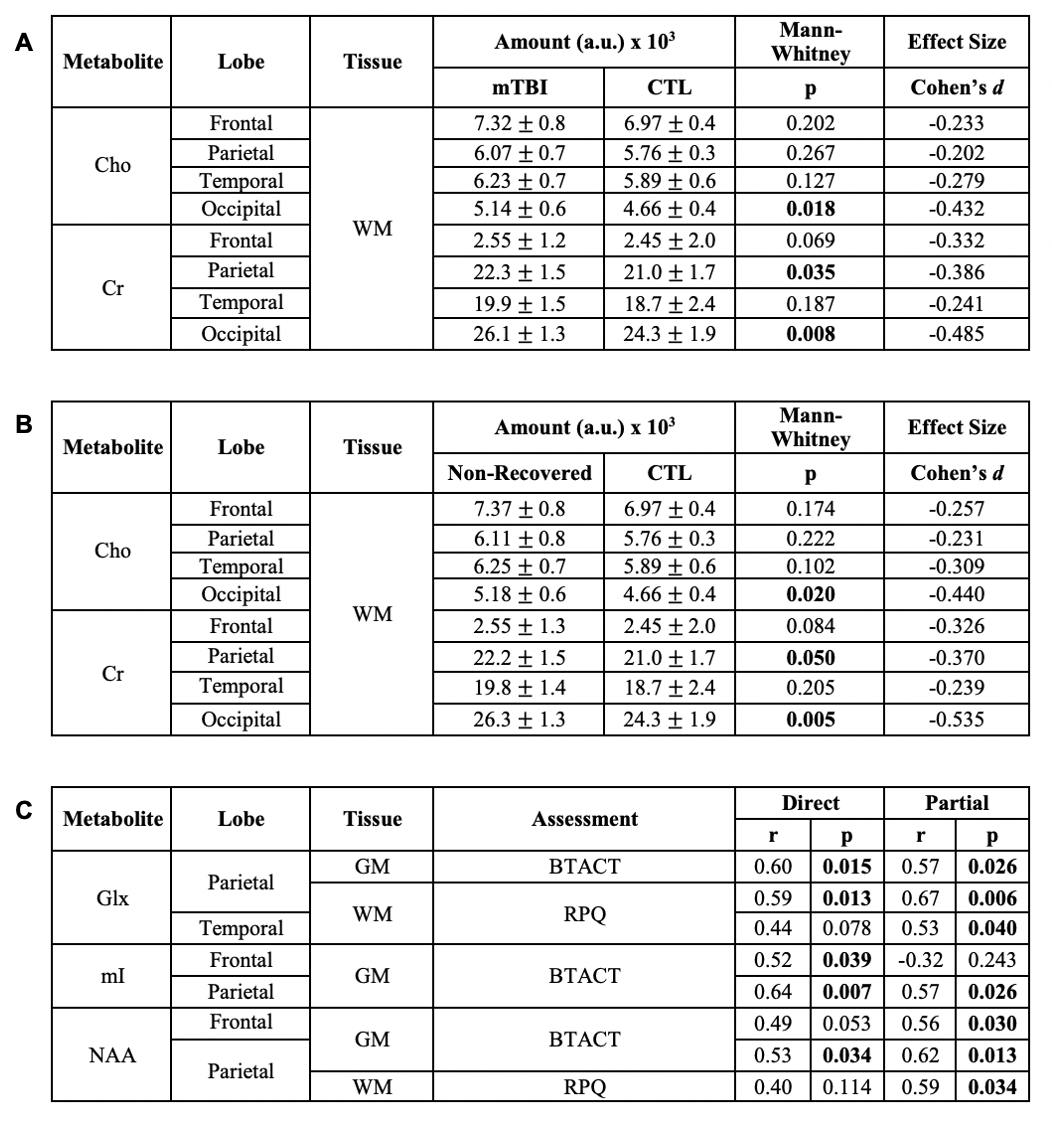
Table 2: Group differences between controls (CTL, n=13) and (A) mTBI patients (n=17) and (B) non-recovered patients only (n=15); and (C) Spearman correlations. Statistically significant results are in bold. Note all statistically significant comparisons in (A) are maintained in (B). For (C), r and p values are shown for the association of each metabolite with scores from the Brief Test of Adult Cognition by Telephone (BTACT) and Rivermead Post-Concussion Symptoms Questionnaire (RPQ), without (direct) and with (partial) adjustment for the elapsed time from injury to imaging.
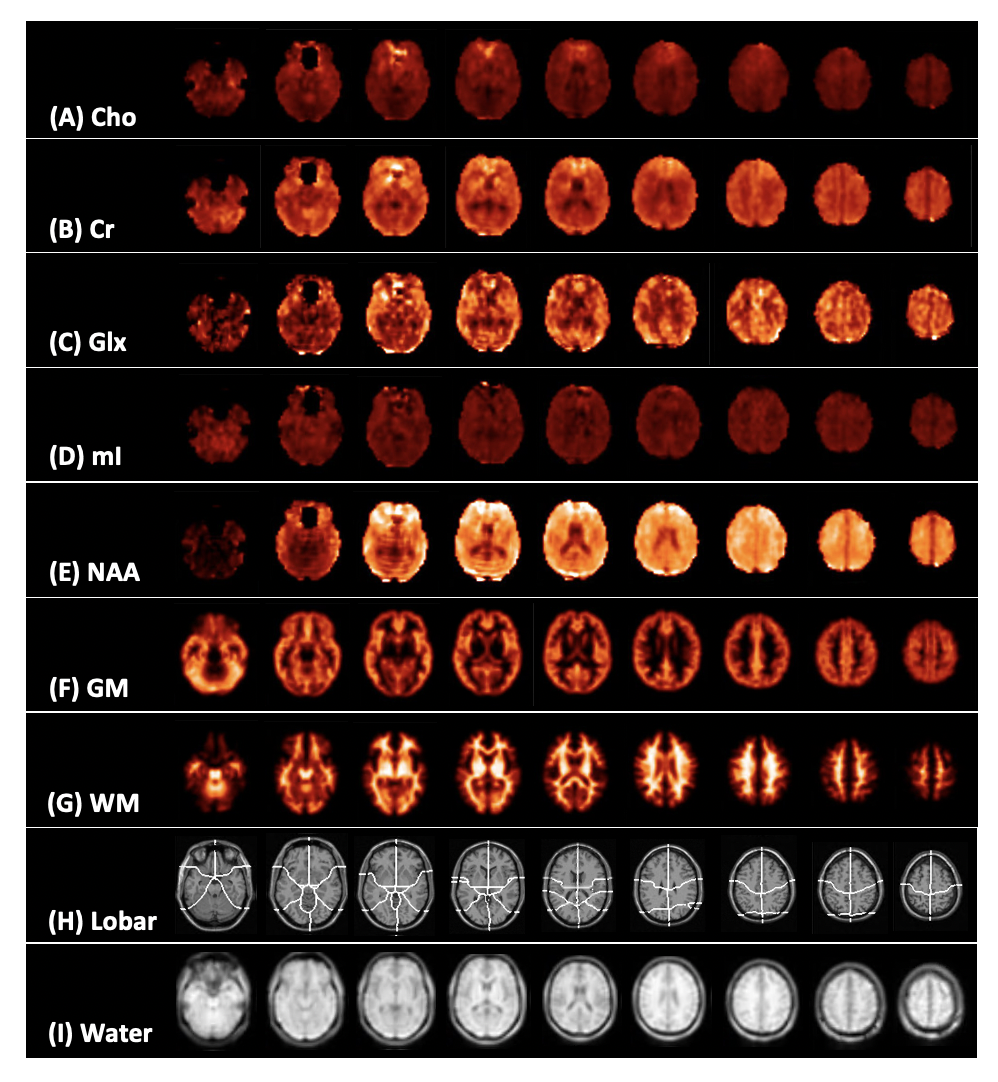
Figure 1: Representative spectroscopic map images for a single control subject. Presented is every fifth slice from the volumetric data for (A) creatine (Cr), (B) choline (Cho), (C) myo-inositol (mI), (D) glutamate plus glutamine (Glx), (E) N-acetyl aspartate (NAA), (F) grey and (G) white matter segmentation (GM, WM), (H) lobar parcellation, and (I) water (used as quantification reference) at the spectroscopic image spatial resolution.
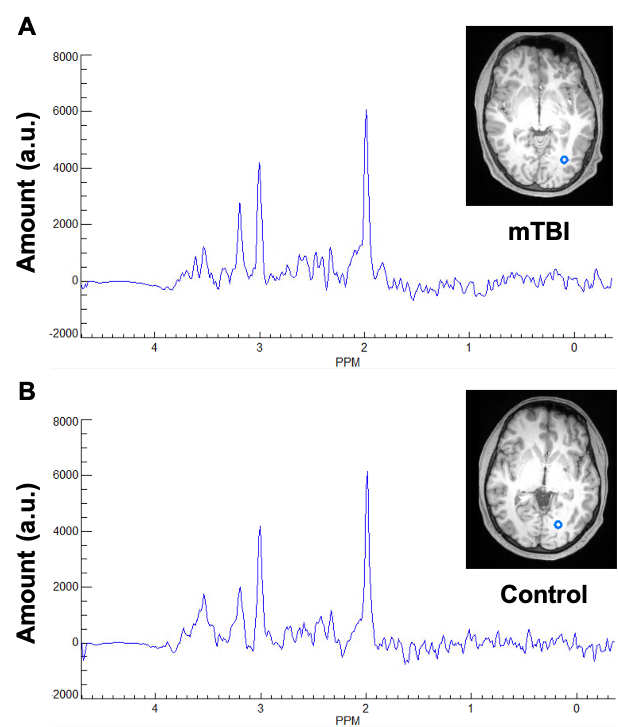
Figure 2: Representative occipital lobe white matter spectra for (A) a single mTBI patient and (B) a single control subject. Shown on the right of each spectra is the corresponding T1-weighted MPRAGE image, slice, and voxel from which the spectra were obtained.
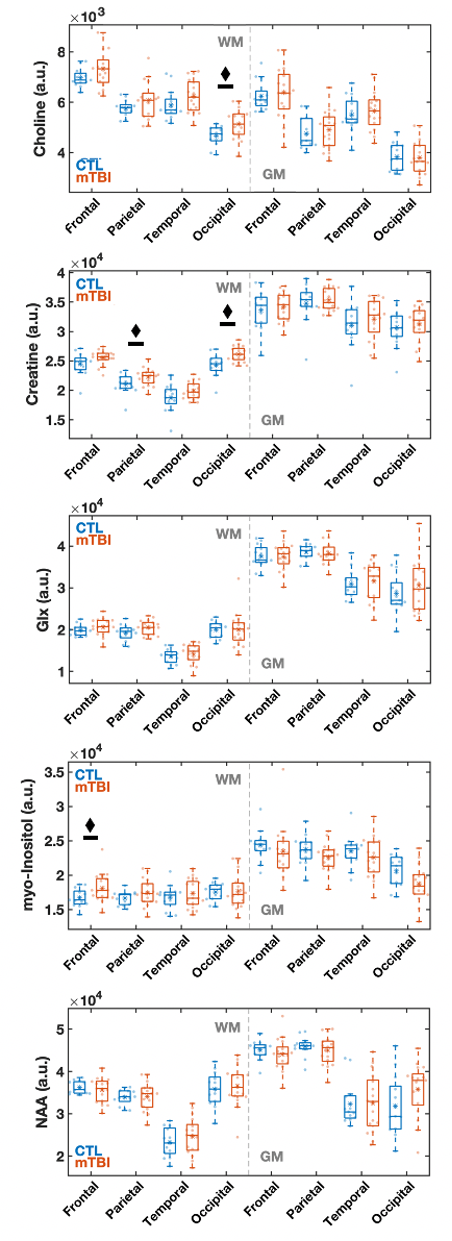
Figure 3: Boxplots of lobar metabolite distributions within mTBI and control (CTL) cohorts. Occipital WM Cho and Cr, parietal WM Cr, and frontal WM mI are higher in mTBI patients compared to controls (MW, ♦: p 0.05). Note that in all lobes WM Cr and Cho medians are higher in mTBI patients compared to controls. Cho: choline, Cr: creatine, mI: myo-inositol, Glx: glutamine plus glutamate; NAA: N-acetyl aspartate; WM: white matter.