2216
1H MRS biomarkers in spinocerebellar ataxia type 1
Kirsten Kapteijns1, Teije van Prooije1, Jack JA van Asten2, Bart van de Warrenburg1, and Tom WJ Scheenen2
1Dept of Neurology, Radboudumc, Nijmegen, Netherlands, 2Dept of Medical Imaging, Radboudumc, Nijmegen, Netherlands
1Dept of Neurology, Radboudumc, Nijmegen, Netherlands, 2Dept of Medical Imaging, Radboudumc, Nijmegen, Netherlands
Synopsis
Reliable biomarkers for SCA1 are necessary to reach trial-readiness. However, with small samples, it is important to interrogate the robustness of earlier biomarker findings. We performed single voxel 1H-MRS on 23 patients and 7 controls in the pons, cerebellar white matter, and vermis. Participants were evaluated on ataxia severity (SARA scale). Differences between groups showed alterations in tNAA, glutamate, and myo-Inositol. Negative correlations of tNAA with SARA could be found in all VOIs, and glutamate showed a negative correlation with SARA in the cerebellar WM. These findings are in line with earlier studies, and support the idea of MRS biomarkers.
Introduction
Spinocerebellar ataxia type 1 (SCA1) is a rare, progressive autosomal dominant disease, primarily affecting the cerebellum and connected regions1. In order to objectively assess the effects of future treatments in clinical trials, reliable surrogate markers are necessary. Moreover, due to the rarity of SCA1 with a 1:100.000 prevalence, it is key that such markers are sensitive to change, as this will allow for smaller sample sizes in treatment trials2. MR spectroscopy of the brain seems promising in providing potential biomarkers. Earlier research has shown alterations in several brain metabolites3,4. We aim to replicate these findings and to interrogate the robustness of the indicated metabolites as biomarkers for SCA1. In this abstract, the first results of a running MRI/MRS study in a group of SCA1 patients are presented and compared to earlier findings.Methods
30 participants underwent 1H-MRS examination at 3 Tesla (Magnetom Prisma-fit, Siemens Healthineers, Erlangen). Of these, 23 were in various stages of SCA1, and 7 were healthy volunteers as the first part of an age-matched control group. The MRS package was developed by Gülin Öz and Dinesh Deelchand and provided by the University of Minnesota under a C2P agreement. A modified semi-adiabatic localization by adiabatic selective refocusing (semi-LASER) sequence (TR/TE = 3000/28 ms, 80 averages) was used to obtain 1H-MRS spectra5,6. On a 3D T1-weighted dataset (MPRAGE, TI 950 ms, 0.9 mm isotropic resolution) with reconstructions in orthogonal orientations 3 voxels were placed manually (fig. 1): in cerebellar vermis (10x25x25 mm3), cerebellar white matter (17x17x17 mm3), and in pons (16x16x16 mm3) with FASTMAP shimming7. The RF pulse power and VAPOR water suppression was calibrated for each voxel separately in order to improve spectral quality. Spectra were fit with in-house automated LCModel scripts, resulting in MRS neurochemical profiles and metabolite levels relative to the total creatine signal, which were used to evaluate the differences between SCA1 patients and healthy controls.Clinical ataxia severity for all participants was evaluated via the ataxia rating scale SARA. This scale consists of eight quantitative exam areas for gait, stance, sitting, speech disturbance, and limb kinetic functions8. The resulting score can range from 0 to 40, with higher scores indicating more severe ataxia. Metabolite integrals relative to the total creatine signal were correlated with the SARA score.
Results
Compared to controls, SCA1 patients have lower tNAA (p < .00), glutamate (p < .05), and myo-Inositol (p < .01) levels in the pons, with tNAA and glutamate being lower, and myo-inositol being higher in patients. tNAA (p < .00) and glutamate (p < .01) levels in the cerebellar white matter of SCA1 patients significantly differed from controls, both showing lower levels in patients. In the vermis, only tNAA had significantly lower levels in SCA1 patients versus controls (p < .00) (fig. 2).We found a significant negative correlation between relative total NAA (tNAA) levels and clinical SARA scores in the pons (p < .05, β = -.66, R2 = .44 ), cerebellar white matter (p < .00, β = -.69, R2 = .47), and vermis (p < .01, β = -.63, R2 = .39). Patients with higher SARA scores thus had relatively lower tNAA levels in all three voxels. Next to this, there was also a significant negative correlation between relative glutamate levels and SARA scores in the cerebellar white matter (p =.001, β = -.65, R2 = .43) (fig. 3).
Discussion
Our results are in line with earlier MRS findings in SCA13,4,9. As tNAA and glutamate are thought to be primarily localized in neurons, the lower levels of these metabolites are in line with the known neuronal and thus axonal loss in SCA1.In addition to the differences in metabolic levels between SCA1 patients and controls, we also found the levels of several metabolites to correlate with disease severity as measured by the SARA score. These metabolites are thus of particular interest to be investigated as markers in future proof-of-concept clinical trials. In order to further establish the role of these metabolites, longitudinal studies will be performed in this group of patients, further exploring the utility of MRS to monitor disease progression on an individual patient level.
We did not find a correlation between myo-Inositol and clinical scores, but this could be due to the use of relative as opposed to absolute levels of metabolites. Segmentation of brain tissue and identification of partial volumes of gray matter, white matter and CSF in each voxel is in progress, as well as absolute quantification with a separately acquired water reference signal.
Conclusion
In the search of biomarkers in SCA1 to facilitate future trials, MRS is a promising contender. Similar patterns of multiple altered metabolites across several SCA1 populations exist, indicating the robustness of these markers. The correlation between relative metabolite levels and the clinical disease severity is promising for monitoring of disease progression with MRS.Acknowledgements
No acknowledgement found.References
- Yamada M, Sato T, Tsuji S, and Takahashi H. CAG repeat disorder models and human neuropathology: similarities and differences. Acta neuropathologica. 2008;115(1): 71-86.
- Underwood BR, and Rubinsztein DC. Spinocerebellar ataxias caused by polyglutamine expansions: a review of therapeutic strategies. The Cerebellum. 2008;7(2): 215-221.
- Öz G, Hutter D, Tkác I, et al. Neurochemical alterations in spinocerebellar ataxia type 1 and their correlations with clinical status. Movement Disorders. 2010;25(9):1253-1261.
- Adanyeguh IM, Henry PG, Nguyen TM, et al. In vivo neurometabolic profiling in patients with spinocerebellar ataxia types 1, 2, 3, and 7. Movement Disorders. 2015;30(5):662-670.
- Öz G, and Tkác I. Short-Echo, Single-Shot, Full-Intensity Proton Magnetic Resonance Spectroscopy for Neurochemical Profiling at 4T: Validation in the Cerebellum and Brainstem. Magnetic resonance in medicine. 2011;65:901-10.
- Deelchand DK, Berrington A, Noeske R, et al. Across‐vendor standardization of semi‐LASER for single‐voxel MRS at 3T. NMR in Biomedicine. 2019;e4218
- Gruetter R, and Tkáč I. Field mapping without reference scan using asymmetric echo‐planar techniques. Magnetic Resonance in Medicine. 2000;43(2):319-323.
- Schmitz‐Hübsch T,du Montcel ST,Baliko L, et al. Scale for the assessment and rating of ataxia: development of a new clinical scale. Neurology 2006;66:1717–1720
- Guerrini L,Lolli F,Ginestroni A, et al. Brainstem neurodegeneration correlates with clinical dysfunction in SCA1 but not in SCA2. A quantitative volumetric, diffusion and proton spectroscopy MR study. Brain 2004;127:1785–1795
Figures
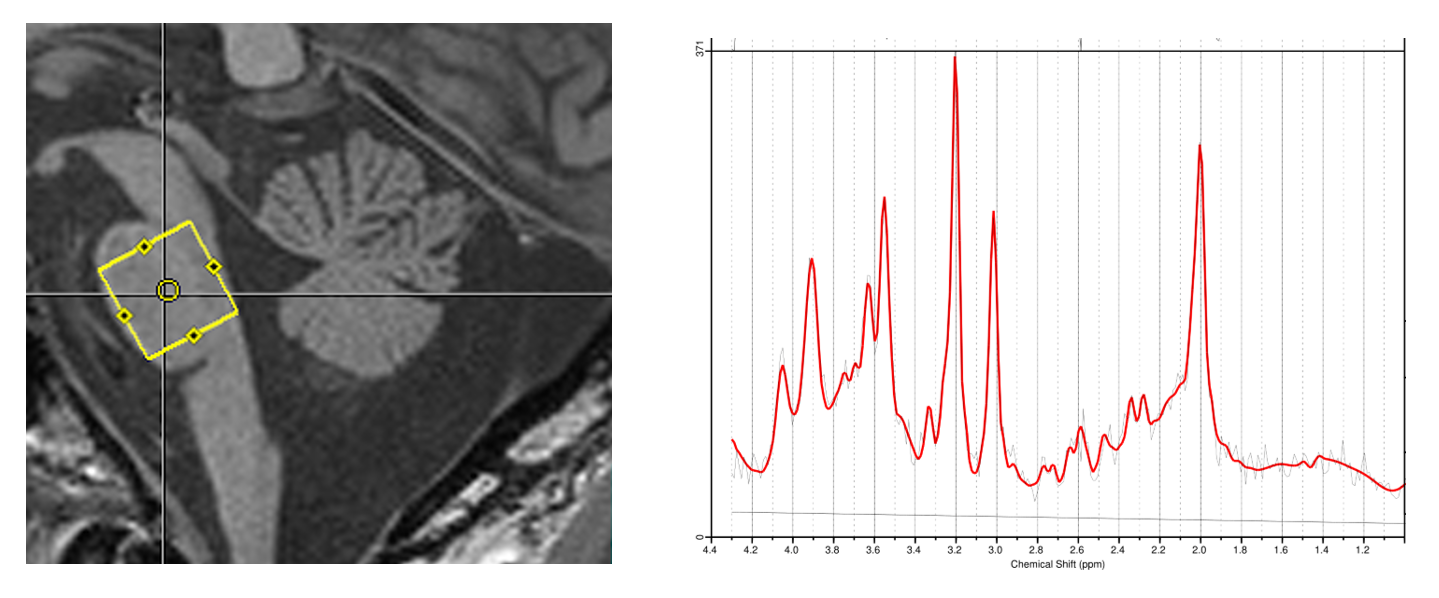
Figure 1 Example of voxel positioning in the pons of a patient with SCA1 and the corresponding spectrum quantified with LCModel.
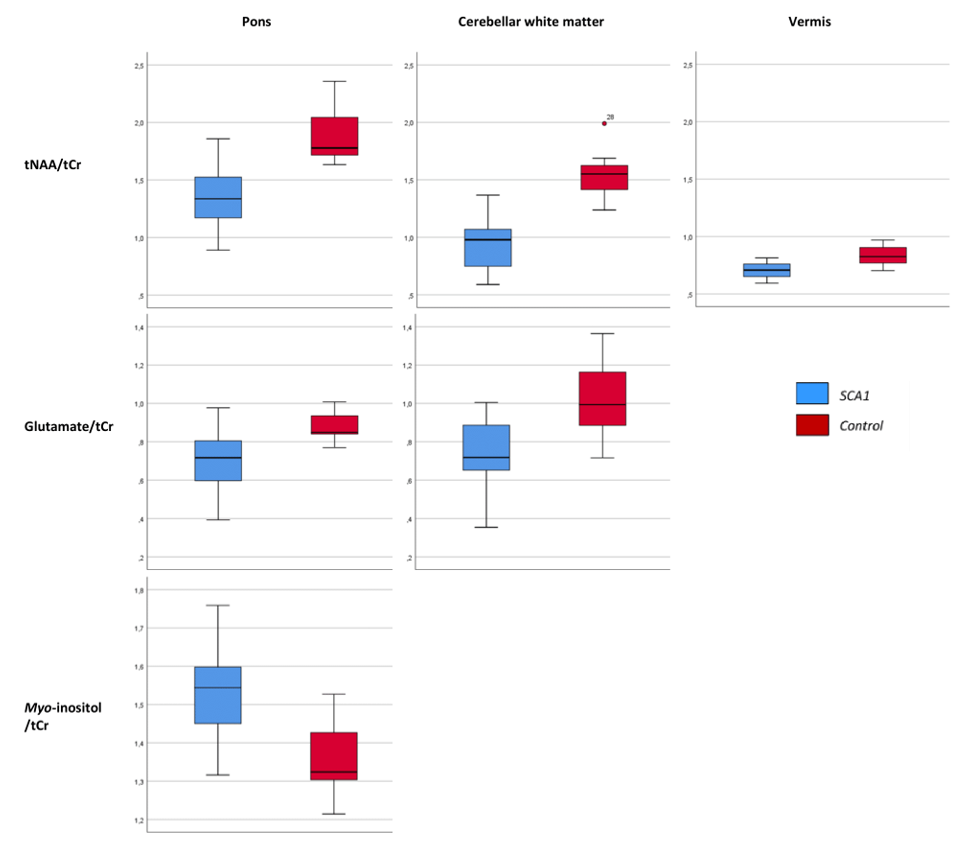
Figure 2 Visualization of the
significant differences in relative metaboliteslevels between patients with SCA1 and controls
in the three VOIs
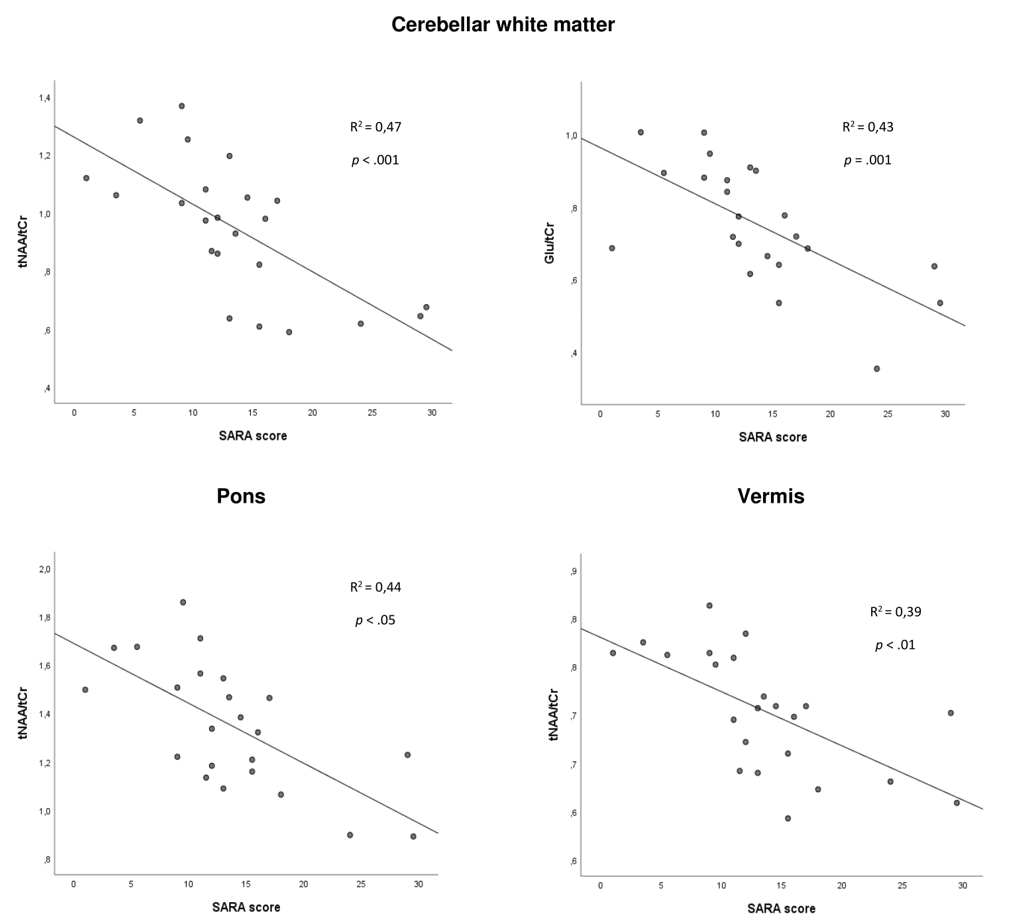
Figure 3 Correlation between relative metabolite levels
in the brain and clinical SARA scores. tNAA is significantly correlated in all
three VOIs, glutamate is correlated with clinical scores in the cerebellar
white matter.