2214
Mapping of differential metabolic regions of RRMS patients in multi-slices dimensional using Spiral-MRSI technique1School of Health Sciences, University of Newcastle, Newcastle, Australia, 2Hunter Medical Research Institute, Newcastle, Australia, 3Department of Neurology, John Hunter Hospital, Newcastle, Australia, 4School of Medicine and Public Health, University of Newcastle, Newcastle, Australia, 5Harvard Medical School, Massachusetts General Hospital, Boston, MA, United States, 6Faculty of Health and Medicine, University of Newcastle, Newcastle, Australia
Synopsis
The study designed a novel multi-dimensional metabolic mapping using multi-slice-spiral-MRSI with multi-voxel segmentation and differential metabolic regions(DMRs) techniques to demonstrate the true nature of NAWM and WM-lesions of RRMS patients,compared to HCs. 3D-spiral-MRSI covering majority of the brain in 16 RRMS and 13 HCs were used. Multi-slice-MRSI was processed using novel pipeline with DMRs classifications. Neurometabolic mapping of multi-DMRs revealed that(NAA/tCr) in WM-lesions was significantly lower than NAWM-MS and HCs,while (m-Ins/tCr) in WM-lesions were significantly higher than NAWM-MS and HCs. Multi-slice-spiral-MRSI coupled with DMRs may enhance a clinical monitoring of RRMS patients, and is sensitive in diagnosing NAWM in RRMS
Background
Multiple Sclerosis (MS) is a chronic neurodegenerative disease that relies heavily on the use of conventional MRI for diagnosis and on-going monitoring1,2. However, reliable markers of disease progression are still needed, since MRI features of MS are nonspecific and insensitive to the pathological substrates contributing to the development of permanent disability. Several reports have shown that using a novel proton multi-voxel MRS imaging (H-MRSI) method3,4, can differentiate these pathological processes and evaluate neurometabolic changes within white matter lesion (WML) and normal-appearing white matter (NAWM)5,6. This method improves the diagnostic specificity and aids clinical management of MS.7 The challenge using MRSI was to perform multi-dimensional metabolic mapping of the brain with high spatial resolution, improved localization and short acquisition times, and to evaluate the true metabolic nature of WML and NAWM in multi-voxels slices by using differential metabolic regions (DMRs) in MS brain. We designed a novel post-processing analysis pipeline for multi-slices, multi-voxel segmentation of large VOI with DMR classification which allows identification of the true metabolic nature of WML and NAWM of RRMS patients, compared to age and sex-matched healthy controls (HCs), and developing a multi-dimensional metabolic mapping presentation of neurometabolic concentrations to differentiate tissue subtypes in RRMS.Materials and Methods
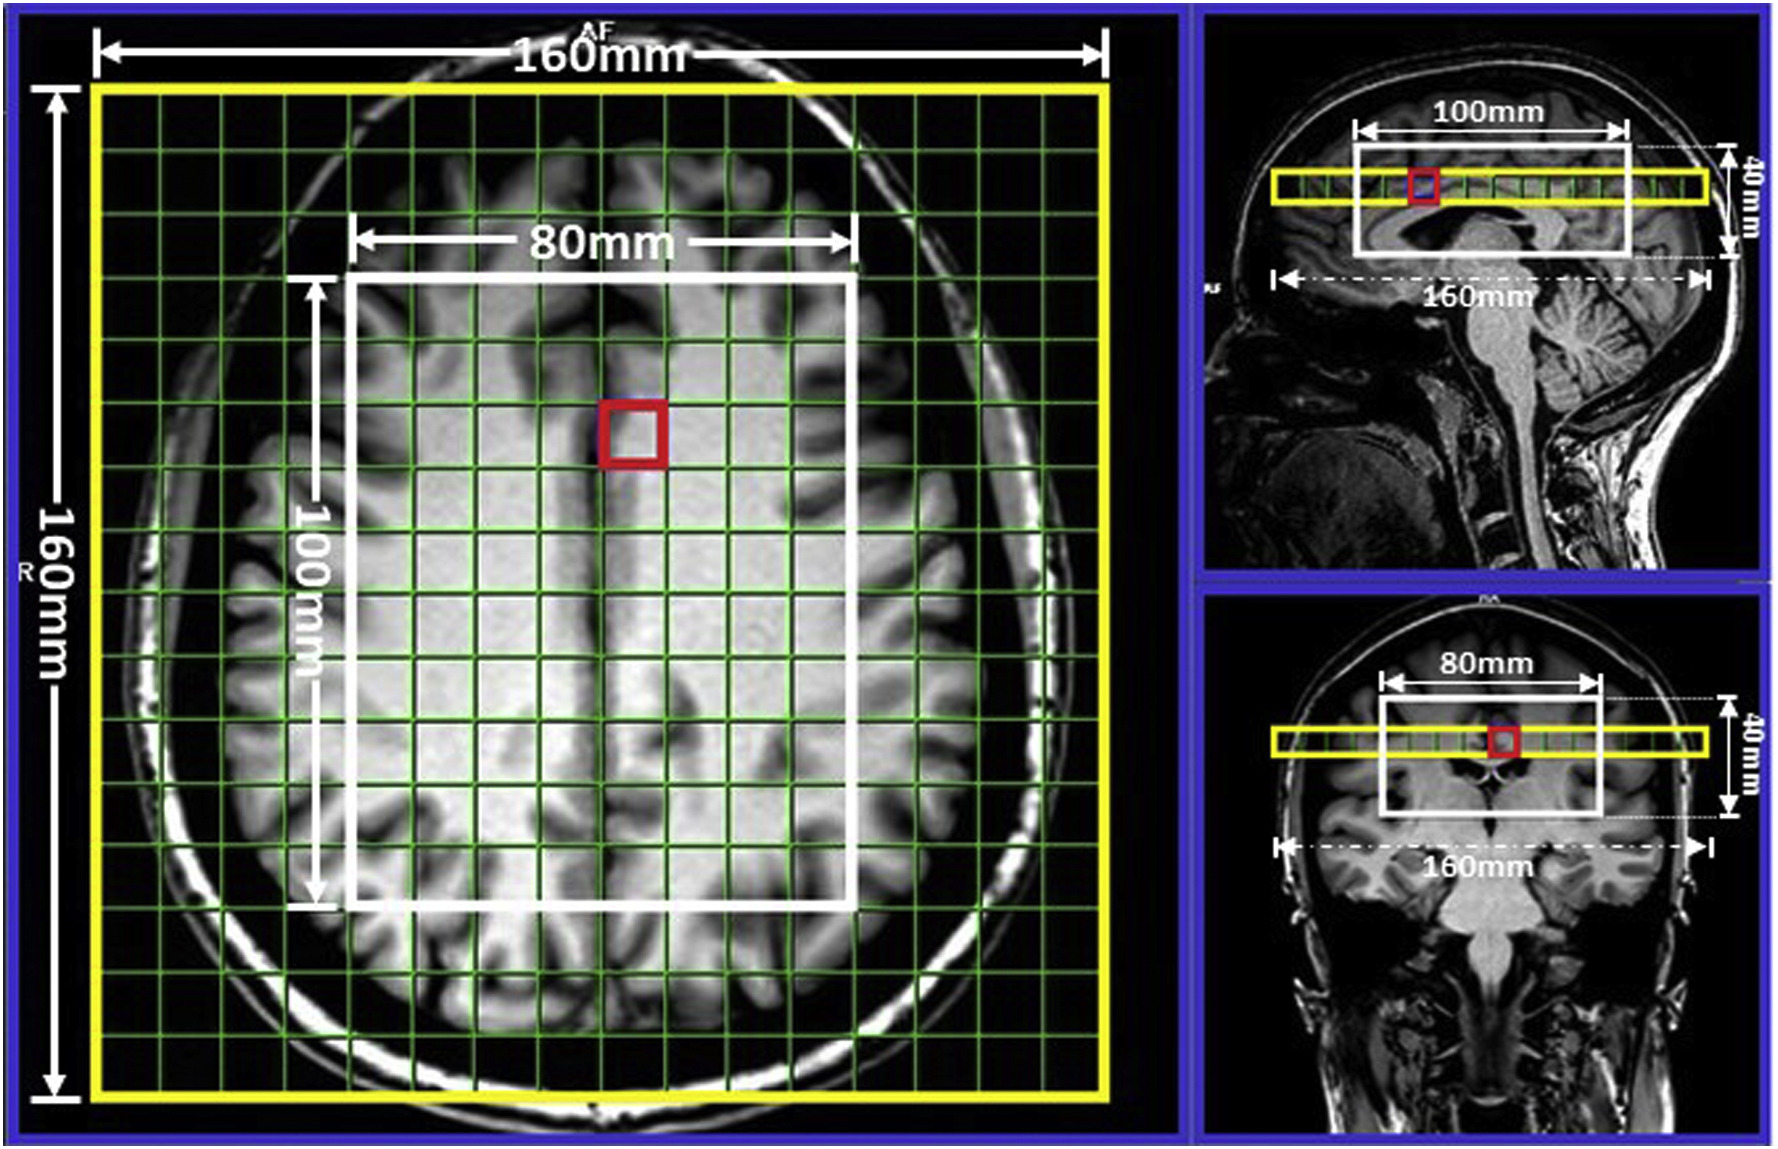
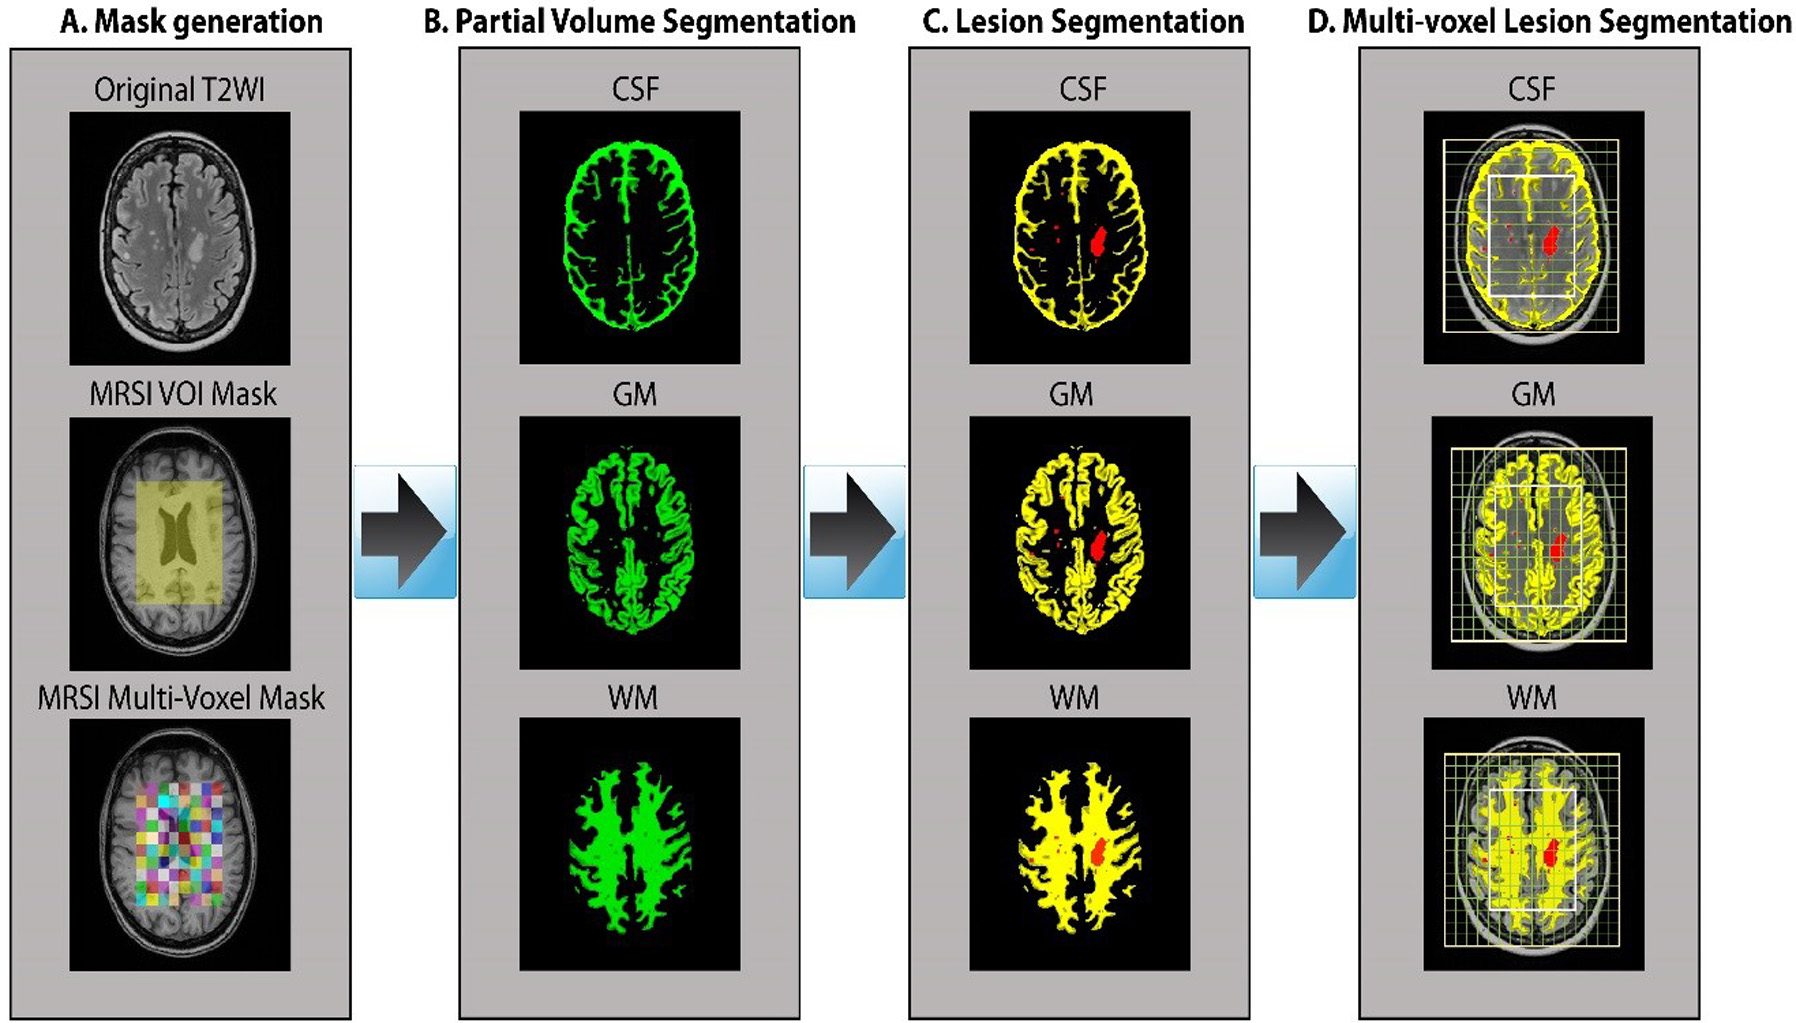
Sixteen MS patients aged between 20 to 55 years, diagnosed with RRMS according to the McDonald criteria were involved in this study. Thirteen HCs were age and sex matched to the RRMS cohort. All MRI/MRS were undertaken on a 3T (Prisma, Siemens) MRI scanner equipped with a 64 channel coil. Structural imaging using 3D T1-MPRAGE (TR/TE/TI=2000/3.5/1100 ms, 7° flip angle, FOV=256x256mm2, voxel size:1mm3) as well as 3D T2-FLAIR (TR/TE/TI=5000/386/1800ms, 12° flip angle, FOV=256x256mm2, voxel size:1mm3) were acquired (Figure 1). 3D-MRSI was applied using LASER sequence with (GOIA-W)[16,4] RF pulses8 with the following acquisition parameters: TR/TE: 2800/30ms, 6 averages, spiral k-space sampling with simultaneously encoding one spectral and two spatial dimensions, isotropic voxel size:1cm3, water suppression: enabled, VOI in (AP-RL-HF): 100x80x40mm3, and FOV: 160x160mm2 with slab thickness of 80mm, spectral width: 1200Hz (9.74ppm). VOI was placed in the supratentorial brain parenchyma and included the frontal, parietal, occipital lobes as well as the superior aspect of temporal lobe, avoiding placement on the dura. A novel post-processing analysis pipeline was built for multi-voxel segmentation for each voxel along the four slices within VOI, using custom made matlab code and FSL into CSF, GM, WM and T2 lesion load (Figure 2). Lesions within the MRS voxels were segmented using SPM lesion growth algorithm (LGA) as described elsewhere.9 A DMR was defined as a cluster of 3 or more adjacent voxels all having statistically significant metabolic differences between RRMS (WML and NAWM) and HCs (p<0.05). 3D MRSI voxels were analysed using LCmodel with a basis set matching the magnetic field and pulse sequence parameters. Comparisons of mean metabolite ratios between groups for each voxel were undertaken using independent and paired-samples T-tests, using SSPS software.Results
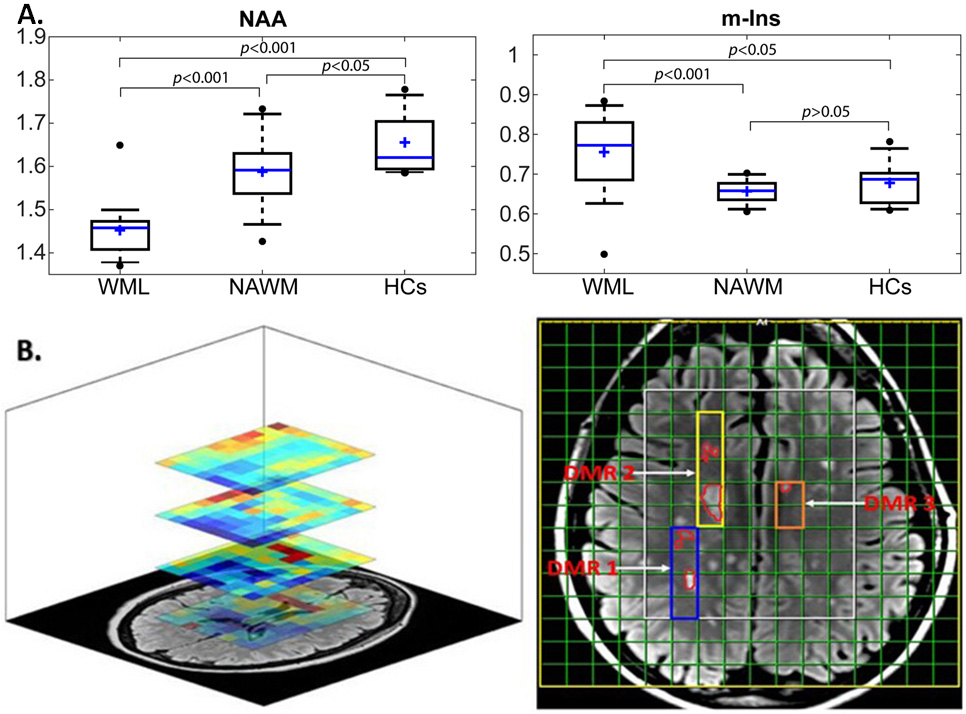
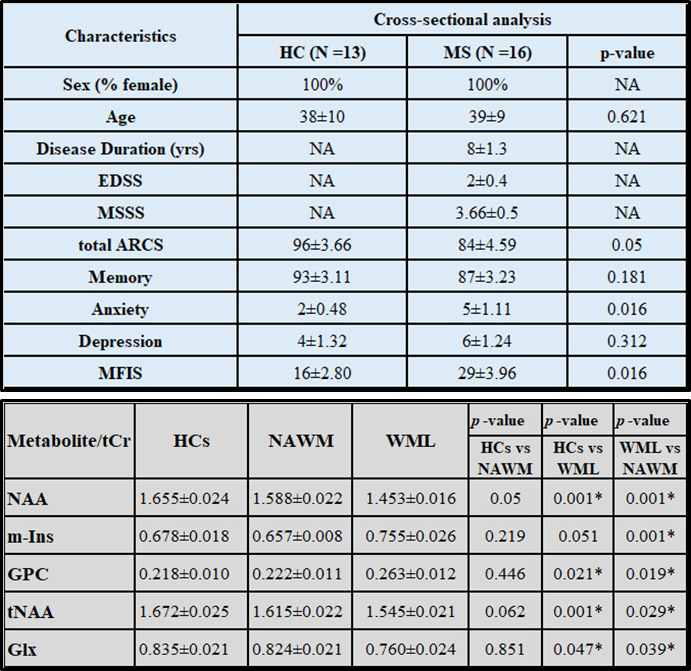
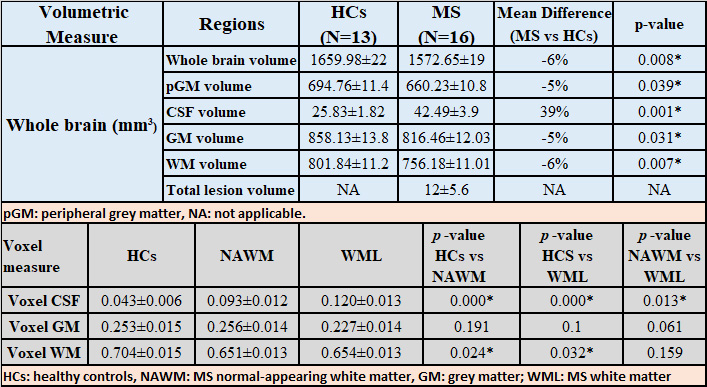
Demographic and clinical parameters of study cohorts are shown in Table 1-Top.MRSI data in its entirety within the VOI (four 10mm slices) showed that N-acetylaspartate/total creatine (NAA/tCr) in voxels with WML were significantly lower than NAWM-MS (-8%) and HCs (-15) within deep cortical white matter in both posterior parietal lobes, while myo-inositol (m-Ins/tCr) in voxels with WML were significantly higher than NAWM-MS (12%) and HCs (10%)(Figure 3A). Results revealed 3 separate DMRs exhibiting a reduction in NAA/tCr (9-23%). Of these, one DMR, located within deep cortical white matter in posterior parietal lobes at post-central gyrus, also displayed an increase in glutamine+glutamate (Glx/tCr) and glycerophosphorylcholine (GPC/tCr) (5‑29%) (Table 1-Bottom) Figure 3B. Volumetric segmentation data demonstrated a significant reduction in the mean normalised whole brain volume (WBV, -6%, p=0.008), WM (-6%, p=0.007) and GM (-5%, p=0.031) volumes and a reciprocal 39% increase in CSF in RRMS compared to HCs. Average RRMS has total lesion volume of 12mL per patient (Table 2-Top). Segmentation of MRSI voxels into different tissue types including WML and NAWM compared to HCs is shown in Table 2-Bottom.Discussion
We found a significant reduction in NAA and an increase in m-Ins in voxels with WML10 in comparison to NAWM-MS11 and to age and sex-matched HCs, within VOI of DMRs. Our findings confirmed the importance of NAA and m-Ins as indicators of axonal loss and gliosis in NAWM and WML using a spiral MRSI at short TE 12. This performance corresponded to a significant decrease in NAA/tCr and increased m-Ins/tCr with a higher percentage change between WML and HCs voxels within VOI13. Elevated GPC is often associated with abnormal membrane turnover and myelin breakdown, while elevated Glx has been associated with oligodendrocyte destruction; suggesting a connection to MS progression14,15 . Our novel analysis pipeline allowed individual small voxel analysis which demonstrated the true nature of NAWM and WML and distinguished tissue types in multi-DMRs of MS brain.Conclusion
Spiral-MRSI may enhance detection of potential NAWM and WML damage which plays a critical role in MS pathology, and was confirmed by voxel segmentation within a larger VOI (320cm3) in multi-DMRs of MS brain. Longitudinal studies are warranted to evaluate the effectiveness of fast MRSI in studying MS progression.16Acknowledgements
This research was supported by the Imaging Centre of the University of Newcastle and Hunter Medical Research Institute.References
1.Rovira A, Auger C, Alonso J. Magnetic resonance monitoring of lesion evolution in multiple sclerosis. Therapeutic advances in neurological disorders 2013;6(5):298-310.
2.Sajja BR, Wolinsky JS, Narayana PA. Proton magnetic resonance spectroscopy in multiple sclerosis. Neuroimaging clinics of North America 2009;19(1):45-58.
3.Kapeller P, McLean MA, Griffin CM, et al. Preliminary evidence for neuronal damage in cortical grey matter and normal appearing white matter in short duration relapsing-remitting multiple sclerosis: a quantitative MR spectroscopic imaging study. Journal of neurology 2001;248(2):131-138.
4.Obert D, Helms G, Sattler MB, et al. Brain Metabolite Changes in Patients with Relapsing-Remitting and Secondary Progressive Multiple Sclerosis: A Two-Year Follow-Up Study. PloS one 2016;11(9):e0162583.
5.Brief EE, Vavasour IM, Laule C, Li DK, Mackay AL. Proton MRS of large multiple sclerosis lesions reveals subtle changes in metabolite T(1) and area. NMR in biomedicine 2010;23(9):1033-1037. 6.Al-Iedani O, Ribbons K, Gholizadeh N, et al. Spiral MRSI and tissue segmentation of normal-appearing white matter and white matter lesions in relapsing remitting multiple sclerosis patients. Magnetic resonance imaging 2020.
7.De Stefano N, Bartolozzi ML, Guidi L, Stromillo ML, Federico A. Magnetic resonance spectroscopy as a measure of brain damage in multiple sclerosis. Journal of the neurological sciences 2005;233(1-2):203-208.
8.Andronesi OC, Gagoski BA, Sorensen AG. Neurologic 3D MR spectroscopic imaging with low-power adiabatic pulses and fast spiral acquisition. Radiology 2012;262(2):647-661.
9.Quadrelli S, Mountford C, Ramadan S. Hitchhiker's Guide to Voxel Segmentation for Partial Volume Correction of In Vivo Magnetic Resonance Spectroscopy. Magn Reson Insights 2016;9:1-8. 10. 10.Marshall I, Thrippleton MJ, Bastin ME, et al. Characterisation of tissue-type metabolic content in secondary progressive multiple sclerosis: a magnetic resonance spectroscopic imaging study. Journal of neurology 2018;265(8):1795-1802.
11.Aboul-Enein F, Krssak M, Hoftberger R, Prayer D, Kristoferitsch W. Reduced NAA-levels in the NAWM of patients with MS is a feature of progression. A study with quantitative magnetic resonance spectroscopy at 3 Tesla. PloS one 2010;5(7):e11625.
12.Rahimian N, Saligheh Rad H, Firouznia K, et al. Magnetic resonance spectroscopic findings of chronic lesions in two subtypes of multiple sclerosis: primary progressive versus relapsing remitting. Iranian journal of radiology : a quarterly journal published by the Iranian Radiological Society 2013;10(3):128-132.
13.Donadieu M, Le Fur Y, Lecocq A, et al. Metabolic voxel-based analysis of the complete human brain using fast 3D-MRSI: Proof of concept in multiple sclerosis. Journal of magnetic resonance imaging : JMRI 2016;44(2):411-419.
14.Tisell A, Leinhard OD, Warntjes JBM, et al. Increased Concentrations of Glutamate and Glutamine in Normal-Appearing White Matter of Patients with Multiple Sclerosis and Normal MR Imaging Brain Scans. PloS one 2013;8(4).
15.De Stefano N, Filippi M. MR spectroscopy in multiple sclerosis. Journal of neuroimaging : official journal of the American Society of Neuroimaging 2007;17 Suppl 1:31S-35S.
16.Rovira À, Alonso J. 1H Magnetic Resonance Spectroscopy in Multiple Sclerosis and Related Disorders. Neuroimaging Clinics 2013;23(3):459-474.
Figures