2210
Repeatability assessment of GABA and GSH concentrations with HERMES: a comparison between traditional analysis and a novel approach1Neuroimaging, King's College London, London, United Kingdom, 2Russell H. Morgan Department of Radiology and Radiological Science, The Johns Hopkins University School of Medicine, Baltimore, MD, United States, 3F. M. Kirby Research Center for Functional Brain Imaging, Kennedy Krieger Institute, Baltimore, MD, United States
Synopsis
Precise and accurate quantitation of GABA and GSH on 3T MR platforms is a great challenge in MR Spectroscopy. Despite this aspect, the reproducibility and repeatability of GABA and GSH measurements have been given little attention. In this study, test-retest repeatability was assessed for HERMES GABA and GSH estimates determined in LCModel using conventional single-spectrum analysis of Hadamard-reconstructed spectra (GABA difference, GSH difference and sum) and a novel analysis approach that models the Hadamard-reconstructed spectra simultaneously, hence using all spectral information acquired. The concatenated method allows simultaneous quantitation of GABA and GSH and provides comparable repeatability to traditional single-spectrum analysis.
Introduction
Overcoming the overlap problem of low-concentration neurochemicals GABA and GSH requires not only implementation of advanced acquisition pulse sequences (MEGA-PRESS1, HERMES2, HERCULES3), but also the use of complex operations during the pre-processing (FID-A4, Gannet5) and sophisticated modelling (LCModel6, Osprey7).Spectral editing removes signals (e.g. from creatine) through subtraction, aiding the resolution of particular signals from GABA and GSH, but this comes at the cost of sacrificing valuable information from the individual sub-experiments. Simultaneous modelling of not only the difference spectra, but also the sum spectrum, is a potential approach to take advantage of J-difference editing while still using all spectral information achieved during acquisition. This approach should improve modelling robustness, since the model needs to be self-constraining, i.e. more consistent with all available data from the acquisition.
Here, we explored whether simultaneous modelling of HERMES GABA and GSH difference and sum spectra in LCModel yielded improved test-retest results (coefficients of variation, CoV, and Bland Altman plots) compared to traditional independent single-spectrum modelling of the individual difference and sum spectra.
Methods
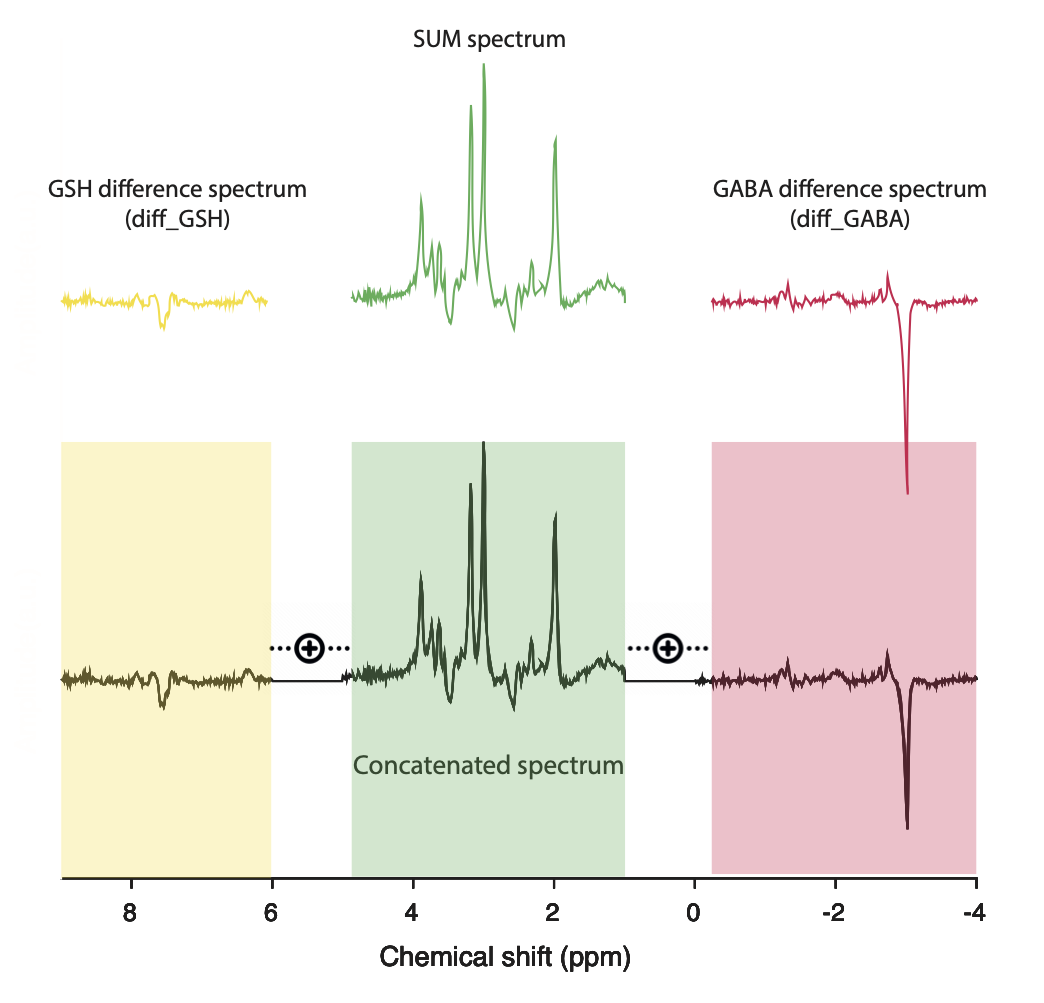
Data acquisition was performed on a 3T MR750 General Electric scanner (Chicago, IL, USA), using the body coil for transmission and a 32-channel head coil for receive. Twenty-one healthy participants (mean age=32.2±7.8 years) were recruited. Informed consent and ethical approval were obtained for all volunteers. The scanning protocol included a calibration scan, a T1 high-resolution structural scan and two HERMES acquisitions 30 minutes apart (test and retest). The HERMES parameters included: TR = 2s; TE = 80ms; 5kHz receiver bandwidth; 4096 data points; 320 averages; phase cycle length of two; 90° excitation pulses; 137° refocusing pulses and 20 ms sinc-Gaussian editing pulses at 1.9 ppm and 4.56 ppm; CHESS water suppression. The spectroscopy voxel of 2.5×4.0×3.0 cm3(RL×AP×SI) was placed in the dorso-medial prefrontal cortex.Data were pre-processed in FID-A; receiver-coil combination, removal of motion corrupted averages, and frequency and phase correction with spectral registration8 were applied. Before saving the processed data to LCModel RAW format the four HERMES sub-spectra, A (GABAandGSH_ON), B (GABAandGSH_OFF), C (GSH_ON) and D (GABA_ON) underwent: a) Hadamard transformation to obtain the sum and difference spectra (SUM=A+B+C+D, diff_GABA=A–B–C+D and diff_GSH=A–B+C-D); b) concatenation of the three reconstructed spectra (SUM, diff_GABA and diff_GSH) into a single spectrum, with 1.2 ppm gap separation – to obtain the concatenated spectrum (Figure 1). LCModel basis sets were created to model all four result spectra. Full-density matrix simulations for 19 spin systems were performed in FID-A for 2013 spatial positions using shaped RF pulse waveforms and the experimental HERMES sequence timings.
LCModel test-retest analysis was implemented and phase corrections and soft constraints on GABA estimates were disabled for all analyses. All metabolite levels were estimated relative to total creatine (tCr=Cr+PCr). Estimates for the diff_GABA and diff_GSH were referenced to tCr from the SUM (since the creatine signal is subtracted out in both difference spectra).
Cramer-Rao lower bounds were used to assess fit quality. CoVs were calculated across all subjects for GABA/tCr and GSH/tCr from all fitting approaches. Repeatability of the experiments was evaluated using test-retest CoVs and Bland-Altman plots.
Results
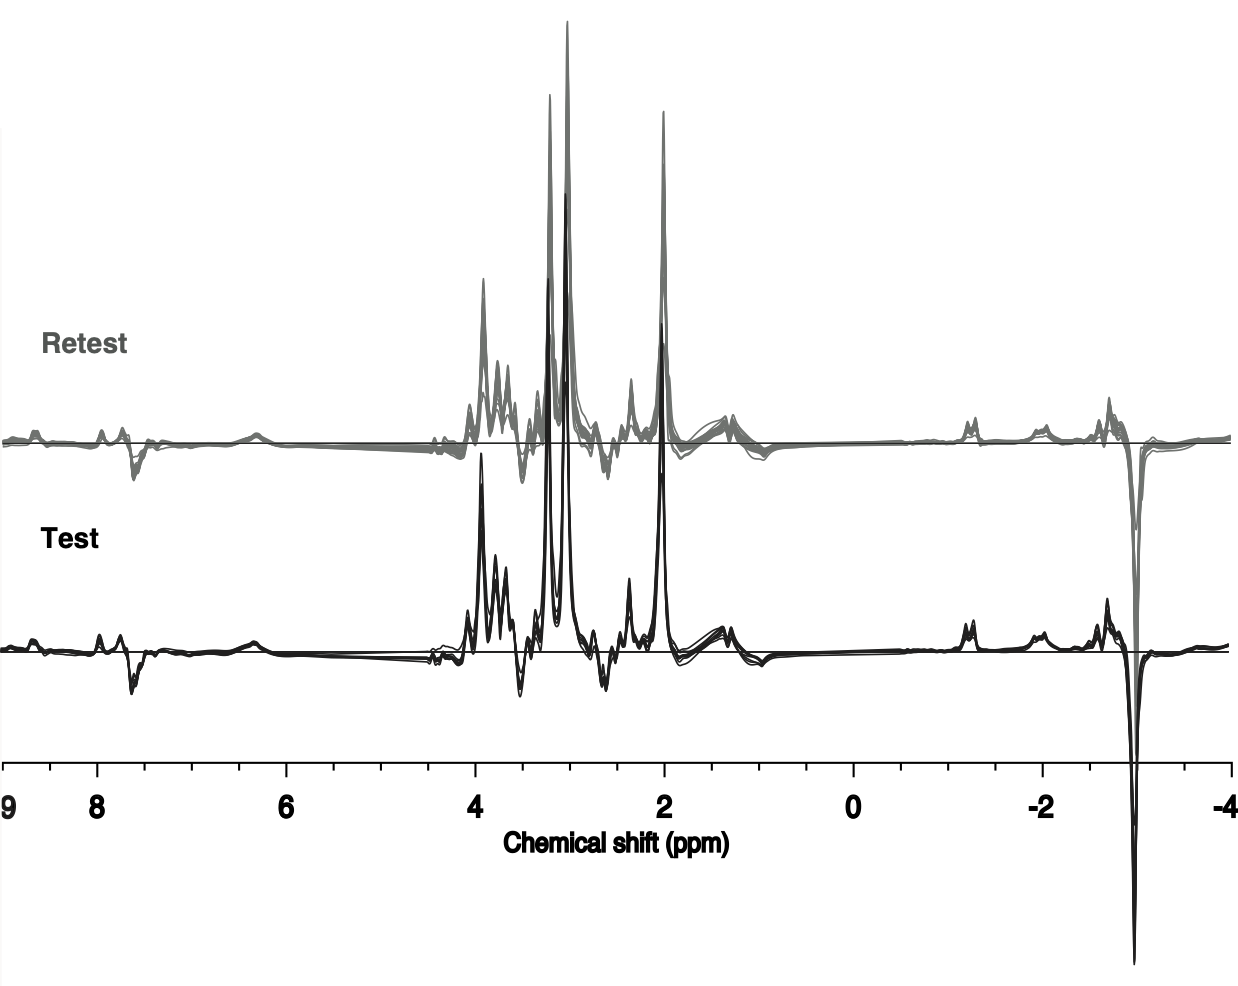
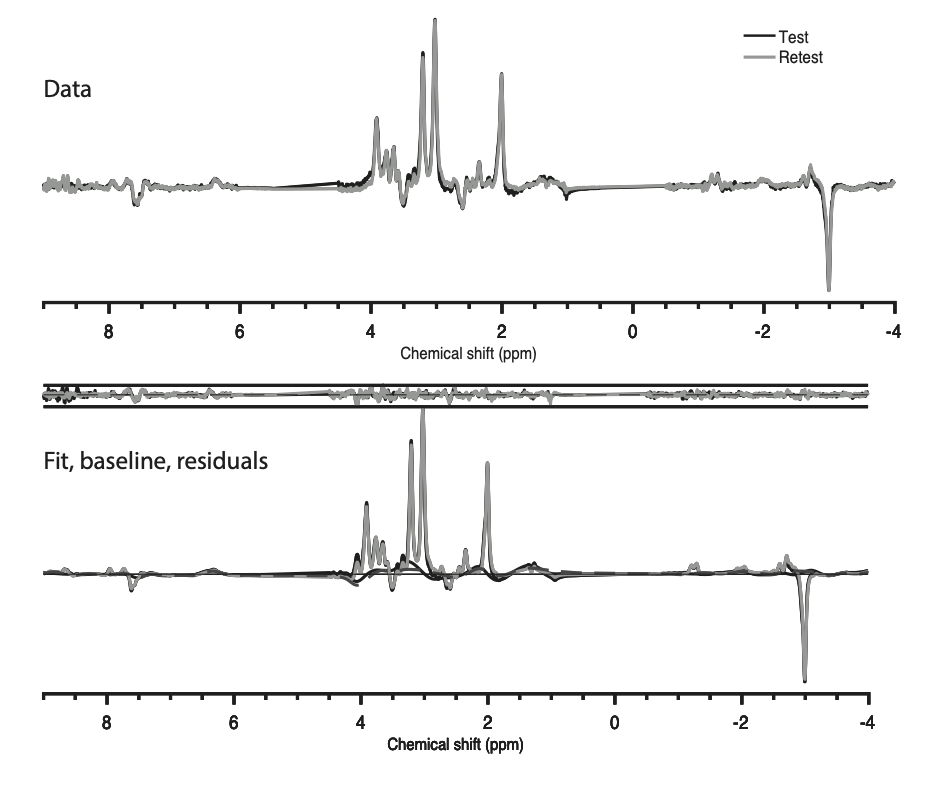
All concatenated spectra are shown overlaid for test and retest acquisitions in Figure 2.Mean test (black) and retest (grey) concatenated data are displayed in Figure 3, top, while the mean test (black) and retest (grey) concatenated LCModel fits, baselines and residuals and are shown at the bottom.
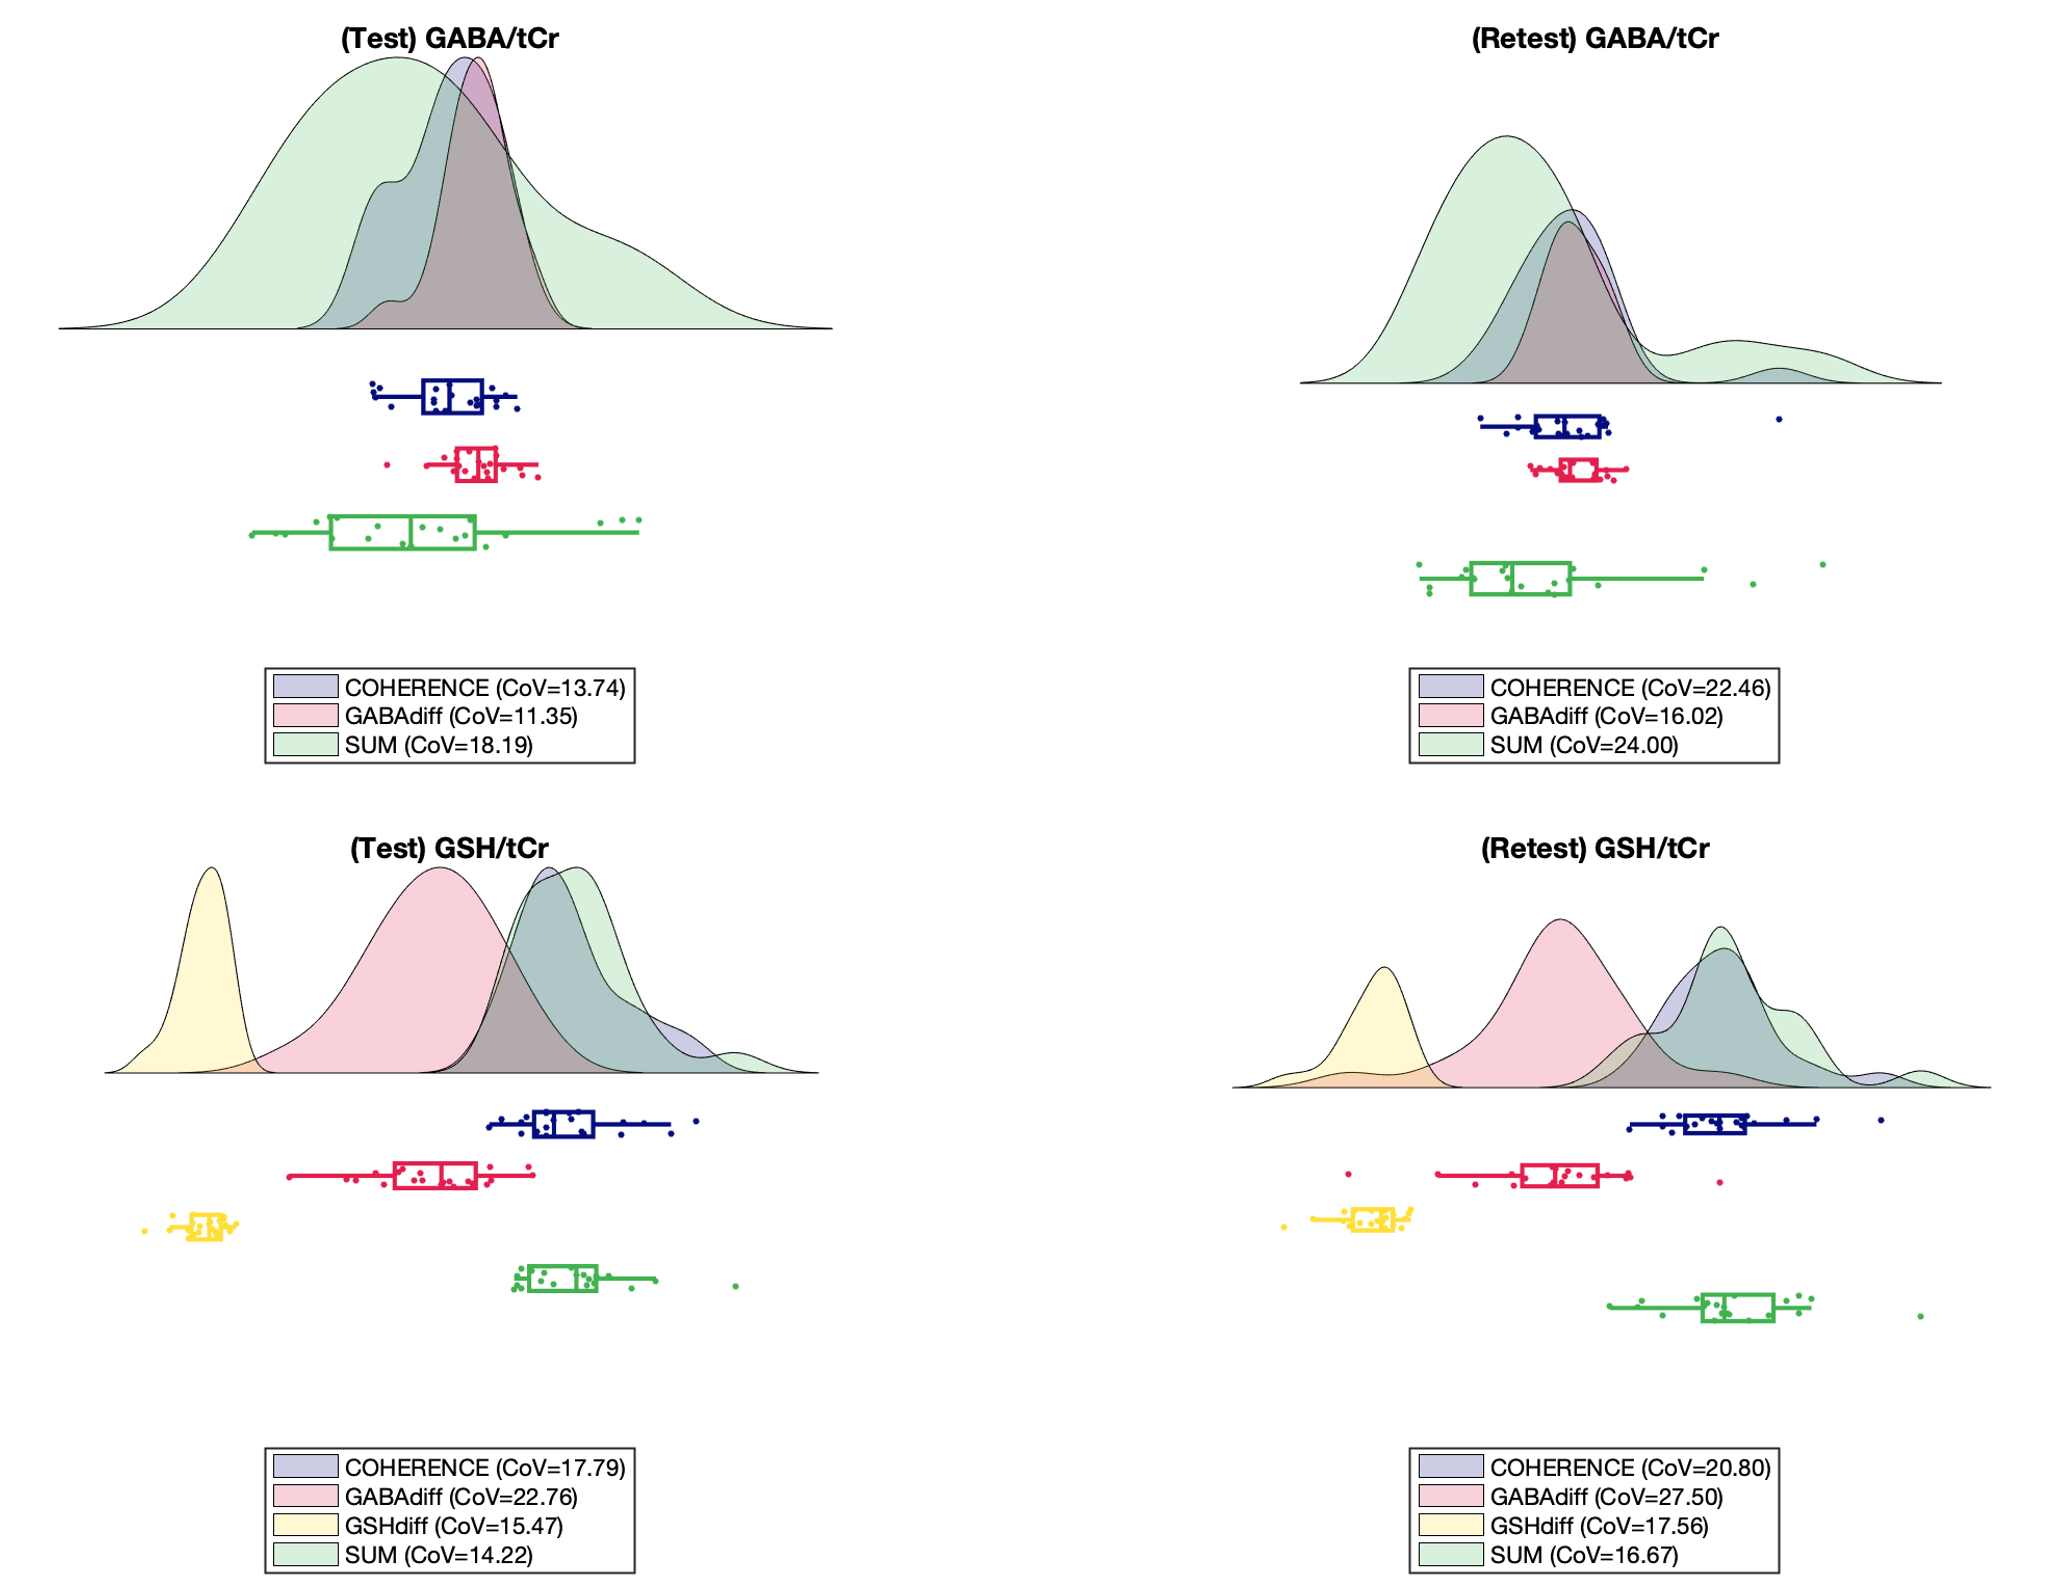
GABA/tCr and GSH/tCr concentrations CoVs, for test and retest are presented in Figure 4 along with the concentrations distributions of all modelling methods.
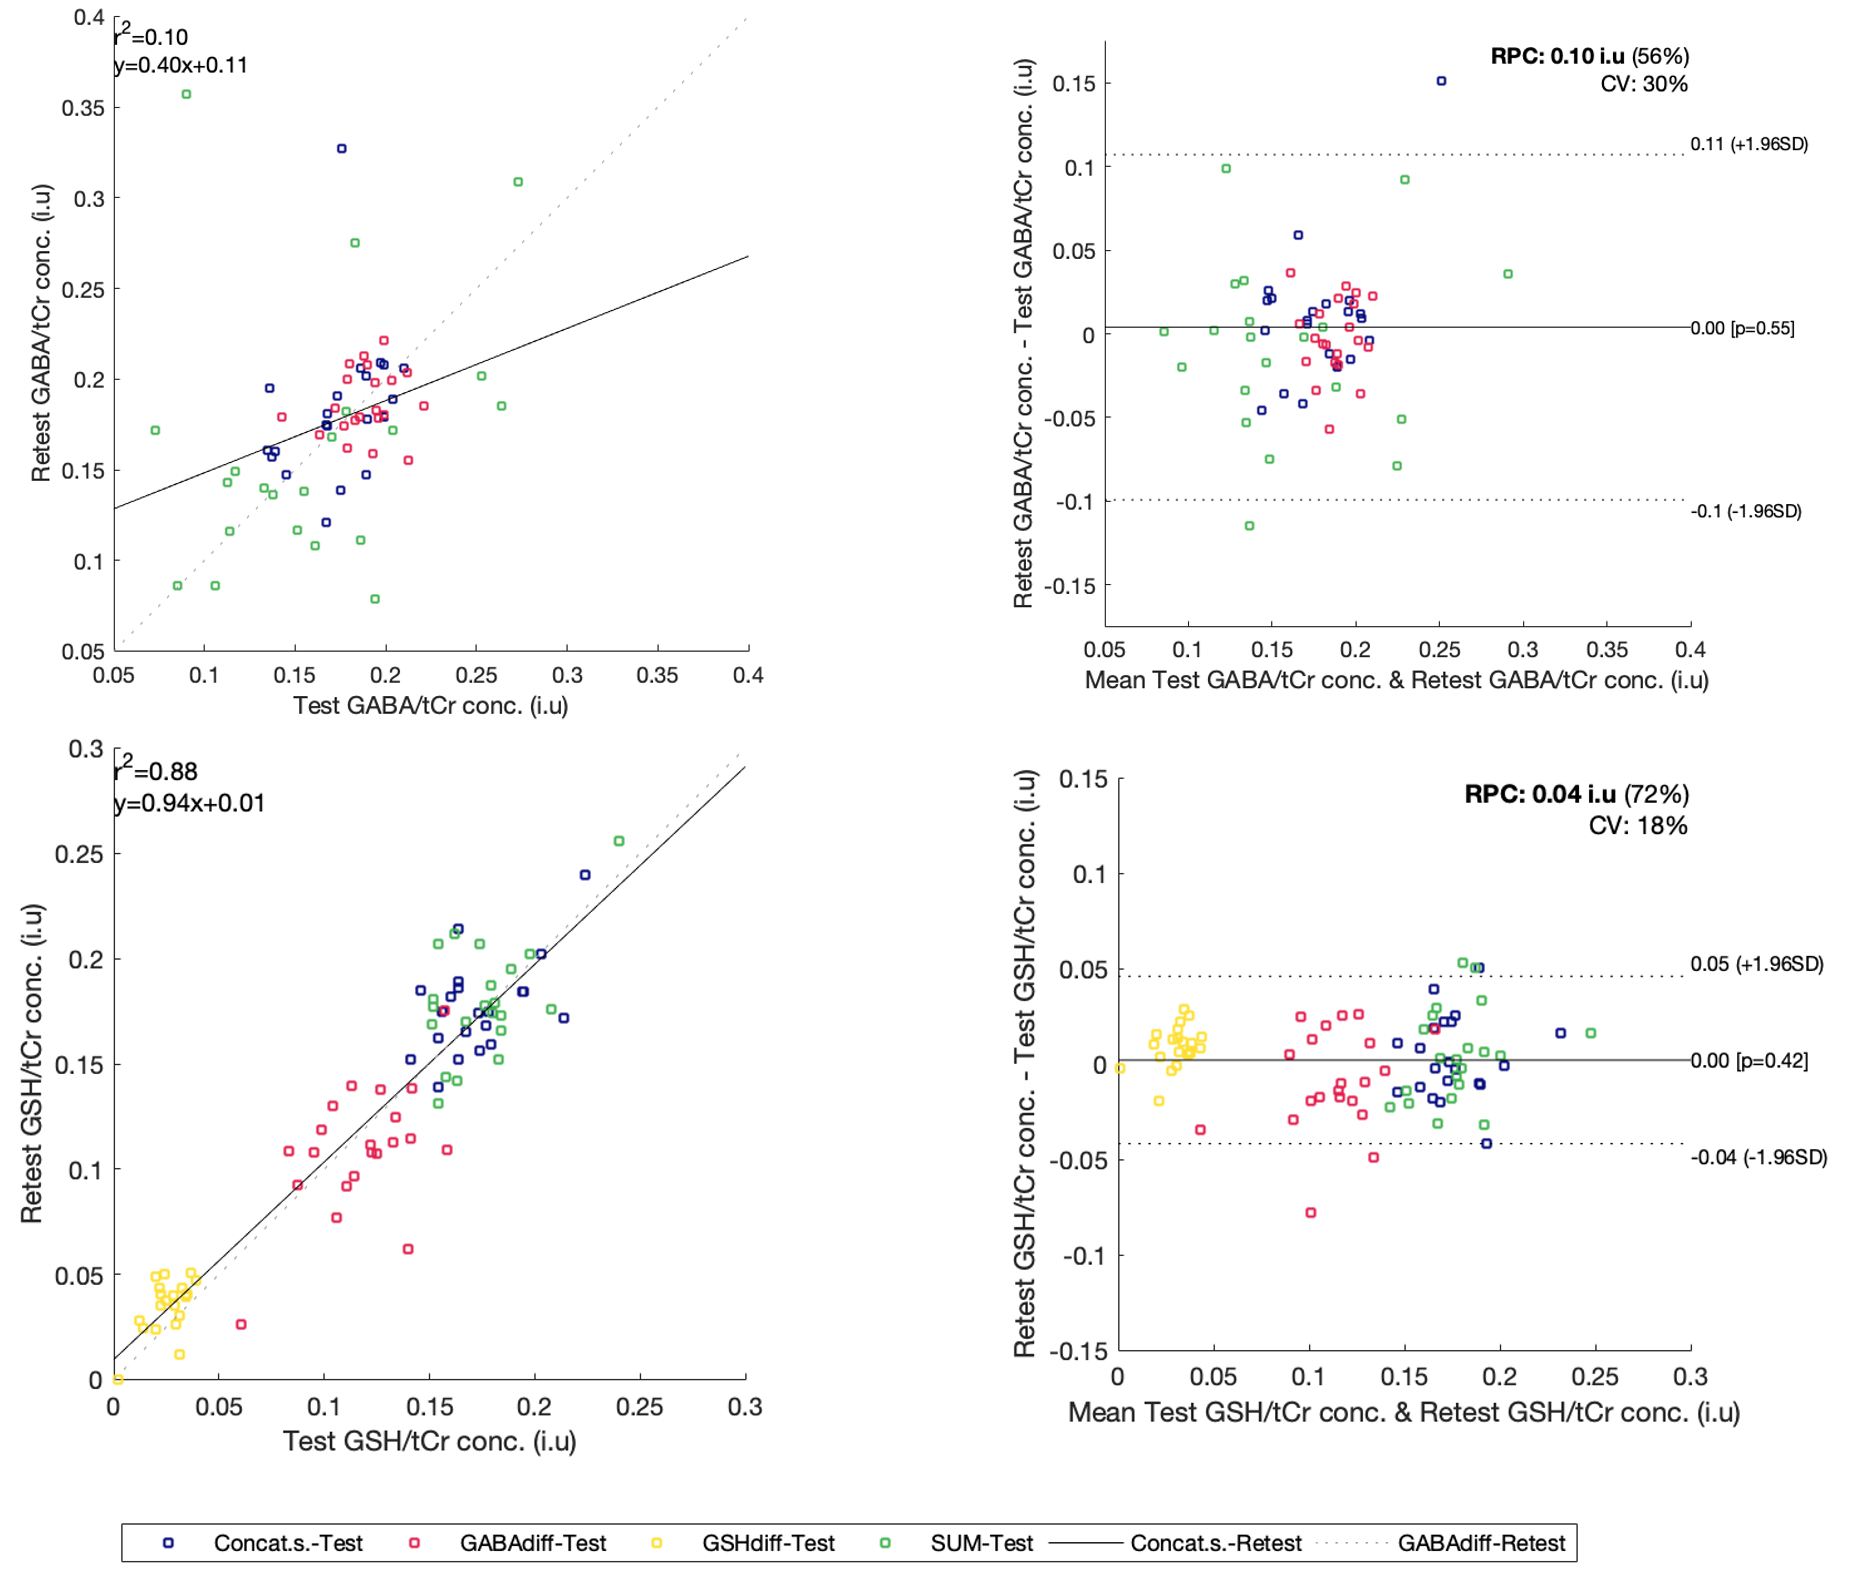
Figure 5 illustrates the Bland-Altman plots for the metabolite pair test-retest tCr referenced concentrations.
Discussion
GABA/tCr and GSH/tCr levels estimated with the concatenated approach agree with literature reported values; the best agreement was obtained for GABA/tCr, but GSH/tCr estimate could potentially be improved by adjusting hidden LCModel parameters.Test-retest CoVs for GABA/tCr estimates determined with the concatenated approach vary more than those of diff_GABA, but less than those of the SUM. This outcome was expected given the high quality of the HERMES GABA editing. Furthermore, the SUM segment within the concatenated spectrum (middle segment) has the highest signal amplitude, causing the least-squares error estimation to be more sensitive to minimizing the difference between data and model in the SUM than in the difference spectra. On the other hand, the test-retest CoVs of the concatenated method estimates for GSH vary to the same extent as those of diff_GSH. Overall, the distributions of concentrations for the concatenated method were more compact than the SUM related one.
Test-retest correlation and Bland-Altman plots show a good agreement between the two acquisitions for the metabolite pair, GSH/tCr levels showing the best correlation.
In summary, the concatenated method yields comparable quantitative results to those produced by the difference spectra, but faster and in a more self-constrained fashion.
Future investigations will study the reproducibility of our data and will extend the test-retest experiment to include HERCULES data too.
Conclusions
A novel analysis approach was successfully implemented for simultaneous modelling of GABA and GSH HERMES data. Repeatability of the concatenated modelling was comparable to traditional single-spectrum modelling.Acknowledgements
No acknowledgement found.References
1. Mescher M, & Garwood M, NMR Biomed, 1998,11, 266–272.
2. Chan K. et al, Magn Reson Med, 2016, 76, 11–19.
3. OeltzschnerG, Neuroimage, 2018, 185, 181–190.
4. Simpson R et al, Magn Reson Med, 2017, 77, 23–33.
5. Evans, C.J. & Edden, J Magn Reson Imag, 2014, 40, 1445–1452.
6. Provencher S, Magn Reson Med, 1993, 30, 672–679.
7. Oeltzschner G, J. Neurosci. Methods, 2020, 343, 108827
8. Near J, Magn Reson med, 2014, 73, 44-50
Figures