2209
13C-Glucose Labeling Effects measured in the Occipital Lobe and the Frontal Cortex using short TE 1H MC-semiLASER SVS at 9.4T1MRZ, MPI for Biological Cybernetics, Tuebingen, Germany, 2IMPRS for Cognitive and Systems Neuroscience, Tuebingen, Germany, 3Advanced Imaging Research Center, University of Texas Southwestern Medical Center, Dallas, TX, United States
Synopsis
Glutamate related metabolism can be measured considering the 13C labeling effects from an administered 13C labeled substrate by short TE 1H MRS spectra without the need for 13C channels, RF coils or scan software as required for direct 13C MRS or 13C edited 1H observed MRS. In this work, the labeling effects were followed in the frontal cortex and the occipital lobe using a short TE 1H MC-semiLASER sequence at 9.4T in healthy volunteers after oral intake of [13C-1]glucose. The spectral time series acquired show obvious 13C labelling related changes in the 1H observed Glu and Gln spectral pattern.
Introduction
Altered glutamate levels have been found in patients suffering from Major Depression Disorder1–3. For a better insight into its etiology, related metabolic rates can be investigated. Usually, those rates were measured using direct or indirect 13C MRS4–7 after the administration of 13C labelled substrate, e.g. Glucose (Glc). Boumezbeur et al. showed the feasibility of using conventional 1H MRS in monkeys8, which avoids technical challenges of multinuclear radiofrequency coils, heteronuclear decoupling, and broadband amplifiers. An et al.9,10 and Dehghani et al.11 applied Boumezbeur’s technique in humans using long TE scan protocols at 7T and 3T, respectively. Both studies administrated the labelled Glc by infusion. In this study, we follow the incorporation of the 13C nuclei into different metabolites by short TE 1H MRS at 9.4T in the human brain after an oral administration of [13C-1]Glc. The oral intake simplifies the procedure and makes it less strenuous for the volunteers. Furthermore, short TE MRS at 9.4T benefits from better spectral resolution and retains signal from fast relaxing metabolites, which potentially enables to detect more metabolites and thus allows extracting more information about metabolic turnover rates.Methods
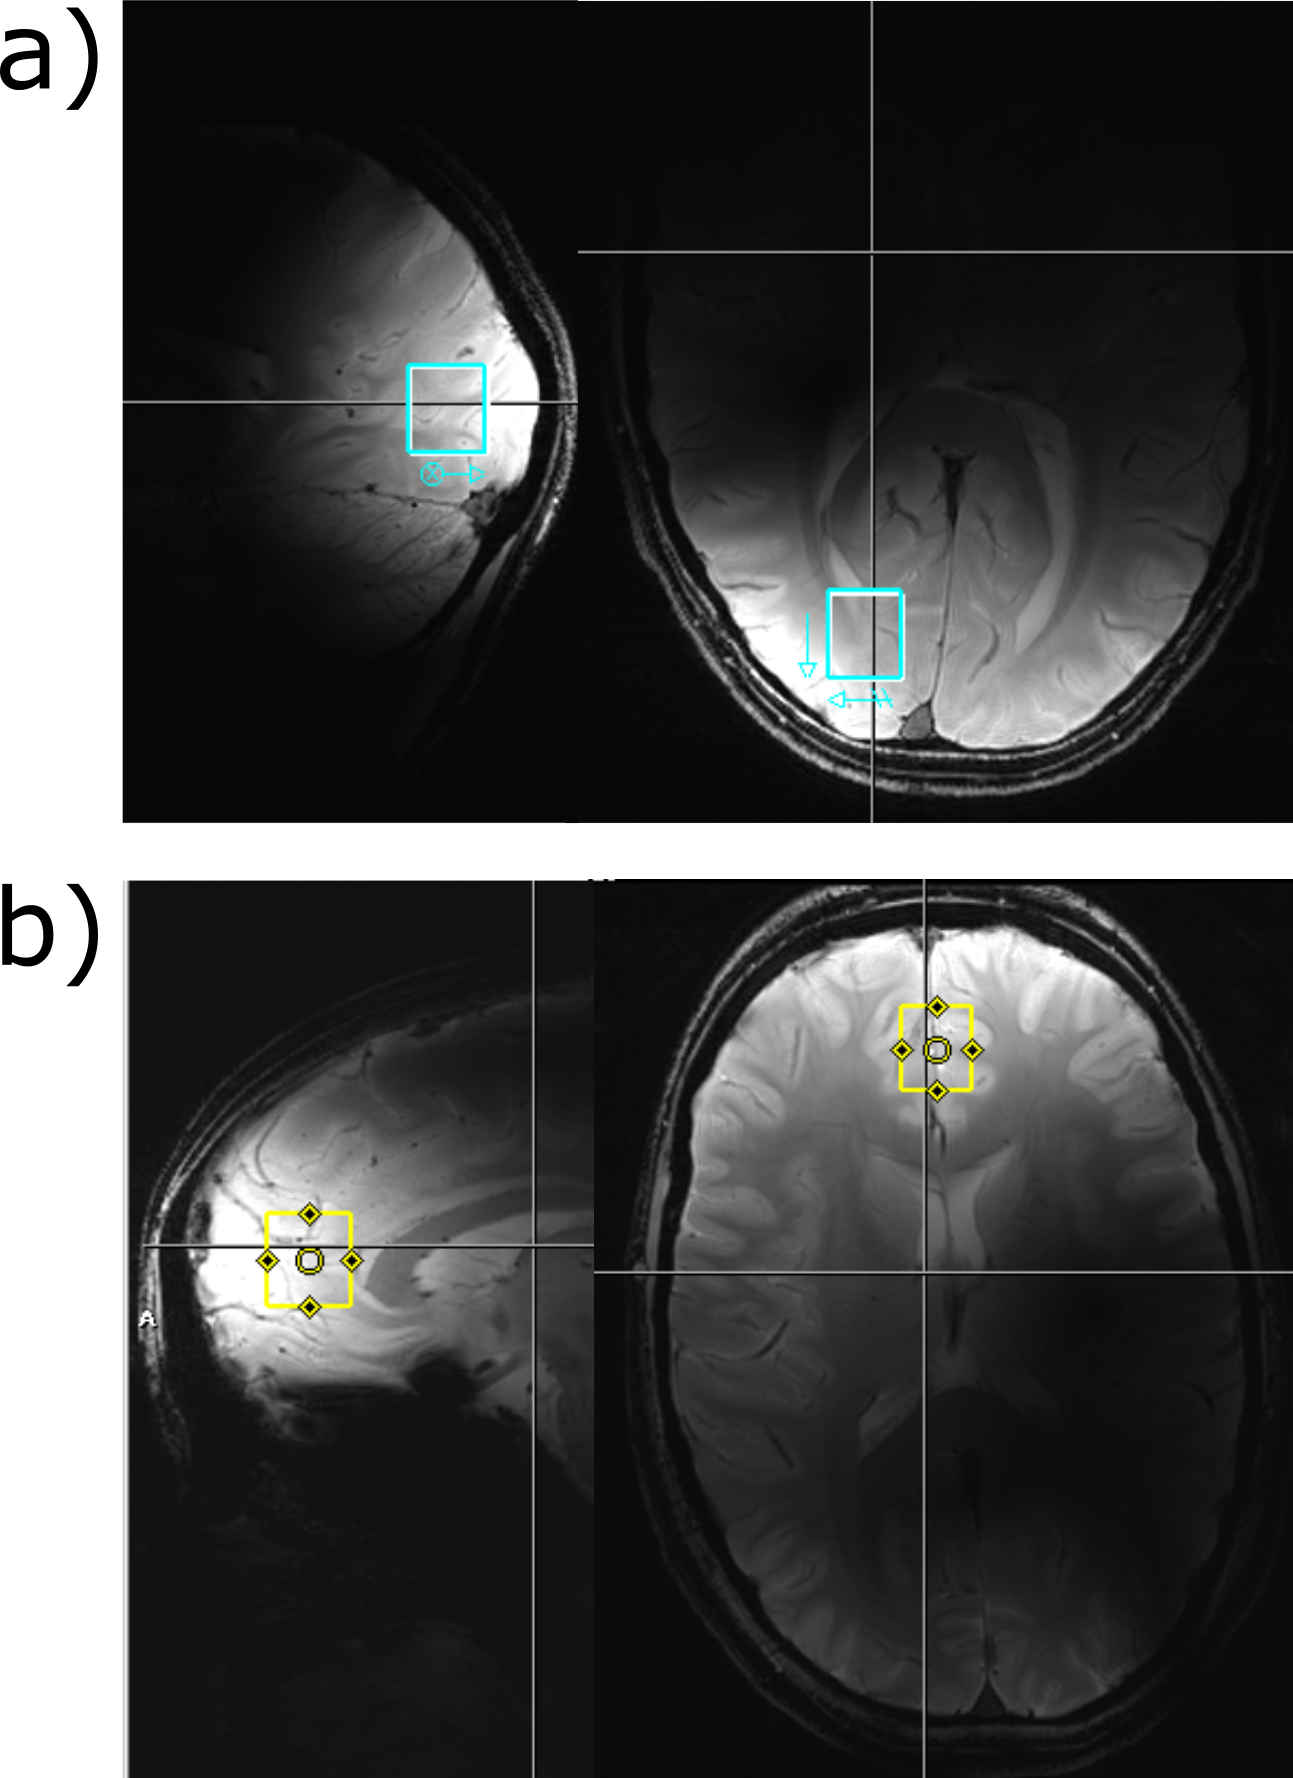
The labeling effects have been measured in 15 healthy volunteers in two different brain areas using a short TE 1H MC-semiLASER sequence (TE= 24, TR=5s, 64 averages, acquisition time=512 ms, bandwidth=8000 Hz). The voxel (15x18x20 mm3=5.4 ml) was positioned either in the frontal cortex or the occipital lobe; see Figure 1 for the voxel position. The spectra in were measured with in-house built coils: with a surface coil for the occipital lobe12 and an 8Tx16Rx coil in surface mode for the frontal cortex13. The volunteers fasten for 9 hours before the measurement starts. After the acquisition of a baseline spectrum, the volunteers drunk [13C-1]Glc solution (0.75g glucose/kilogram body weight) and were then scanned up to 2 hours after the glucose administration. The data was processed and then fitted with LCModel (V6.3‐1L)14. The LCModel basis set contained basis spectra for [13C-4]Glu, [13C-4]Gln, [13C-3]Glu, [13C-3,4]Glu additionally to 17 non-labeled metabolites (NAA, Asc, Asp, Cr, PCr, GABA, Glc, GSH, Lac, mI, NAAG, GPC, PE, sI, Tau, Glu, Gln).Results
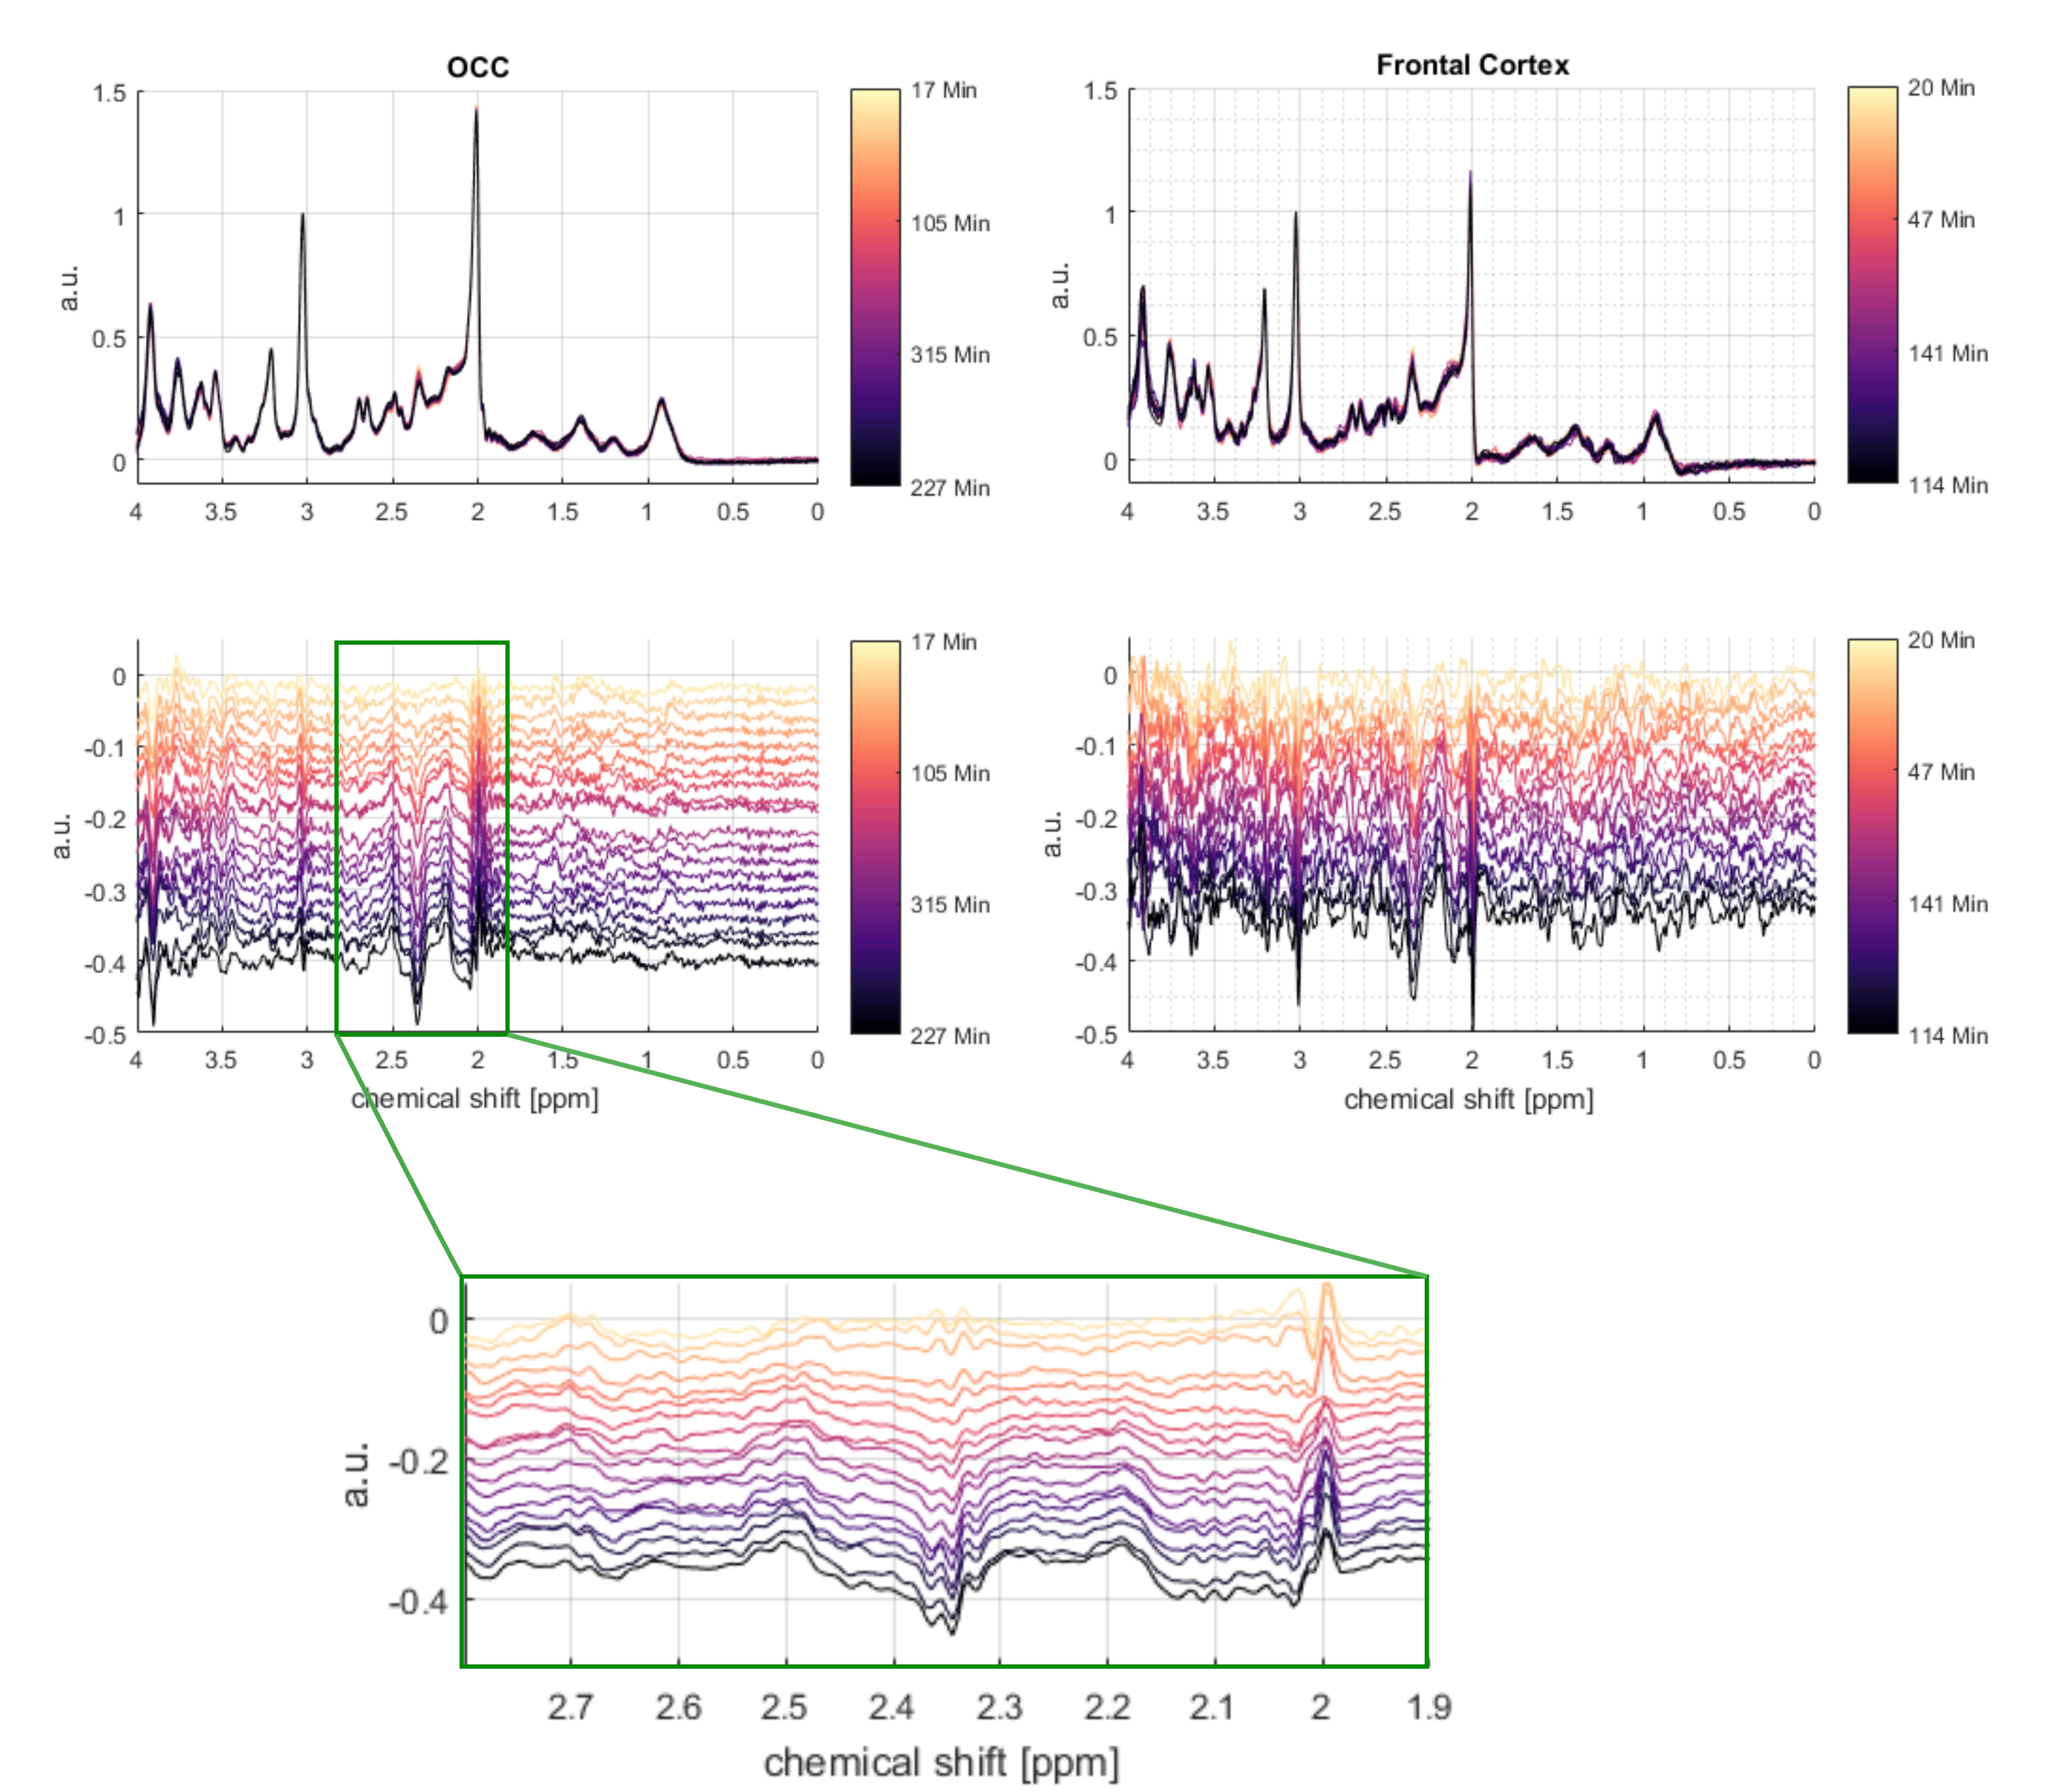
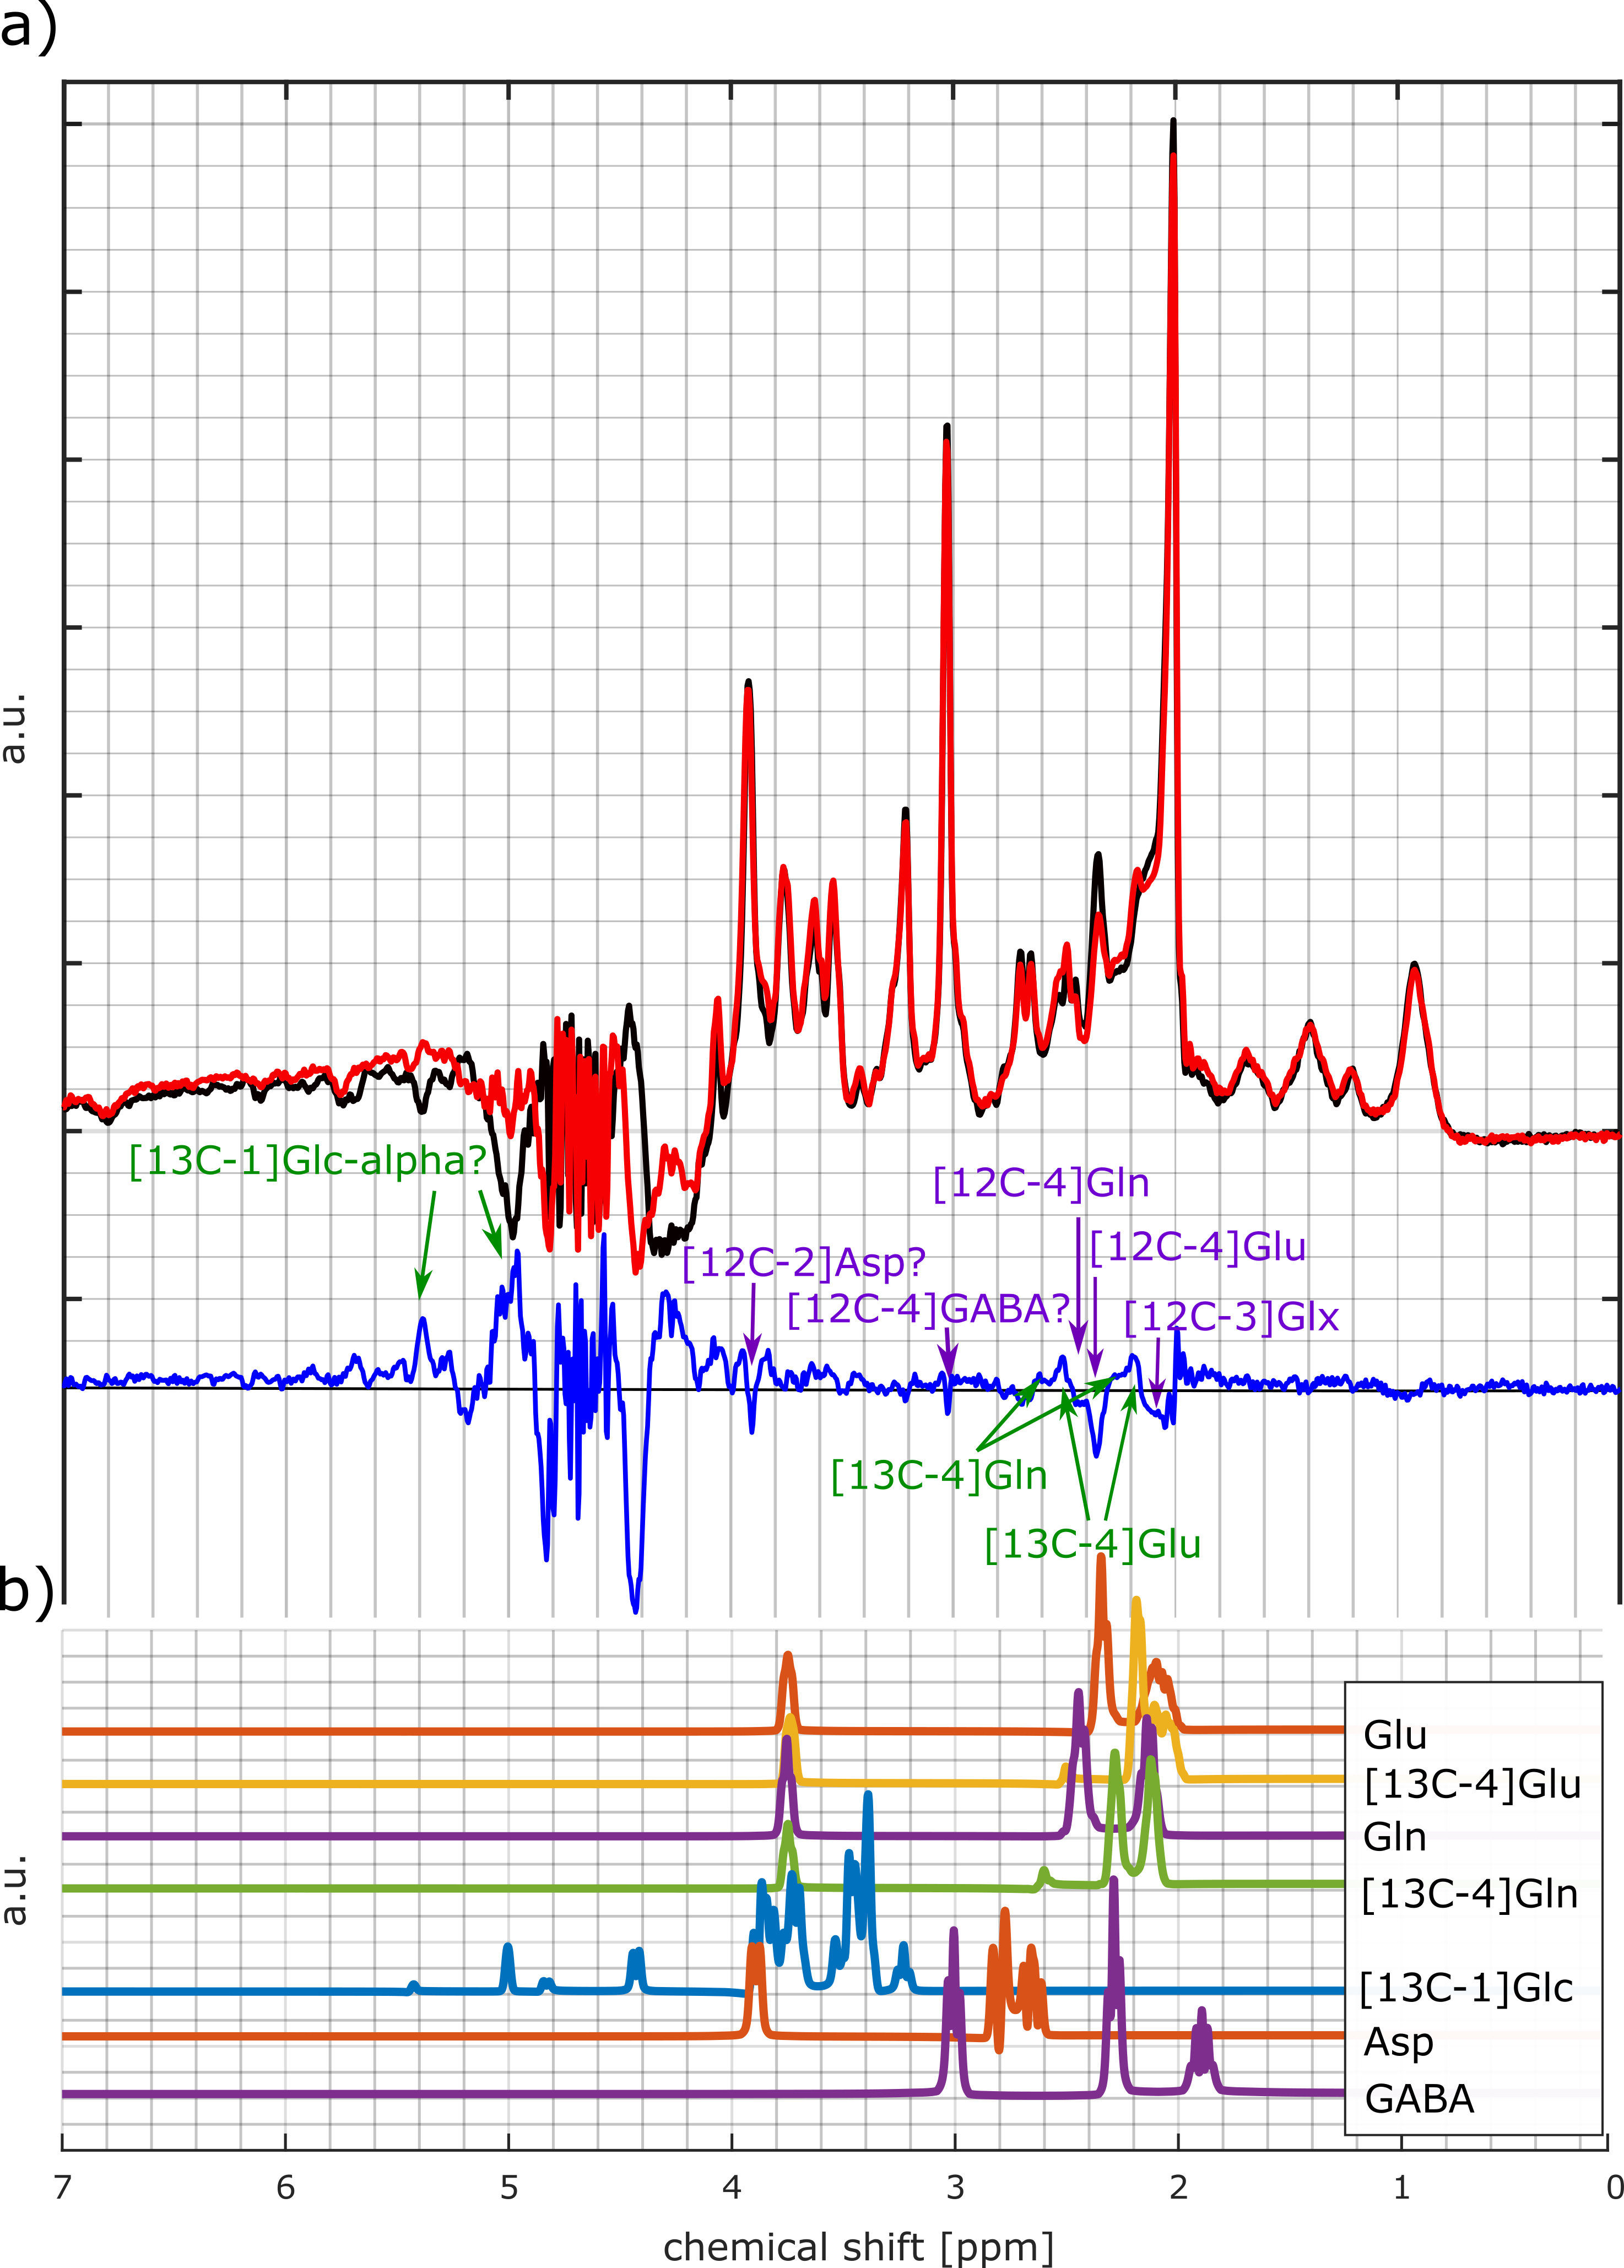
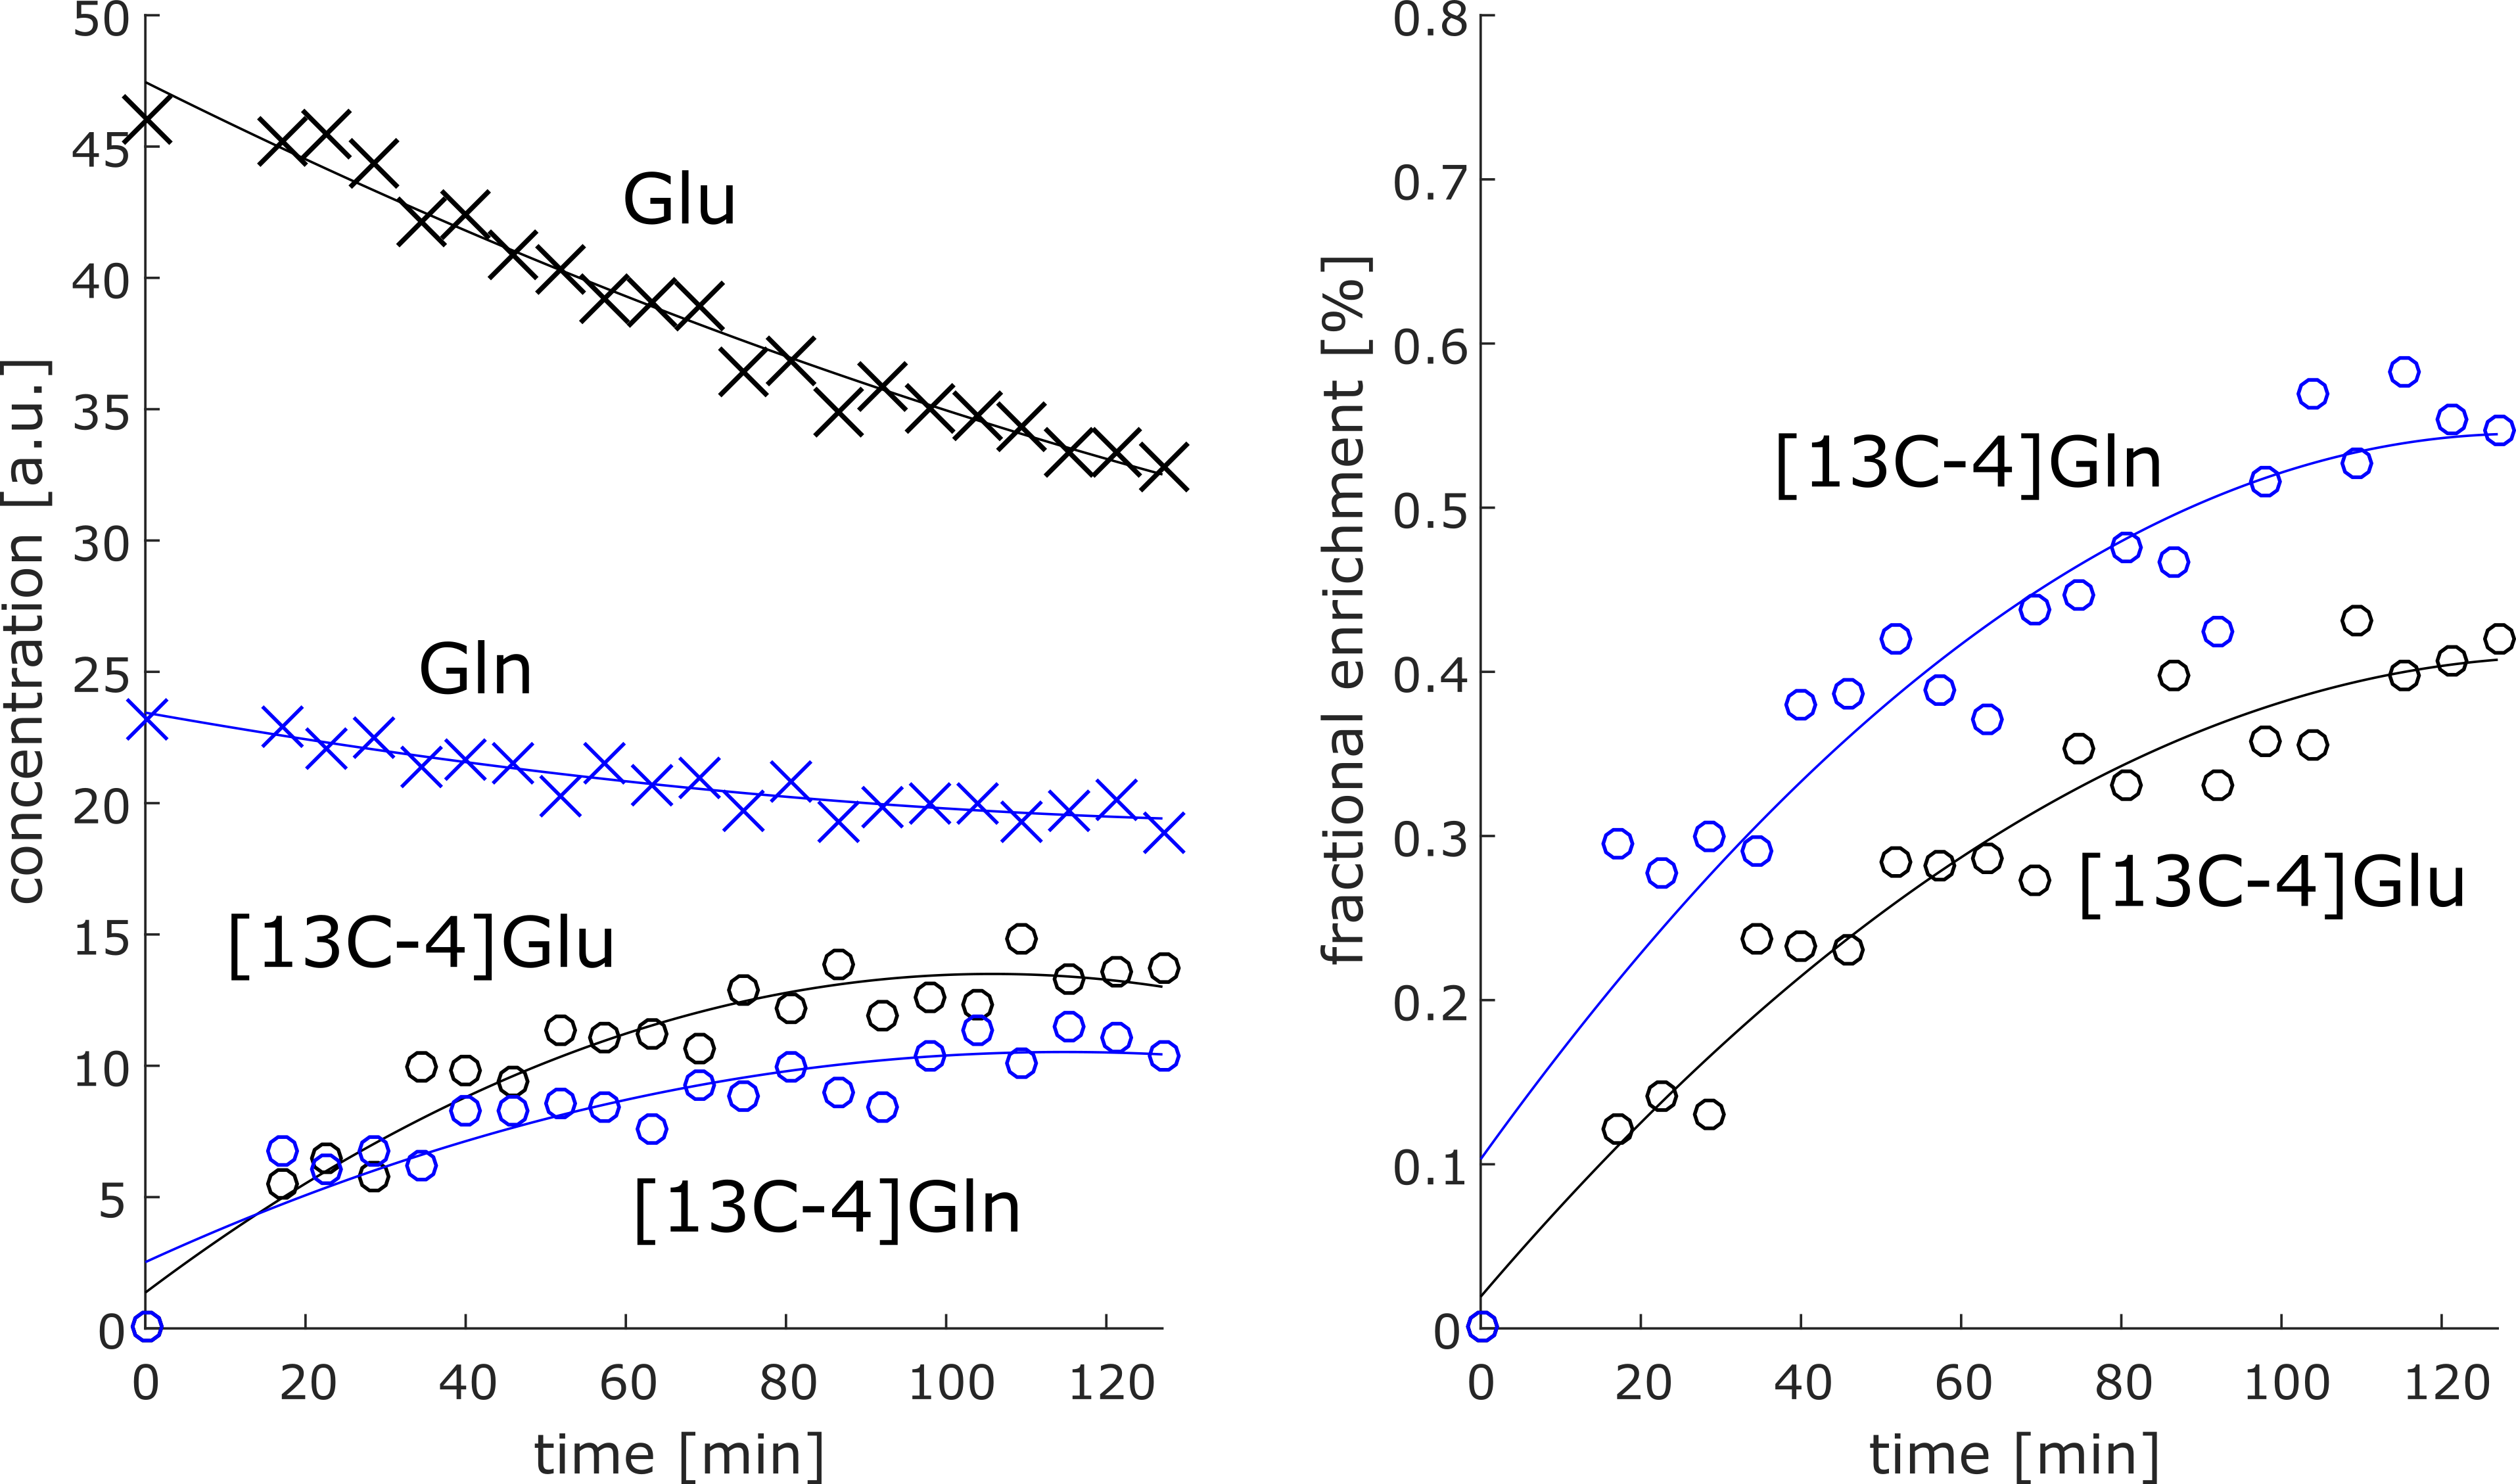
Most dominant is the labeling effect seen in the decrease of [12C-4]Glu at 2.34 ppm and the increase of [13C-4]Glu at 2.18 and 2.5 ppm; see the spectra and difference spectra in Figure 2 for one measurement in the frontal lobe and one in the occipital lobe. The respective decrease of the [12C-4]Gln peak at 2.44 ppm and the increase of the [13C-4]Gln peaks at 2.6 ppm and 2.28 ppm is better seen in Figure 3a), where the first, the last and their difference spectrum from the voxel in the occipital lobe is shown. Results from the LCModel fit for Glu, Gln, [13C-4]Glu and [13C-4]Gln are shown in Figure 4.In addition, increased [13C-1]alpha-Glc peaks can be seen in the downfield region of the spectrum at 5.42 and 5 ppm. In Figure 3b) simulated metabolite spectra of selected metabolites are shown. The comparison of these simulations with additional visible spectral pattern changes also indicate potential changes in Asp and GABA concentrations.
Discussion
Preliminary LCModel fits show the expected behavior: Unlabeled Glu and Gln concentration decrease while [13C-4]Glu and [13C-4]Gln concentrations increase in time. But, the LCModel fit overestimates the [13C-4]Gln concentration significantly; its concentration should be lower than the concentration of the [13C-4]Glu since it is labeled subsequently to Glu.However, the difficulty of this ongoing study will be to identify and quantify additional labelling induced concentrations changes accurately, especially those changes of metabolites with complex spectral pattern and/or low tissue concentrations, e.g. Glc, GABA and Asp. To achieve this the spectrum acquired before the Glc administration could be fitted and may be integrated as one baseline spectrum into the spectral fit model for quantifying the spectra after the Glc administration. Those metabolites, which are expected to change after Glc administration, should be then added as additional separate spectral models to the basis set. Another option would be to calculate and fit difference spectra as Dehghani et al. did it. In this case, the problem of subtraction errors due to minor changes of linewidth, line shape, frequency offset and phase over time has to be addressed and minimized. The used fitting approach would automatically account for such changes.
Nonetheless, the spectral quality of the data looks promising and may allow to identify several additional labeling induced changes in other metabolites apart from Glu and Gln such as aspartate and GABA as indicated in Figure 3. 13C studies reported additionally changes in NAA, lactate and alanine15. Further optimization of the fitting routine may potentially enable to detect also these changes.
Another future aspect of this work is the determination of metabolic turnover rates, e.g. the rate of Glu to Gln or Glc to Glu.
Conclusion
Oral administration of [13C-1]glucose lead to detectable changes in 1H MRS spectra in humans at 9.4 T in the occipital lobe as well as in the frontal cortex. The high spectral quality enables the observation of labeling effects apart from those of glutamate and glutamine such as GABA and aspartate. Further optimization is needed to quantify these concentration changes accurately.Acknowledgements
Funding by SYNAPLAST (Grant No. 679927 to T.Z., J.D., and A.H.) and Cancer Prevention and Research Institute of Texas (CPRIT) (Grant No. RR180056 to A.H.) is gratefully acknowledged.References
1. Luykx JJ, Laban KG, van den Heuvel MP, et al. Region and state specific glutamate downregulation in major depressive disorder: A meta-analysis of 1H-MRS findings. Neurosci Biobehav Rev. 2012;36(1):198-205. doi:10.1016/j.neubiorev.2011.05.014
2. Mitchell ND, Baker GB. An update on the role of glutamate in the pathophysiology of depression. Acta Psychiatr Scand. 2010;122(3):192-210. doi:10.1111/j.1600-0447.2009.01529.x
3. Yüksel C, Öngür D. Magnetic resonance spectroscopy studies of glutamate-related abnormalities in mood disorders. Biol Psychiatry. 2010;68(9):785-794. doi:10.1016/j.biopsych.2010.06.016
4. Mason GF, Petersen KF, de Graaf RA, Kanamatsu T, Otsuki T, Rothman DL. A comparison of 13 C NMR measurements of the rates of glutamine synthesis and the tricarboxylic acid cycle during oral and intravenous administration of. Brain Res Protoc. 2003;10:181-190. http://www.sciencedirect.com/science/article/pii/S1385299X02002179.
5. Rothman DL, Novotny HJ, Shulman GI, et al. 1H-[13C] NMR measurements of [4-13C] glutamate turnover in human brain. Proc Nati Acad Sci USA. 1992;89(October):9603-9606.
6. Morris P, Bachelard H. Reflections on the application of 13C-MRS to research on brain metabolism. NMR Biomed. 2003;16(6-7):303-312. doi:10.1002/nbm.844
7. Rothman DL, De Feyter HM, de Graaf RA, Mason GF, Behar KL. 13C MRS studies of neuroenergetics and neurotransmitter cycling in humans. NMR Biomed. 2011;24(8):943-957. doi:10.1002/nbm.1772
8. Boumezbeur F, Besret L, Valette J, et al. NMR measurement of brain oxidative metabolism in monkeys using 13C-labeled glucose without a 13C radiofrequency channel. Magn Reson Med. 2004;52(1):33-40. doi:10.1002/mrm.20129
9. An L, Li S, Ferraris Araneta M, Johnson CS, Murdoch JB, Shen J. In Vivo Detection of 13 C Labeling of Glutamate and Glutamine Using Proton MRS at 7T. ISMRMB Abstr. 2015;23(2014):25150. doi:10.1002/mrm.25150.3.
10. An L, Li S, Murdoch JB, Araneta MF, Johnson CS, Shen J. Detection of glutamate, glutamine, and glutathione by radiofrequency suppression and echo time optimization at 7 Tesla. Magn Reson Med. 2015;73(2):451-458. doi:10.1002/mrm.25150
11. Dehghani M, Zhang S, Kumaragamage C, Rosa-Neto P, Near J. Dynamic 1H-MRS for detection of 13C-labeled glucose metabolism in the human brain at 3T. Magn Reson Med. 2020. doi:10.1002/mrm.28188
12. Pfrommer A, Avdievich NI, Henning A. Four Channel Transceiver Array for Functional Magnetic Resonance Spectroscopy in the Human Visual Cortex at 9.4 T 1. In: ISMRM. ; 2014.
13. Avdievich NI, Giapitzakis IA, Pfrommer A, Borbath T, Henning A. Combination of surface and ‘vertical’ loop elements improves receive performance of a human head transceiver array at 9.4 T. NMR Biomed. 2018. doi:10.1002/nbm.3878
14. Provencher SW. Estimation of metabolite concentrations from localized in vivo proton NMR spectra. Magn Reson Med. 1993. doi:10.1002/mrm.1910300604
15. Gruetter R, Adriany G, Choi IY, Henry PG, Lei H, Öz G. Localized in vivo 13C NMR spectroscopy of the brain. NMR Biomed. 2003. doi:10.1002/nbm.841
Figures