2208
Whole Brain 3D-FIDESI-MRSI: Revisiting Free-Induction-Decay & Spin-Echo Readouts with Concentric Rings at 7 T1Department of Biomedical Imaging and Image-guided Therapy, Medical University of Vienna, High Field MR Centre, Vienna, Austria, 2Department of Radiology, Massachusetts General Hospital, Martinos Center for Biomedical Imaging, Boston, MA, United States, 3Christian Doppler Laboratory for Clinical Molecular MR Imaging, Vienna, Austria, 4Department of Neurosurgery, Medical University of Vienna, Vienna, Austria
Synopsis
3D-FIDESI-MRSI combines a free-induction-decay-readout with an echo-readout to permit the measurement of whole-brain lactate as an important tumor biomarker in approximately 40 min. This enables the acquisition of signals at short TE with reduced T2-weighting as well as spectra at long TE without lipid contamination. Sufficient SNR is ensured by a smaller and oversampled spherical k-space coverage for the echo-readout using fast concentric ring trajectories. A test in a healthy volunteer successfully demonstrates feasible mapping of the major metabolites.
Introduction
FID-MRSI1,2 (free-induction-decay magnetic resonance spectroscopic imaging) is especially attractive at high field strengths due to the decreased T2-related signal loss and enables the acquisition of highly resolved three-dimensional brain metabolic maps in very short times, e.g. a 80x80x47 matrix in less than 16 min with rapid concentric ring trajectory readout (CRT)3. A big weakness of FID-MRSI is its inability to quantify the lactate (Lac) resonance at ~1.4ppm4 due to overlaid lipid signals, which is important for tumor grading. Thus, we propose to complement FID-MRSI with an additional readout after spin-echo refocusing (inspired by FIDESI, FID echo spectroscopic imaging, Kukurova et al.5) at TE=288ms, where the lipid contamination should be relaxed completely.Methods
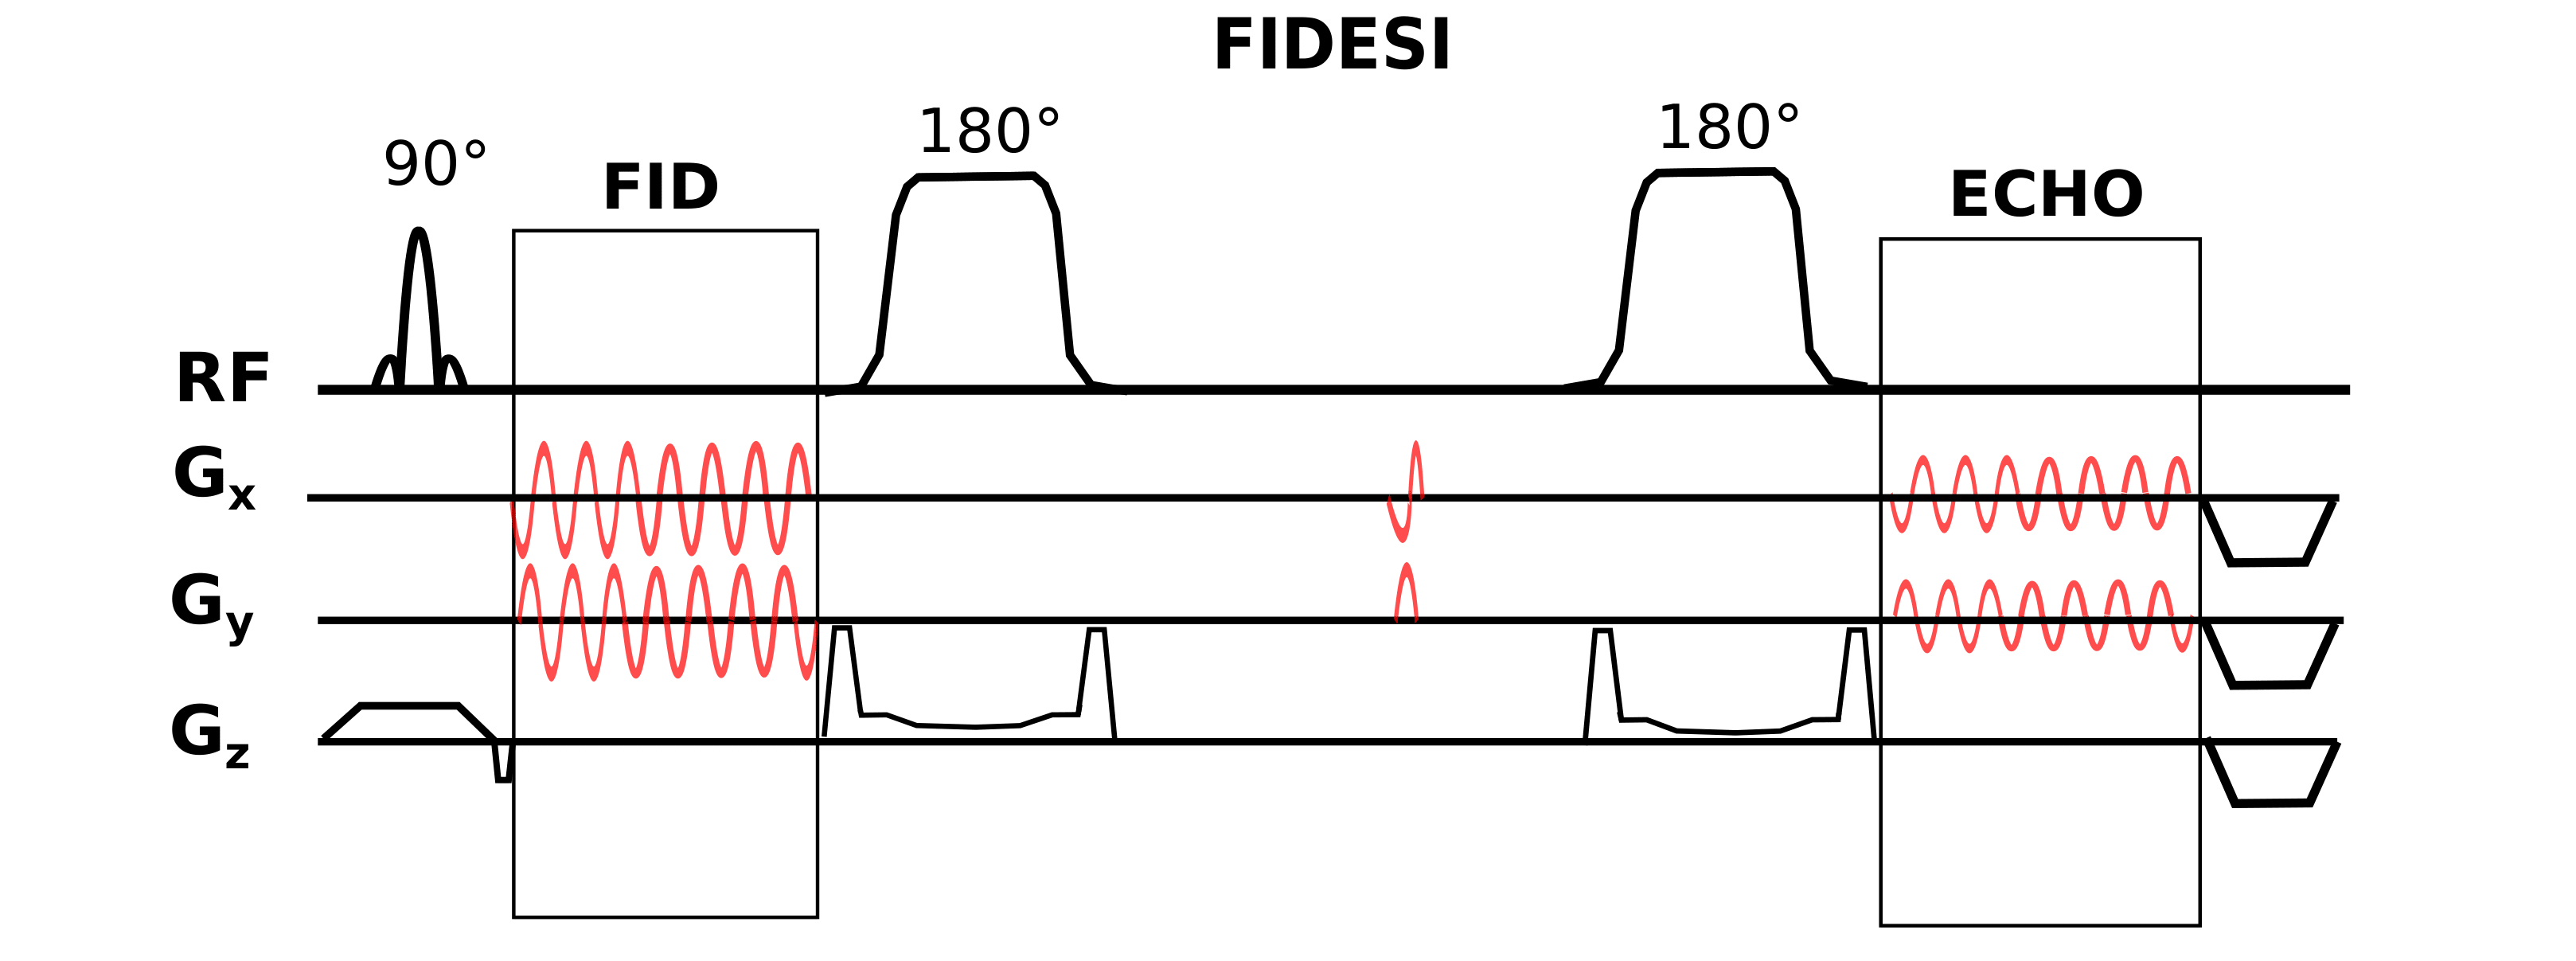
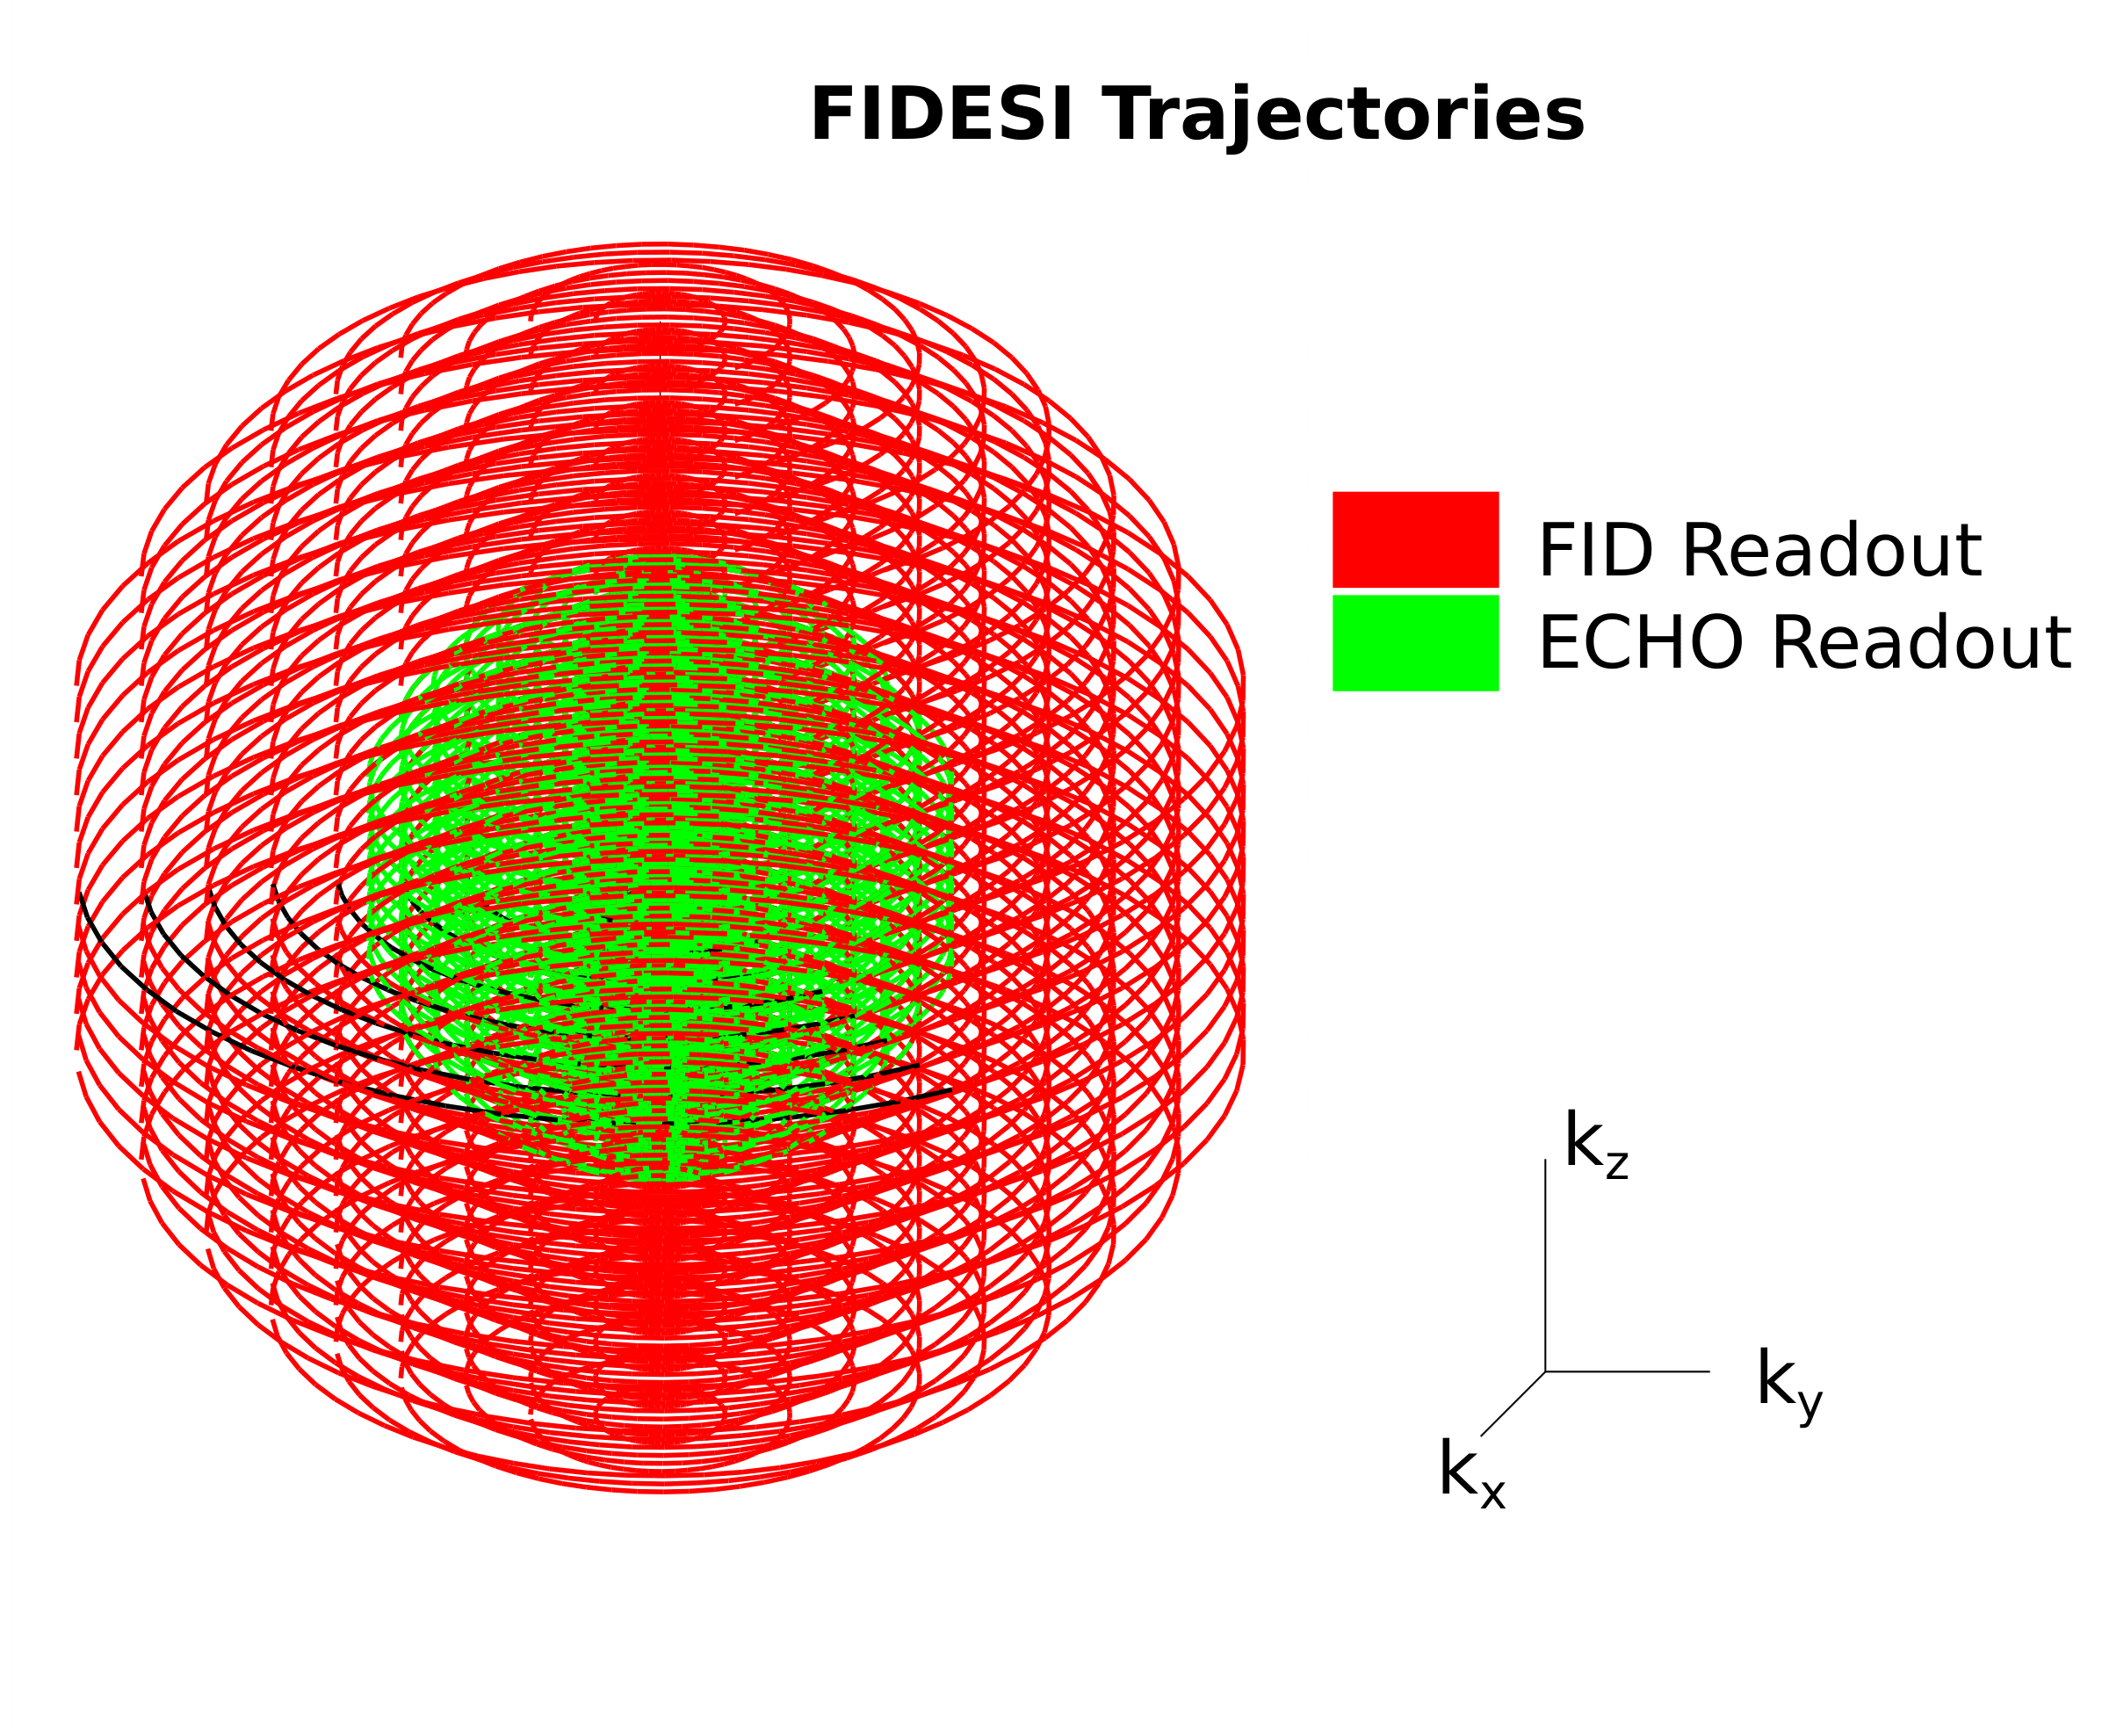
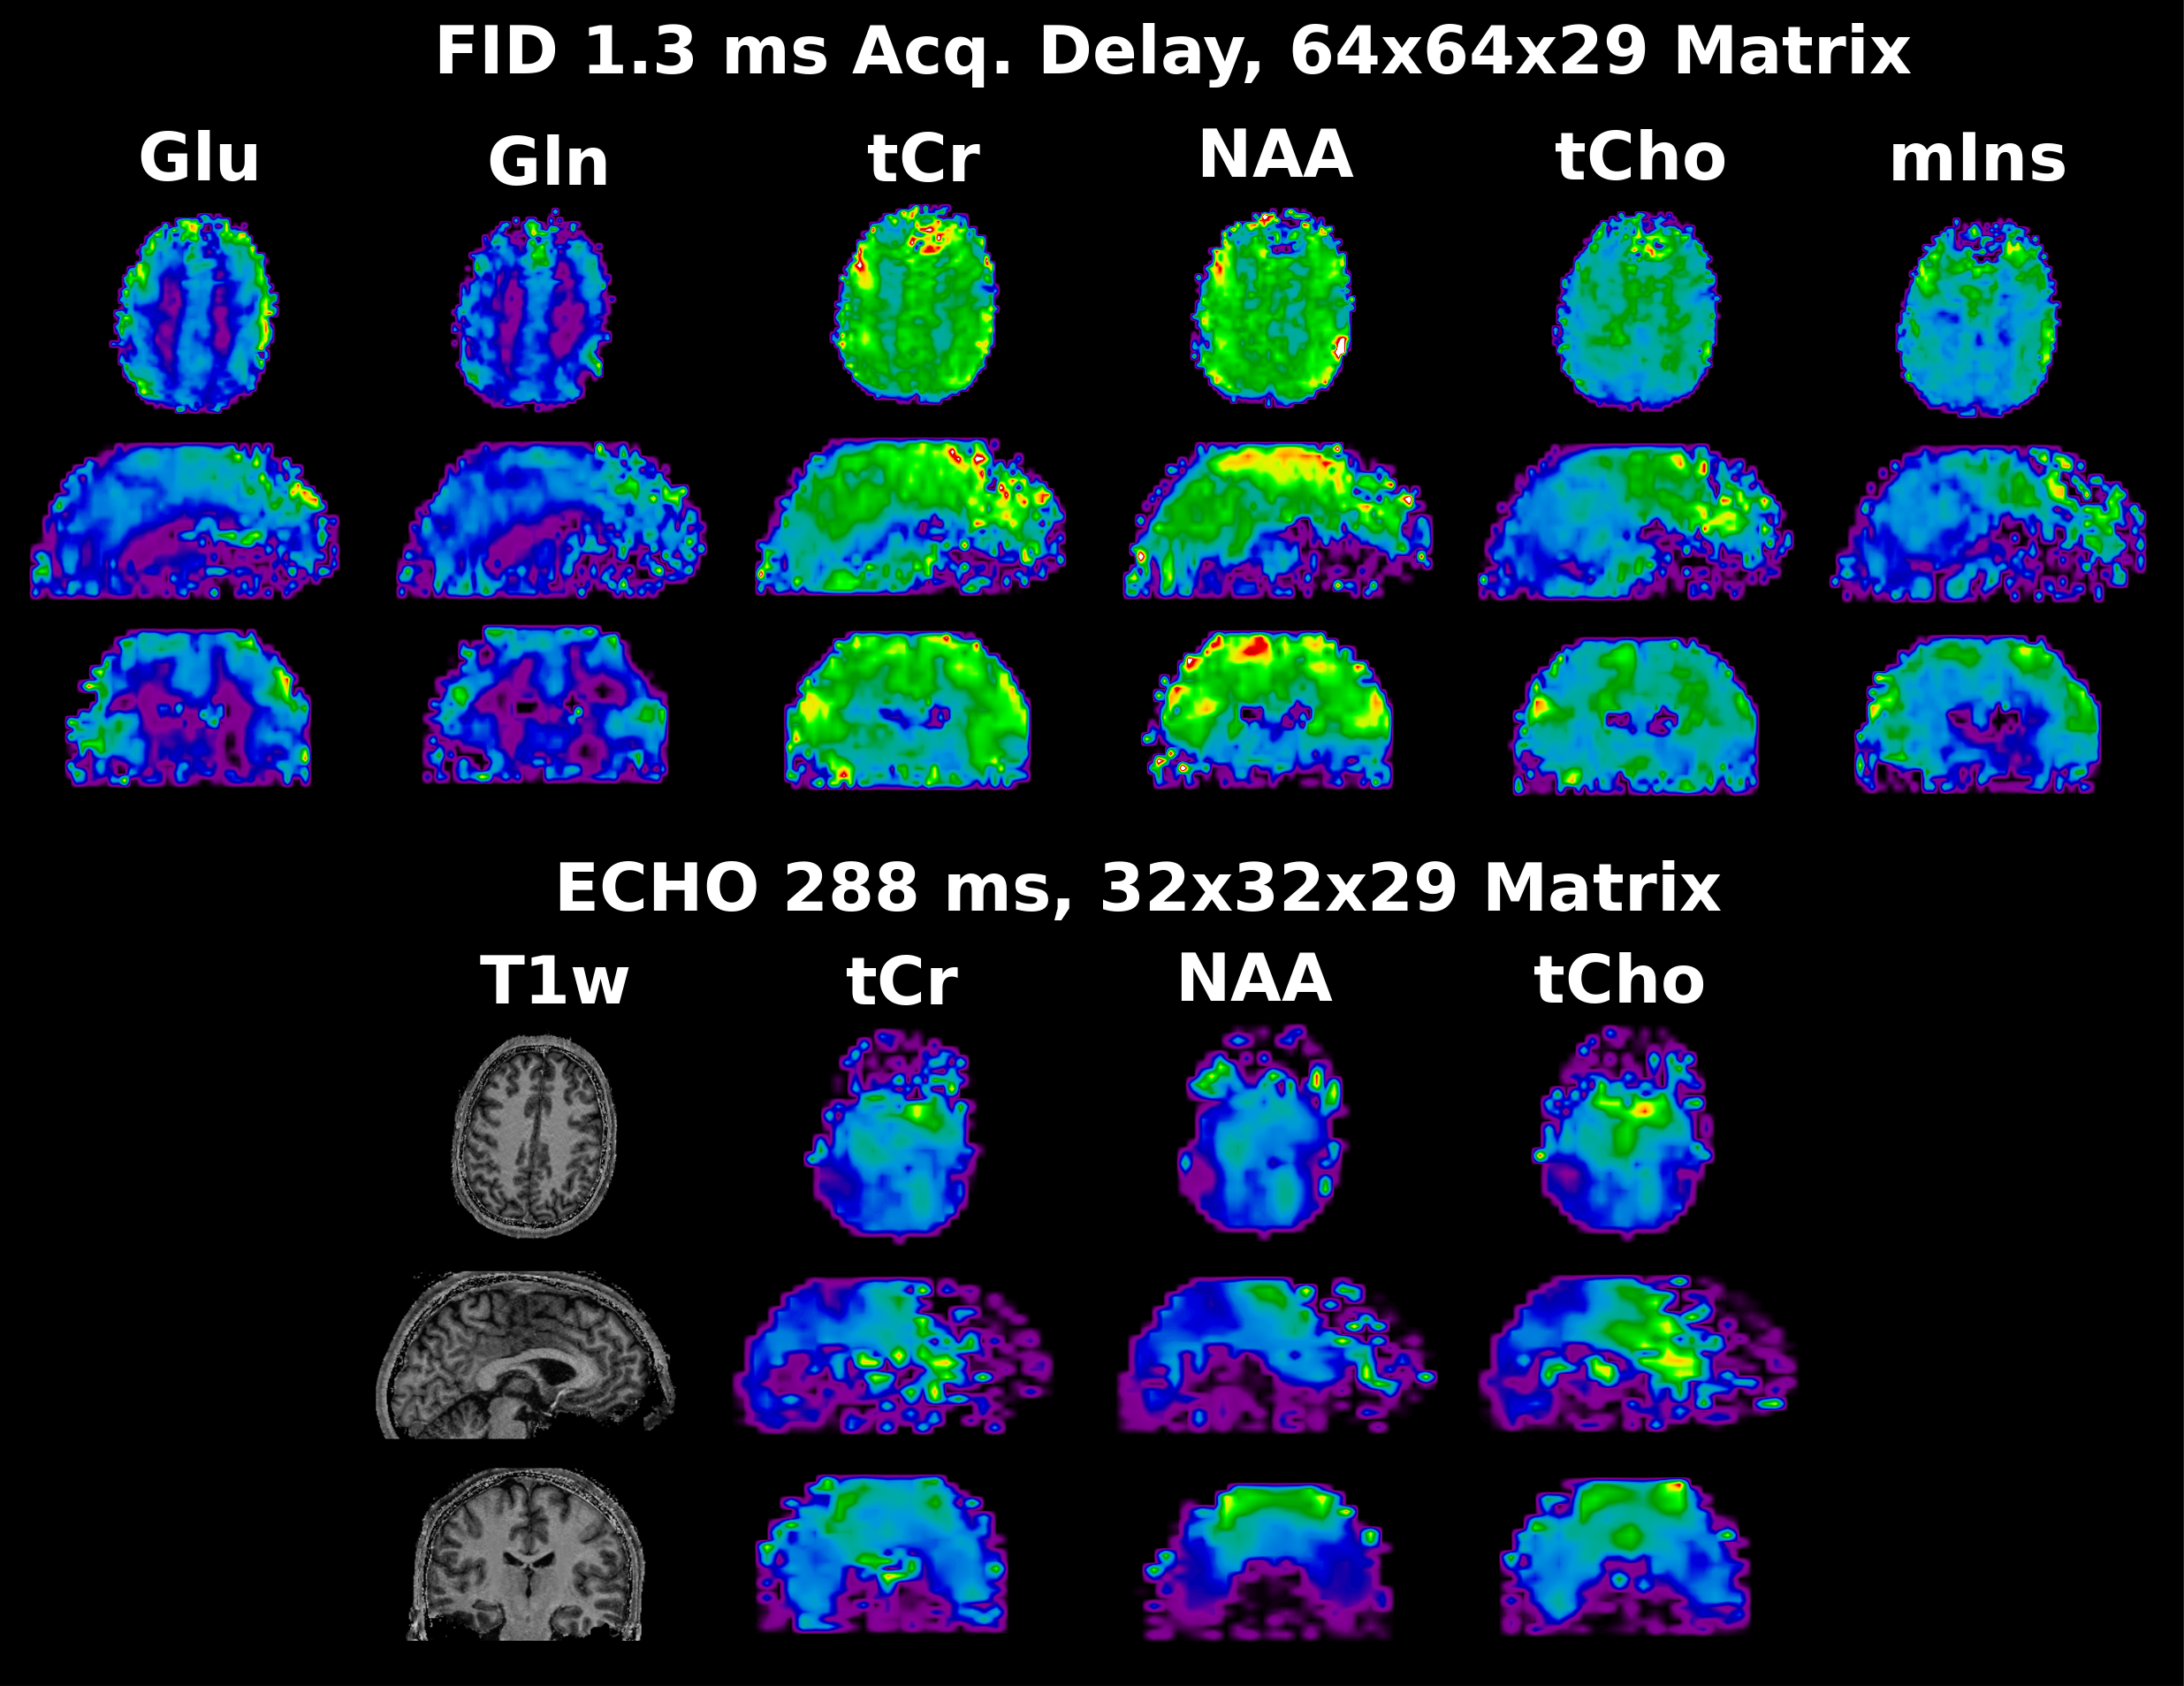
A previously published 3D-FID-MRSI with CRT3 was extended to a sLASER scheme (Figure 1) by adding a single pair of GOIA6 adiabatic refocusing pulses (10kHz bandwidth, 10ms duration) to create an echo at TE=288ms. This TE has been shown by Lange et al. to be the optimal echo-time for Lac quantification4. The final spoilers of the FID-MRSI readout were moved to the end of the echo-readout. A pair of gradients were played out between the two adiabatic pulses to null the 0-th order in-plane magnetization which is built up by the CRT trajectories to initially move the readout in k-space to the given circle radii and reach the desired velocity. To maximize the FID readout length (only 120ms) the placement of the GOIA pulses was asymmetrical with the second GOIA pulse directly before the spin-echo readout (also 120 ms). The other sequence parameters were: TR=1690ms; acquisition delay 1.3ms, spectral bandwidth 2778Hz with up to 3 variable temporal interleaves, SAR 100%, FOV 220x220x130mm³, VOI 220x220x80mm³, 1 average, total scan time 39min23sec on a 7T Siemens Magnetom Scanner with a 32-channel NOVA head coil. To counteract the massively reduced signal amplitude and the expected low Lac signal (in patients) due to the high TE, a reduced k-space fraction was covered by the echo readout as shown in Figure 2. However both readouts featured the same number of rings and partitions. The FID-MRSI matrix size was 64x64x29. The echo-acquisition was oversampled twice as dense in all three k-space dimensions but with half the extent, hence cropping was necessary to reduce the FOV. This resulted in an effective spherical matrix size of 32x32x15 as measured for the echo readout. iMUSICAL coil combination7 via a pre-scan image was similarly performed for the FID and echo scan. The FID-basis set from reference3 was used. An echo-basis set for LCModel8 fitting of the echo data between 4.2 and 1.0ppm containing only N-acetylaspartate (NAA), total creatine (tCr), total choline (tCho) and Lac was simulated for TE=288ms with NMRSCOPEB9. 3D-FIDESI-MRSI with CRT was tested in vivo in a healthy volunteer as a proof-of-concept. Healthy subjects don’t show enough Lac for quantification, but we expect the Lac concentrations up to twice as high as the NAA concentrationsat TE=288ms4 in tumors.Results
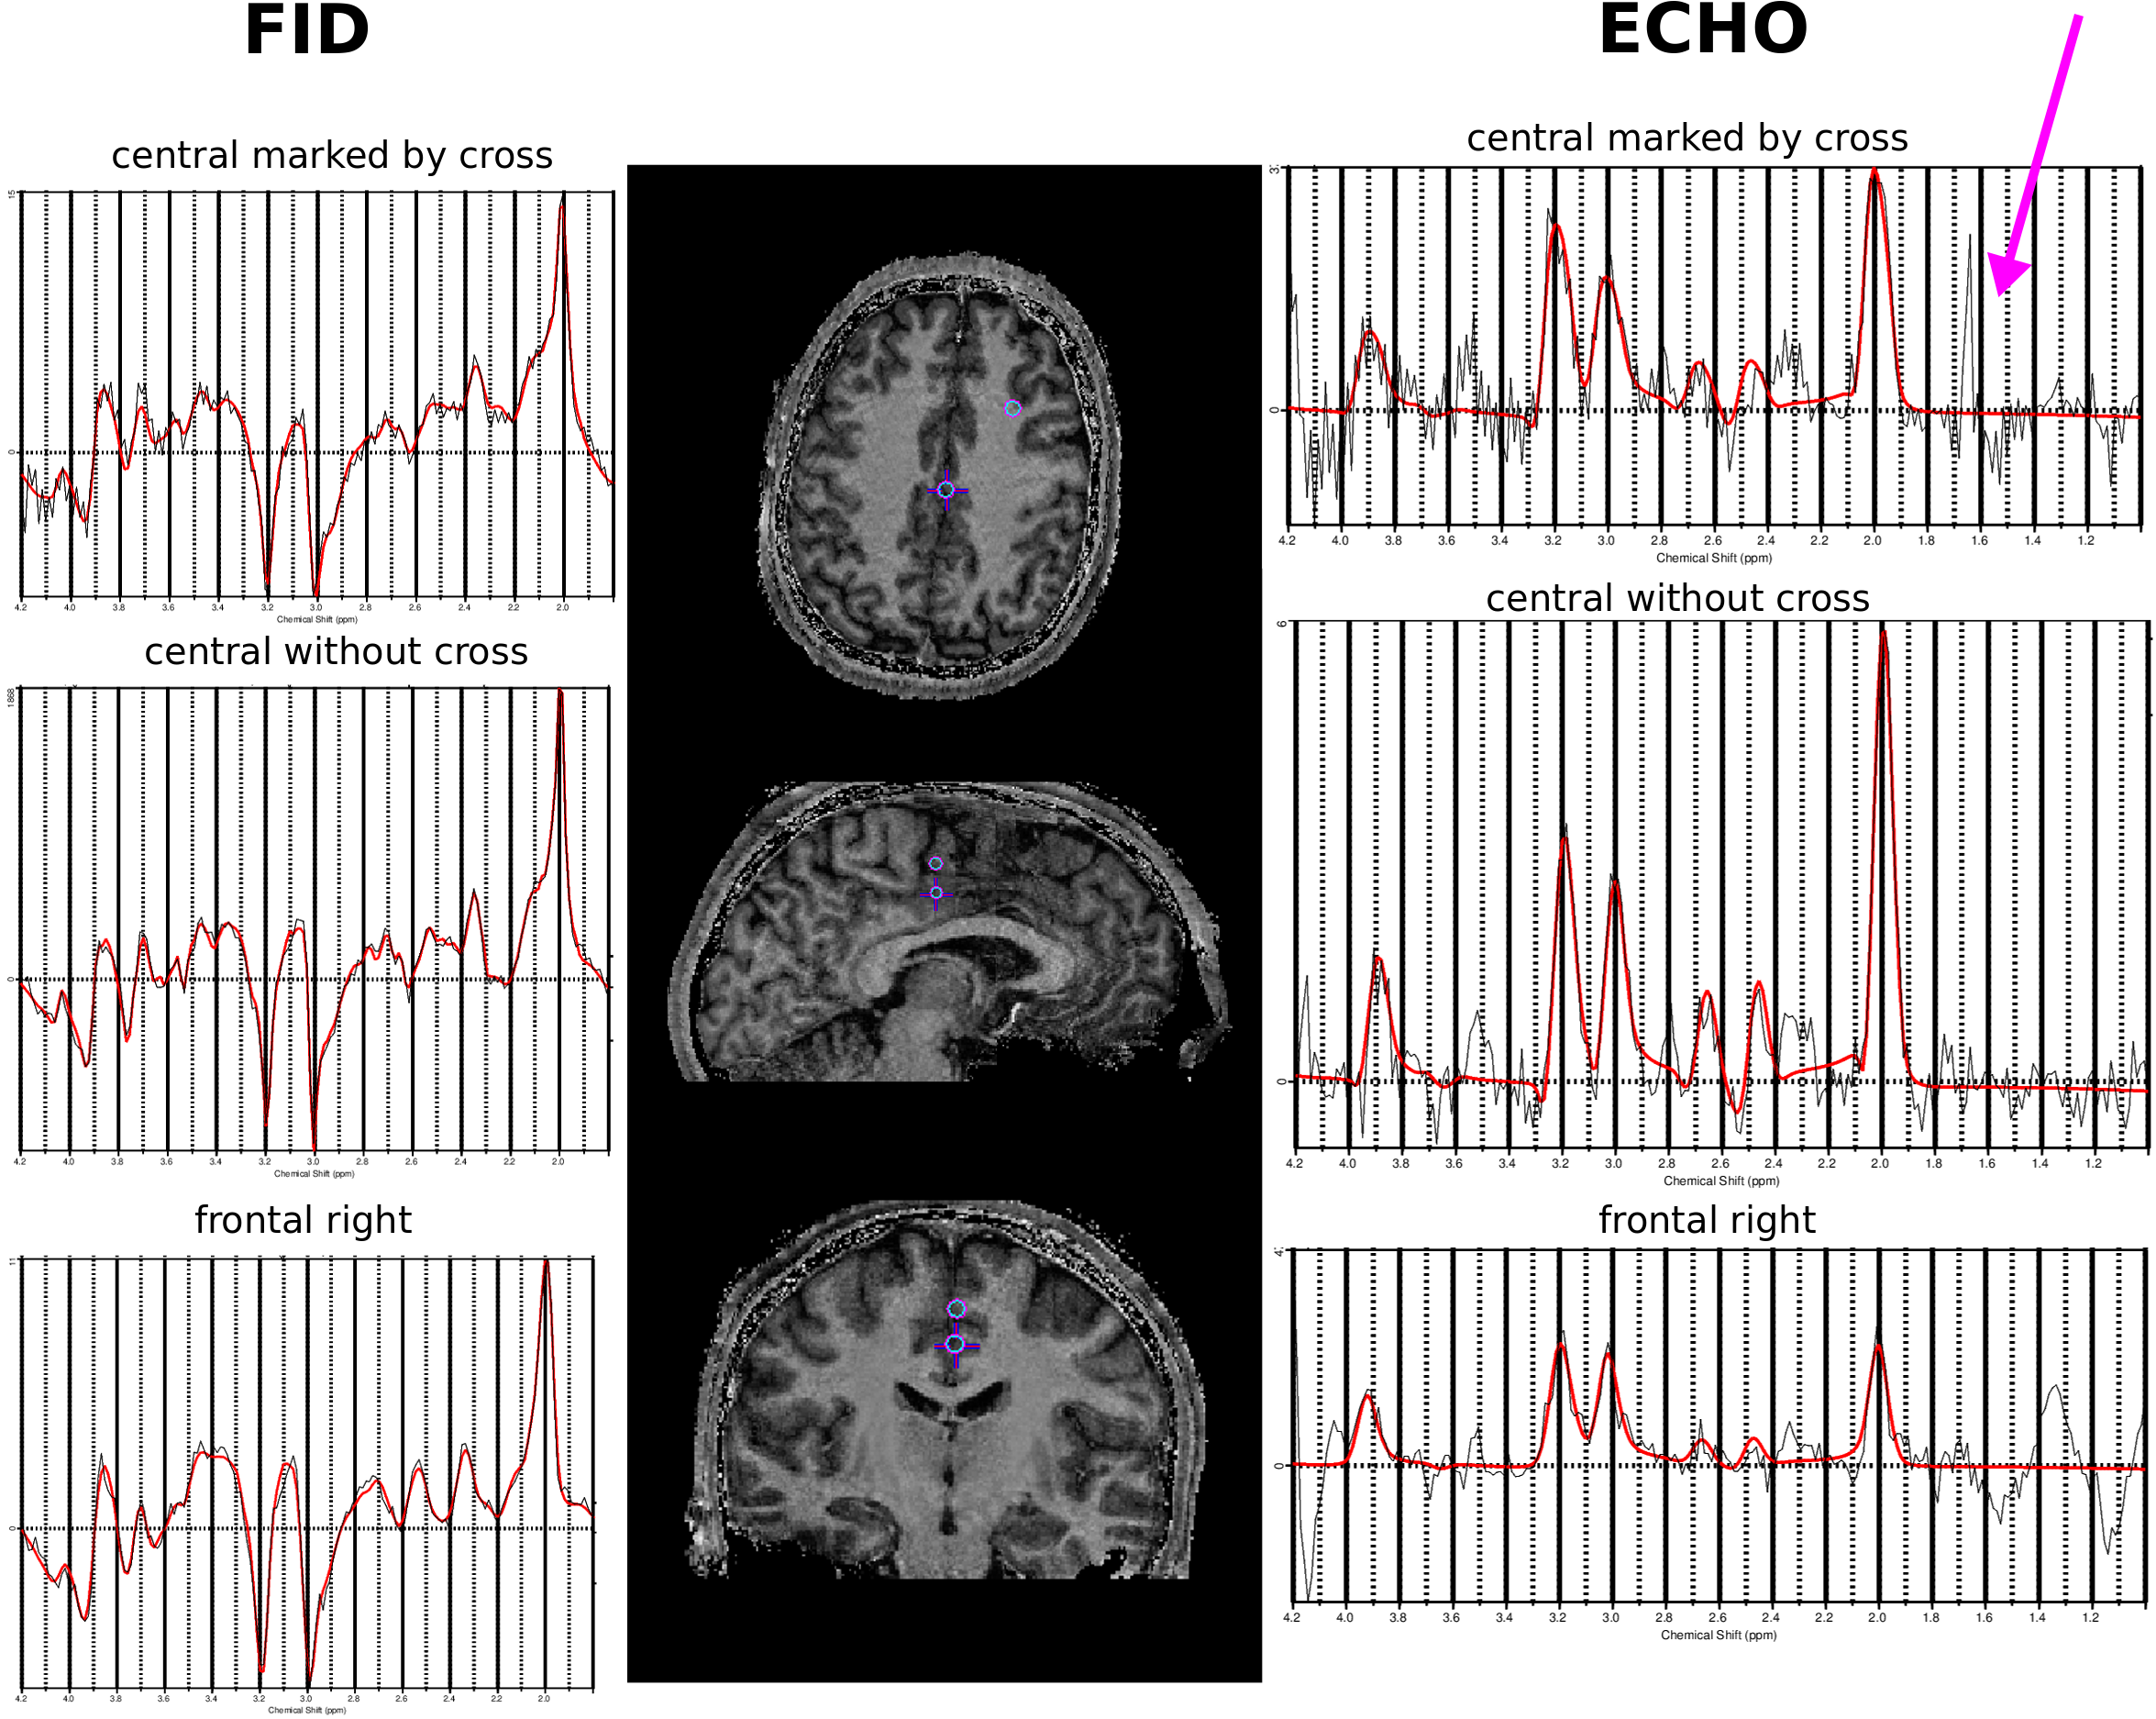
Figure 3 shows representative spectra of the FID and of the spin-echo acquisition which visualizes the total relaxation of the lipid signal around 1.4ppm. Metabolic maps maps of the major three metabolites are displayed in Figure 4 for the FID and the echo scan as well as glutamate (Glu), glutamine (Gln) and myo-inositol (mIns) for the FID scan only.Discussion
The proposed sequence tweaks many critical parameters, such as the ultra-short acquisition duration of only 120 ms (336 spectral points) at cost of spectral quality (truncation effects, spectral resolution) or the very long echo-time (low echo-SNR) in favor of the FID readout, however still produces promising results by covering a reduced k-space for reaching an acceptable SNR. The used adiabatic pulses are insensitive to B1-inhomogeneities, not prone to chemical shift errors and perform well at 7T, however they require long TRs due to the increased SAR, therefore limiting fast TR methods such as CRT-MRSI. For studies where only the Lac signal is of interest, the GOIA pulses could be exchanged by small bandwidth non-adiabatic pulses with less SAR requirements to enable shorter TRs, while setting the transmitter frequency directly on the Lac resonance. As demonstrated in Figure 3, we observed spectral acoustic resonance sidebands, most likely originating from the strong crusher gradient of the second GOIA pulse which is shortly before the readout and should be removed. The frontal voxels of the echo-scan exhibited strong baseline distortions without any metabolic signals, possibly caused by gradient vibrations which resulted in much broader water sidebands due to B0-inhomogeneities. Problems with truncation artifacts due to few spectral points could be circumvented by extrapolating the signal in time domain via prior knowledge or optimizing the fitting by truncated basis sets. The TR could be reduced even further (reaching TR~288ms) by using conventional low energy refocusing pulses, and by acquiring only the ‘left’ side of the echo. This would result in total measurement times similar than in reference2, e.g. ~9min for a matrix of 64x64x39 (FID) and respectively 32x32x20 (echo) by accepting some spectral drawbacks10.Conclusion
3D-FID-MRSI can be enhanced by additional lactate imaging (FIDESI, preliminarily demonstrated in a healthy volunteer), which is a crucial biomarker for tumor detection and classification.Acknowledgements
This study was supported by the Austrian Science Fund (FWF) grants KLI-646, P 30701 and P 34198.References
[1]
Bogner W, Otazo R, Henning A. Accelerated MR spectroscopic imaging—a review of current and emerging techniques. NMR in Biomedicine. 2020;e4314. https://doi.org/10.1002/nbm.4314
[2] Hangel G et al.
High-resolution metabolic imaging of high-grade gliomas using
7T-CRT-FID-MRSI. Neuroimage Clin. 2020 Sep 15;28:102433. doi:
10.1016/j.nicl.2020.102433. Epub ahead of print. PMID: 32977210; PMCID:
PMC7511769.
[3] Hingerl L et al. Clinical High-Resolution 3D-MR Spectroscopic
Imaging of the Human Brain at 7 T. Invest Radiol. 2020
Apr;55(4):239-248. doi: 10.1097/RLI.0000000000000626. PMID: 31855587.
[4] Lange T et al. Pitfalls in lactate
measurements at 3T. AJNR Am J Neuroradiol. 2006 Apr;27(4):895-901. PMID:
16611787.
[5]
Just Kukurova I et al, Two‐dimensional
spectroscopic imaging with combined free induction decay and long‐TE
acquisition (FID echo spectroscopic imaging, FIDESI) for the detection
of intramyocellular lipids in calf muscle at 7 T, NMR Biomed., 27: 980– 987. DOI: 10.1002/nbm.3148
[6] Andronesi OC et al Spectroscopic imaging with improved gradient modulated constant
adiabaticity pulses on high-field clinical scanners. J Magn Reson. 2010
Apr;203(2):283-93. doi: 10.1016/j.jmr.2010.01.010. Epub 2010 Jan 28.
PMID: 20163975; PMCID: PMC3214007.
[7] Strasser B et al Coil
combination of multichannel MRSI data at 7 T: MUSICAL. NMR Biomed. 2013
Dec;26(12):1796-805. doi: 10.1002/nbm.3019. Epub 2013 Sep 4. PMID:
24038331; PMCID: PMC3912904.
[8] Provencher SW.
Estimation of metabolite concentrations from localized in vivo proton
NMR spectra. Magn Reson Med. 1993 Dec;30(6):672-9. doi:
10.1002/mrm.1910300604. PMID: 8139448.
[9] Starčuk Z Jr et al. Quantum-mechanical simulations for in vivo MR
spectroscopy: Principles and possibilities demonstrated with the program
NMRScopeB. Anal Biochem. 2017 Jul 15;529:79-97. doi:
10.1016/j.ab.2016.10.007. Epub 2016 Oct 8. PMID: 27729226.
[10] Mulkern RV et al. Spectroscopic sampling of the left side of long-TE
spin echoes: a free lunch? MAGMA. 2018 Apr;31(2):321-340. doi:
10.1007/s10334-017-0647-7. Epub 2017 Sep 7. PMID: 28884314.
Figures