2207
Echo-planar Spectroscopic Imaging with Readout-segmented COKE at 7T: Artifact Analysis using a Purpose-Built Phantom and Simulation
Graeme A. Keith1, Amir Seginer2, David A. Porter1, and Rita Schmidt3
1Institute of Neuroscience and Psychology, University of Glasgow, Glasgow, Scotland, 2Siemens Healthcare Ltd, Rosh Ha’ayin, Israel, 3Neurobiology Department, Weizmann Institute of Science, Rehovot, Israel
1Institute of Neuroscience and Psychology, University of Glasgow, Glasgow, Scotland, 2Siemens Healthcare Ltd, Rosh Ha’ayin, Israel, 3Neurobiology Department, Weizmann Institute of Science, Rehovot, Israel
Synopsis
Echo-planar spectroscopic imaging (EPSI) is a fast method of acquiring metabolic information in the human brain. When applied at high-fields, such as 7T however, it suffers from limited spectral-width, as well as the inconsistencies between readout lines, seen at all field strengths, which lead to ghosts in the spectra. In this work, we present the readout-segmented COKE method, which removes the spectral-width limitation at 7T and provides a coherent phase evolution that avoids Nyquist artefacts in the spectra. Simulations and phantom scans are also presented, which seek to increase understanding of residual lipid contamination due to the readout-segmented spatial-encoding scheme.
Introduction
Magnetic resonance spectroscopic imaging provides metabolic information with high diagnostic value, but scan times are often too long for routine clinical application. One technique to reduce acquisition time is echoplanar spectroscopic imaging (EPSI)1-3. There is great interest in using this technique at 7T, where there is higher SNR and improved spectral resolution. However, the spectral width (SW) in EPSI is determined by gradient performance and can be insufficient to match the higher value required at 7T. In addition, the EPSI trajectory suffers from inconsistencies between readout lines acquired with alternating positive and negative gradients4. In this 1H study at 7T, we combine two methods: (1) readout segmentation5 to increase the spectral width, and (2) COKE (COnsistent K-t space Epsi)6,7 to produce a consistent temporal phase evolution.Methods
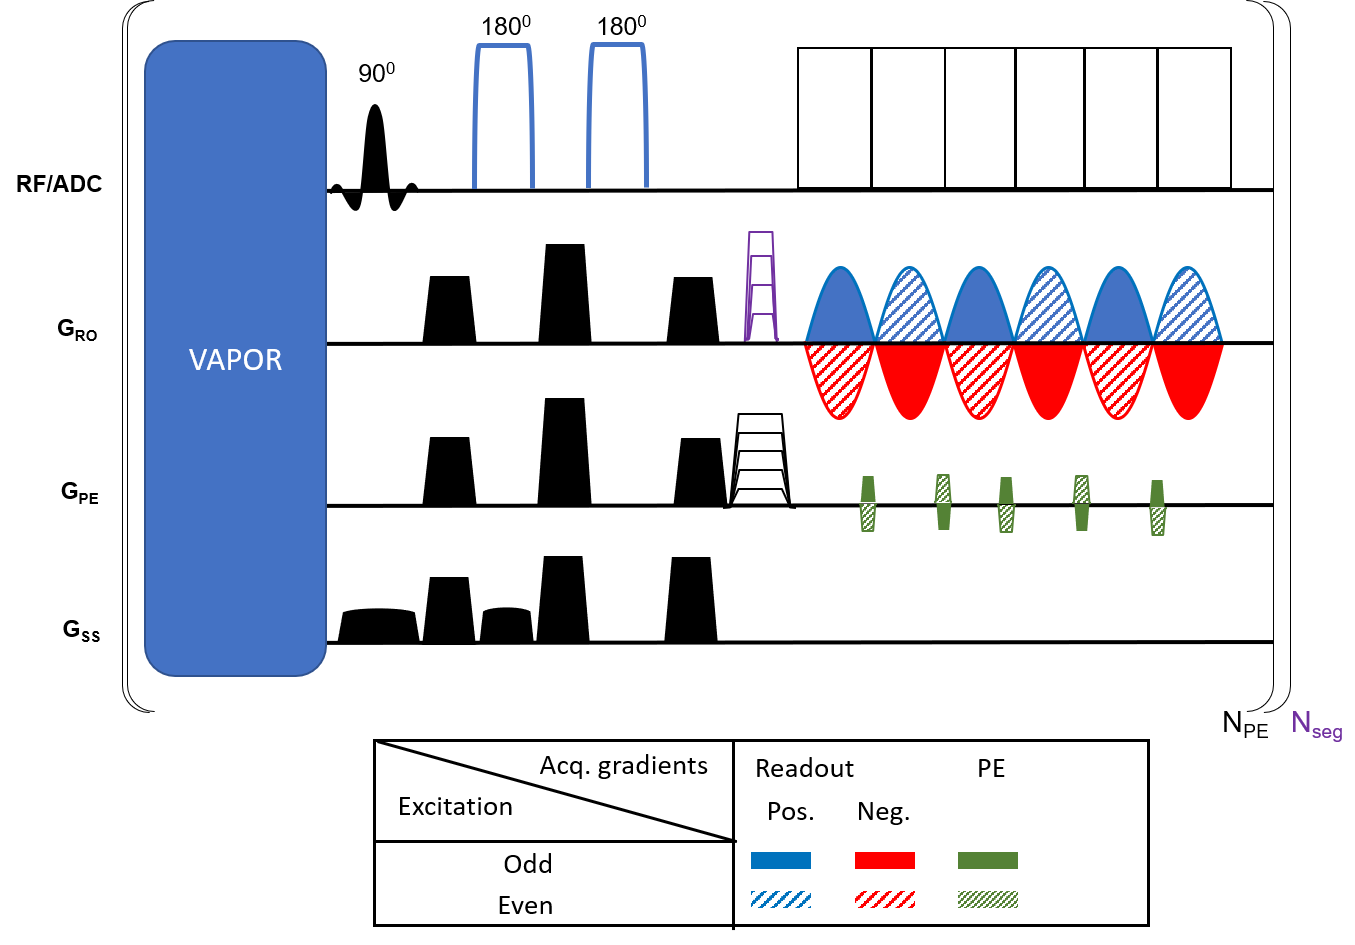
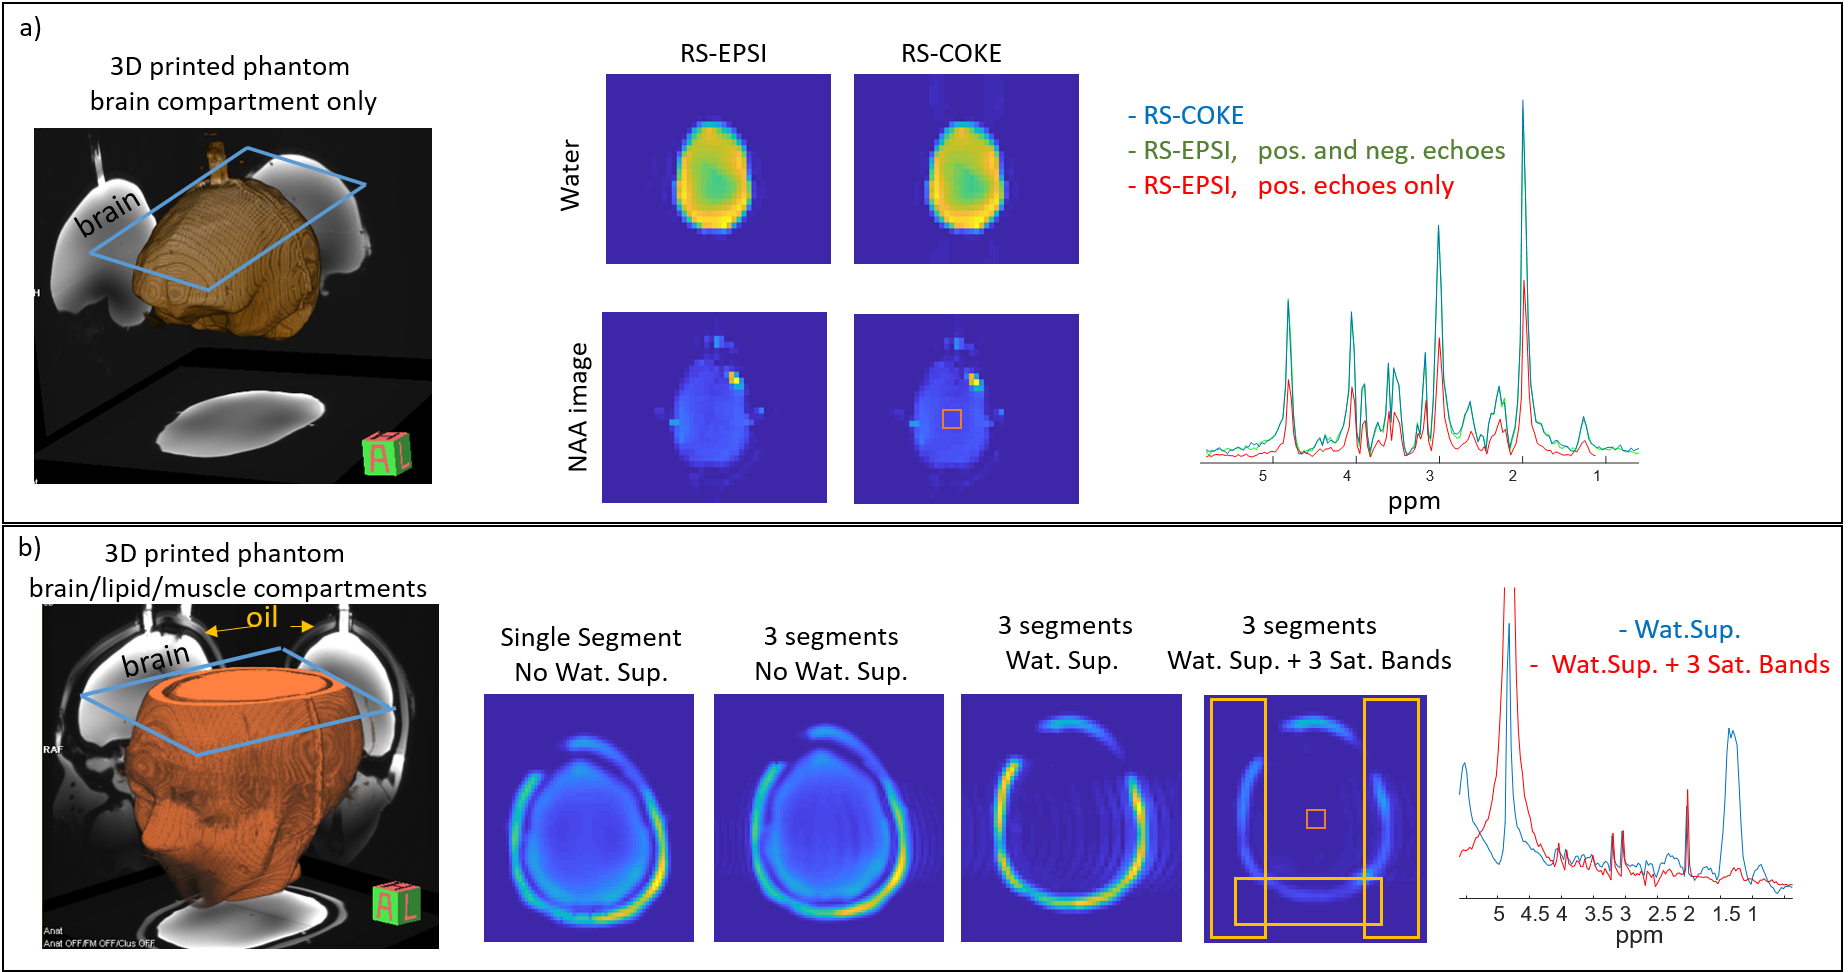
Fig. 1 shows the Readout-Segmented COKE (RS-COKE) pulse sequence8, which was implemented on a 7T MAGNETOM Terra (Siemens Healthcare, Erlangen, Germany). The sequence has a VAPOR water-suppression module9 and a pair of adiabatic pulses for spin-echo preparation10. The COKE gradient-encoding scheme interleaves blipped phase-encoding (PE) gradients between odd and even readout lobes. This displaces phase discontinuities caused by readout-gradient polarity from the temporal to the PE direction, thereby shifting the Nyquist artefacts from the spectral to the image domain, where their effect is more benign. The resulting image-domain ghost is minimized by phase correction using standard techniques11.Three phantoms were used to examine and optimize the sequence – 1) a spherical oil phantom, 2) a 3D-printed phantom with a “brain” compartment mimicking brain metabolite content and 3) a 3D-shaped phantom with brain-like compounds and a superficial compartment with a lipid-like compound. The 3D head-shaped phantom was designed to resemble the brain with respect to B0 and B1 distributions, metabolite content, and the subcutaneous lipid layer (see Ref. 12). The metabolite content included 10mM L-Glutamic acid, 10mM Creatine, 8mM myo-Inositol, 2mM GABA, 2mM Choline chloride, 5mM Choline chloride, 5mM Sodium lactate, and 12.5mM NAA. Sequence parameters for the 3D printed phantom scans were: TR/TE 1200/35 ms, FOV 200x250 mm2, slice thickness 15 mm, in-plane resolution 3.7x4 mm2 (54x64 acquisition matrix), 3 readout segments, SW 2778 Hz, echo spacing 0.36 ms, 296 echoes, and scan duration 3:50 min.
Data were acquired from the brain of a healthy subject using the following parameters: TR/TE 2000/35 ms, FOV 200x250 mm2, slice thickness 15 mm, in-plane resolution 4.3x4.5 mm2 (46x56 acquisition matrix), 3 readout segments, SW 2778 Hz, echo spacing 0.36 ms, 296 echoes, and scan duration 5:36 min. Simulations were also performed to investigate image-domain artifacts caused by the effect of residual lipid signals on readout-segmented spatial encoding.
Results and Discussion
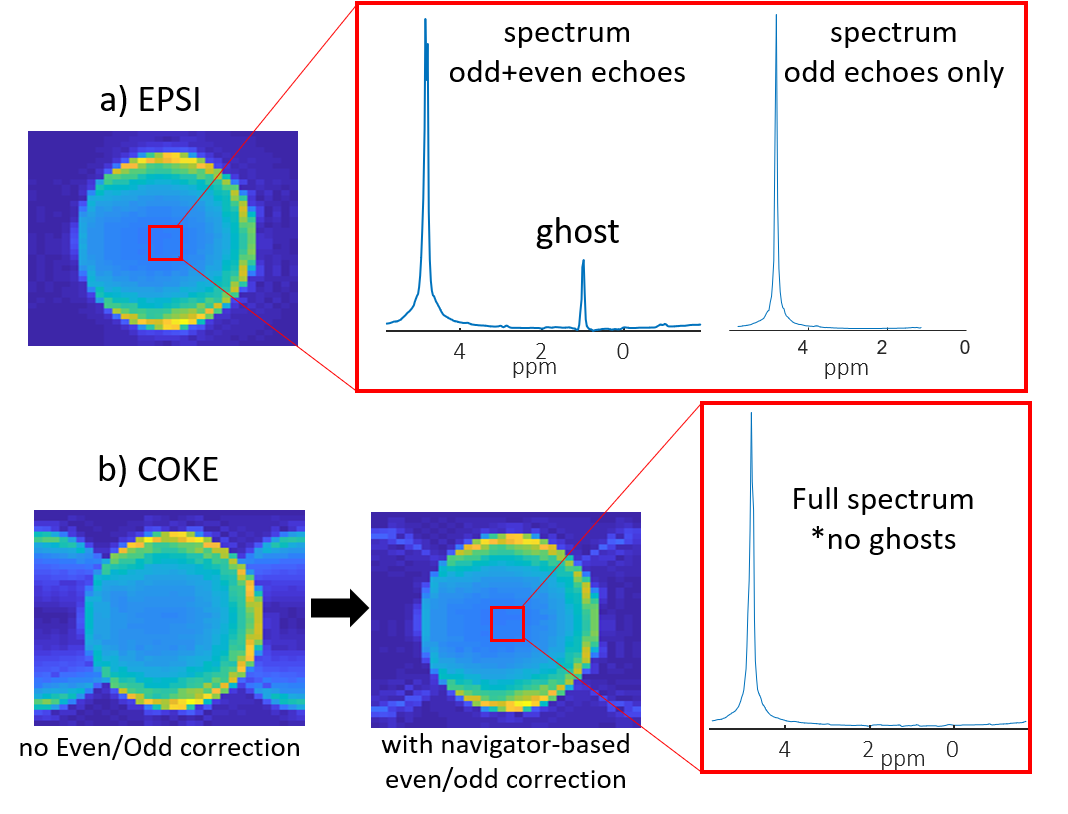
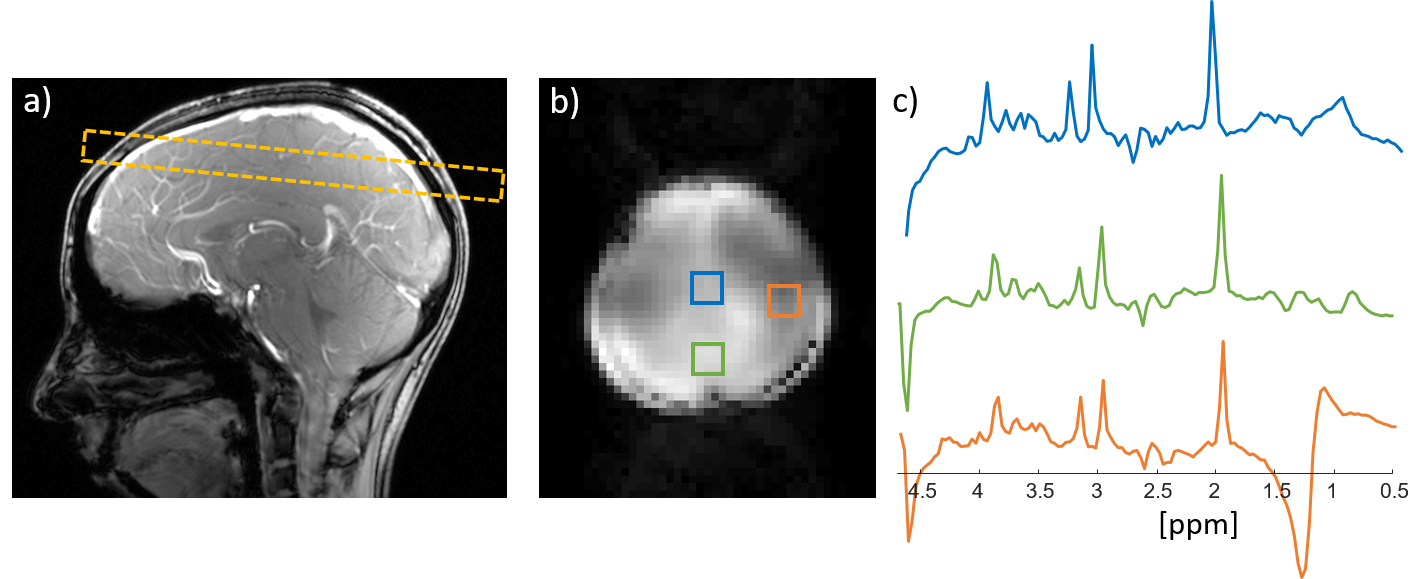
Fig. 2 compares single-segment COKE and EPSI, demonstrating that the COKE version can provide a full spectrum without ghosting artifacts following a navigator-based even/odd phase correction11. Fig. 3 shows summed spectra from three human brain regions (5x5 voxels, 0.3mL per voxel). The spectra demonstrate well-resolved metabolite peaks, but are contaminated by signal from subcutaneous lipids. This contamination is partly caused by imperfect kx trajectories causing a ringing artefact in the readout direction of the image due to mismatch at the interfaces between readout segments. Fig. 4a shows that for a “brain” only compartment the 3-segment RS-EPSI and RS-COKE provide similar results without significant artifacts. Fig. 4b compares single-segment and three-segment acquisitions with a lipid layer. A ringing artefact can be observed in the three-segment water image. One method to reduce the ringing artifact is to apply saturation bands to reduce the lipid signal contribution, as shown in Fig.4b. It shows clear improvement of the metabolite spectra, however, the saturation bands also reduce the water suppression efficiency by a factor of four. Fig. 5 shows simulated results for an annulus-shaped object, considering only the first echo of each echo-train. In the current implementation, each readout segment is acquired at the same time point, relative to the excitation, resulting in phase discontinuities at segment interfaces for off-resonant signals. Such an acquisition can result in a ringing artifact when the annulus signal is off-resonance (Fig.5a). The simulation results in fig. 5b show how time-shifting the outer segments by ±echo-spacing removes the phase discontinuities and the off-resonance artifacts are suppressed. The much smaller residual ringing artifact probably corresponds to Gibbs ringing due to the low spatial resolution. Fig. 5d shows simulated data that demonstrate the effect of kx trajectory imperfections, which cause similar ringing artifacts, but which are not specific to off-resonant signals. In practice, these artifacts are minimised by empirically scaling the readout gradients to improve the continuity of the kx trajectory at segment interfaces.Conclusion
The readout-segmented COKE method allows fast spectroscopic imaging and high spatial resolution for human application at 7T. The method is capable of removing the spectral-width limitation at 7T and provides a coherent phase evolution that avoids Nyquist artefacts in the spectra. However, before the method can be used for routine studies in vivo, further work is required to minimize the effect of lipid contamination on the readout-segmented spatial encoding scheme. The phantom experiments and simulations in this study have led to an increased understanding of these artifacts and provided potential mitigations that can be explored in future work.Acknowledgements
No acknowledgement found.References
[1] Mansfield, MRM 1984; [2] Posse et.al, MRM 1997; [3] Lin et.al, MRM 2007; [4] Posse et.al JMRI 2013; [5] Keith et al, ISMRM 2019; [6] Schmidt et al MRM 2019; [7] Webb et.al, MRM 1989; [8] Keith et al, ESMRMB 2020 [9] Tkac, MRM 1999; [10]Connolly MRM 1991; [11] Chen. et. Al, MRM 2004; [12] Jona et. al, NMR BioMed 2020.Figures
Figure
1: Schematic
diagram of the readout-segmented COKE (Consistent k-t space EPSI) pulse
sequence. The odd/even excitations are marked differently as shown in the
legend. Nseg and NPE are the number of readout segments
and PE lines, respectively.
Figure
2: Comparison
of EPSI vs COKE (single segment). a) EPSI image and spectrum, b) COKE image
before and after even/odd correction and spectrum. The spectrum is from a 5x5
box in the center of the image. EPSI and COKE scan parameters were TR/TE 2000/35
ms, FOV and thickness 200x200x15 mm3,
spatial resolution 40x32 points, frequency resolution 1.2 Hz, echo spacing 0.36
ms, SW =1389 Hz for EPSI odd-only and 2778 Hz for full EPSI and COKE, single
average. Scan duration 1:20 minutes.
Figure
3: Human
scan results. a) Reference image with the scan location, b) water image with
the same parameters as the spectroscopic imaging scan. c) 1H spectra
at three regions shown in b). The scan parameters are described in the main
text.
Figure
4: 3D-shaped
phantom imaging a) RS-EPSI versus RS-COKE with 3 readout segments with the “brain only” phantom. Images show water and
NAA maps and the spectrum for the central box (5x5 pixels). b) 3D-shaped
phantom including brain-like compounds and a
superficial compartment with a lipid-like compound. The slice location is
shown by blue overlay. Images compare single and 3-segment water images, a
3-segment acquisition with water suppression, and a 3-segment acquisition with
both water suppression and three saturation bands. Sequence parameters are given in the main text.
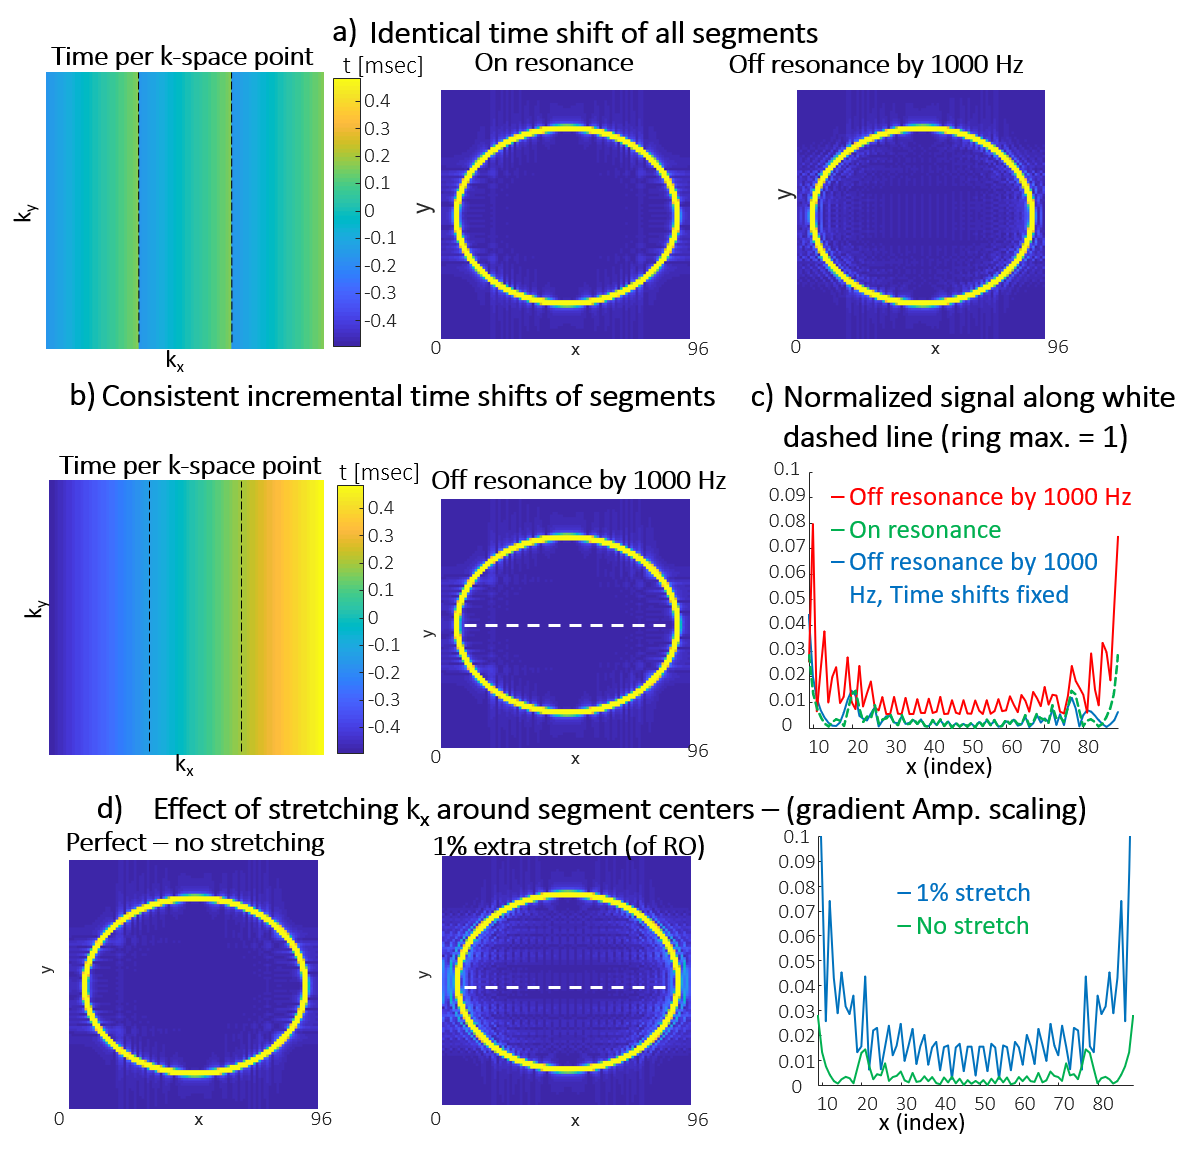
Figure 5: Simulation of an annulus mimicking the lipid layer of the brain. a) Acquisition with each segment acquired at
the same time point relative to excitation, both on- and off-resonance
(off-resonance mimics lipid signal). b) Acquisition with
incremental time-shifts of the segments (N ∙ echo-spacing) to achieve continuous temporal evolution for each 3-segment line. C) Signal ringing at the
center of the ring for cases a) and b). d) Effect of scaling the RO
amplitude (but not prephasers), a stretching that can occur between the
segments.