2205
Simultaneous spectral and bi-exponential diffusion modeling of doubly motion-corrected human brain spectra with very high b-values
Kadir Şimşek1, André Döring1,2, André Pampel3, Harald E. Möller3, and Roland Kreis1
1Department of Radiology and Biomedical Research, University of Bern, Bern, Switzerland, 2Cardiff University Brain Research Imaging Centre (CUBRIC), School of Psychology, Cardiff University, Cardiff, United Kingdom, 3Max-Planck Institution for Human Cognitive and Brain Sciences, Leipzig, Germany
1Department of Radiology and Biomedical Research, University of Bern, Bern, Switzerland, 2Cardiff University Brain Research Imaging Centre (CUBRIC), School of Psychology, Cardiff University, Cardiff, United Kingdom, 3Max-Planck Institution for Human Cognitive and Brain Sciences, Leipzig, Germany
Synopsis
Diffusion-weighted MRS was successfully applied at short TE with ultra-high b-values on a 3T Siemens Connectom system. Additional motion compensation based on macromolecule signals was implemented to complement water-signal-based motion compensation, especially at high b-values. By extending simultaneous fitting of interrelated datasets to a biexponential diffusion model, non-Gaussian diffusion behavior of metabolites can be established in a more rigorous fashion. Finally, also the definition of macromolecular background signals by diffusion rather than relaxation properties benefits from these more robust methods and the patterns can now be used as bases for quantification in clinical studies at short-TE.
Introduction
Diffusion-weighted Magnetic Resonance Spectroscopy (DW-MRS) extends DW-MRI to explore human brain microstructure with celltype-specific information. However, DW-MRS suffers from lower SNR and the need for higher b-values to reach similar diffusion-weighting as for water. Motion-related signal decay must be accounted for and maximal prior-knowledge implementation in fitting is beneficial. Water-signal-based motion correction1,2 is insufficient at very high b-values. At short TE, macromolecule (MM) signals have been used as reference in rodent brain based on their very slow diffusivity3. Here, we show their effective use in human brain.Metabolite signal decay has been reported to show biexponential behavior in animal4 and human brain2. Simultaneous fitting of series of interrelated spectra has been shown to be beneficial for multiple scenarios5–7. For diffusion-weighting, this approach has been limited to monoexponential signal decay. Here, we extend the model to biexponential behavior, combine with MM-related motion compensation, and compare with previous approaches.
Finally, using ultra-high DW allows determination of the MM signal for quantification of clinical MR spectra based on diffusion rather than relaxation characteristics[2,8,9]. Here, we use the above outlined approaches to define the short-TE MM spectral pattern using human brain spectra acquired on a Connectom system.
Methods
Siemens 3T Connectom system (300mT/m) and 32-channel headcoil. STEAM localization (TE=30ms, TM=35/65ms) with metabolite-cycling (MC) for simultaneous acquisition of water and metabolite data. Peripheral pulse-triggering. Diffusion-weighting optimized for highest achievable b-values within the peripheral nerve stimulation limits2, for diffusion times of 50/80ms reaching 10.7/25.1 ms/µm2 with gradient strengths of 117/140mT/m on all axes. Data recorded in 12 subjects from a VOI of 13-35cm3 in occipito-parietal cortex.Spectra processed in jmrui, matlab and python; fitting in FiTAID5,6. Eddy-current, phase and frequency corrections performed using the co-acquired water signal. The effective repetition time was recorded and the water signal corrected for varying T1-saturation (due to varying cardiac rate) in the determination of the motion-compensation (MoCom) reference level1,2.
Following MoCom and before fitting, remaining spurious signal decays were corrected for each spectrum based on the signal of the 0.9ppm MM-peak (MM0.9). This signal was obtained from independent fits at each b-value and put in relation to the expected signal based on the mono-exponential diffusion decay found for this resonance in an initial fit of the cohort data from subjects without evident artifactual decay (ADCMM=8.6x10⁻³µm2/ms).
Simultaneous fitting of the spectra from all b-values was performed twice:
Free-Fit: without an enforced diffusion decay model (independent signal amplitudes at all b-values that were subsequently fitted to mono- and biexponential decays).
Biexp-Fit: with a biexponential decay model for the most prominent metabolites and a mono-exponential model for the smaller contributors and the MM. The biexponential model was implemented as sum of two mono-exponential components with identical base-spectrum per respective metabolite.
Prior-knowledge restraints in place for some fit variables.
Results & Discussion
Plain MoCom was illustrated previously2. The need for an additional correction is presented in Fig-1 showing signal intensities for MM0.9 in relation to the cohort-averaged signal decay for multiple subjects. The effect of the correction based on MM0.9 is illustrated in Fig-2, also presenting the cohort averaged spectra after all corrections.Fig-3 juxtaposes the diffusion decays found for some of the metabolites in the cohort average using different modeling schemes. For some metabolites, the fitted bi-exponential decays seem to be identical for free area fitting with subsequent modeling (Free-Fit) and for simultaneous modeling (Biexp-Fit), while for others the two approaches show quite distinct diffusion characteristics (Glu, Gln, Tau). Free-Fit data also includes the resulting mono-exponential fit curves visualizing the clear biexponential character for some of the entities (water, NAA, Glu), while some show very little deviation from Gaussian diffusion (Cho, Tau). The spectral fits for two b-values in Fig-3b present the respective fit-quality in both models, where residuals are expected to be larger in Biexp-Fit because of the many additional degrees of freedom in Free-Fit. However, this is not evident in the model fits at all.
Table-1 lists some resulting ADCs and relative diffusion compartment sizes in comparison to rodent literature9, which matches well in part only.
Finally, Fig-4 presents the resulting MM spectral patterns resulting from the currently described modeling in comparison to the MM background signal obtained without MM-correction and a Free-Fit approach2.
Conclusion
- Using the MM0.9 peak area for additional elimination of artefactual signal loss at high b-values on top of the water-based MoCom made the method more robust and its effect is evident from the slower ADC found for MM in this approach (ADCMM=0.009µm2/ms) compared to the one found without it (0.019µm2/ms)2.
- Simultaneous spectral-biexponential fitting clearly confirmed the non-monoexponential diffusion of multiple metabolites in agreement with short-TE rodent9 and long-TE human data10. Simultaneous fitting stabilizes the fit results in low-SNR spectra and the new model allows to do so also for a complex biexponential fit model increasing robustness.
- Comparison with short TE rodent data for ADCs and fractional components shows good correlation for some metabolites but clear divergence for others, which calls for further investigation.
- The new method also allows a better definition of the MM background since the metabolite residues at high b are better defined from the overall fit then with individual fits.
Acknowledgements
Supported by the Swiss National Science Foundation (SNSF #320030‐175984).References
- Döring, A., Adalid, V., Boesch, C. & Kreis, R. Diffusion-weighted magnetic resonance spectroscopy boosted by simultaneously acquired water reference signals. Magn. Reson. Med. 80, 2326–2338 (2018).
- Şimşek, K., Döring, A., Pampel, A., Möller, H. E. & Kreis, R. Diffusion-weighted MRS at short TE using a Connectom system : non-Gaussian metabolite diffusion and macromolecular signals in human brain. Proc. Intl. Soc. Mag. Reson. Med. 28 #0364 (2020).
- Ligneul, C. Probing metabolite diffusion at ultra ‐ short time scales in the mouse brain using optimized oscillating gradients and “ short ”‐ echo ‐ time diffusion ‐ weighted MRS. NMR Biomed. 30, e3671 (2017).
- Palombo, M., Shemesh, N., Ronen, I. & Valette, J. Insights into brain microstructure from in vivo DW-MRS. Neuroimage 182, 97–116 (2018).
- Chong, D. G. Q., Kreis, R., Bolliger, C. S. & Boesch, C. Two-dimensional linear-combination model fitting of magnetic resonance spectra to define the macromolecule baseline using FiTAID , a Fitting Tool for Arrays of Interrelated Datasets. Magn. Reson. Mater. Physics, Biol. Med. 24, 147–164 (2011).
- Adalid, V., Döring, A. & Kyathanahally, S. P. Fitting interrelated datasets : metabolite diffusion and general lineshapes. Magn. Reson. Med. 30, 429–448 (2017).
- Hoefemann, M., Bolliger, C. S., Kreis, R., Chong, D. G. Q. & van der Veen, J. W. Parameterization of metabolite and macromolecule contributions in interrelated MR spectra of human brain using multidimensional modeling. NMR Biomed. 33, e4328 (2020).
- Kunz, N. et al. Diffusion-Weighted Spectroscopy : A Novel Approach to Determine Macromolecule Resonances in Short-Echo Time 1 H-MRS. Magn. Reson. Med. 64, 939–946 (2010).
- Ligneul, C., Palombo, M. & Valette, J. Metabolite Diffusion up to Very High b in the Mouse Brain In Vivo : Revisiting the Potential Correlation Between Relaxation and Diffusion Properties Cl. Magn. Reson. Med. 77, 1390–1398 (2017).
- Ingo, C., Brink, W., Ercan, E., Webb, A. G. & Ronen, I. Studying neurons and glia non-invasively via anomalous subdiffusion of intracellular metabolites. Brain Struct. Funct. 223, 3841–3854 (2018).
Figures
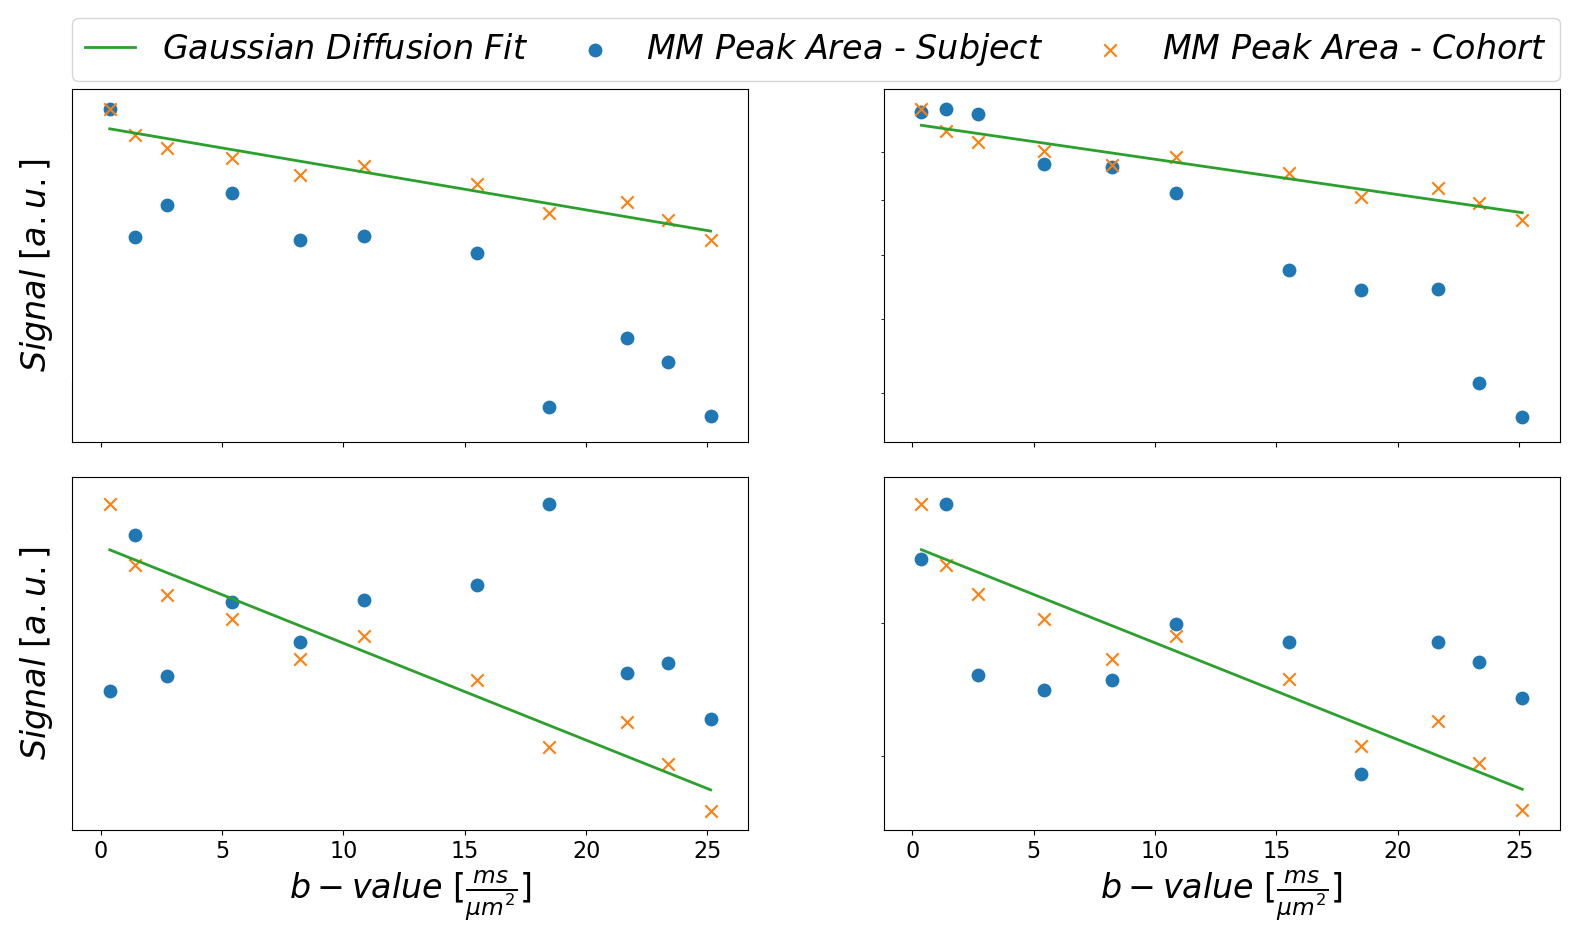
Fig. 1: Illustration
to motivate the need for the MM peak-based signal correction. For multiple
subjects, the peak areas of MM0.9 are plotted in relation to the monoexponential
decay fit for the cohort data from subjects without apparent strong artifactual
signal decay. Subject 2 shows systematic additional signal decay with higher
b-values on top of the MM diffusion effect, while subjects 1 and 3 show strong random
fluctuations.
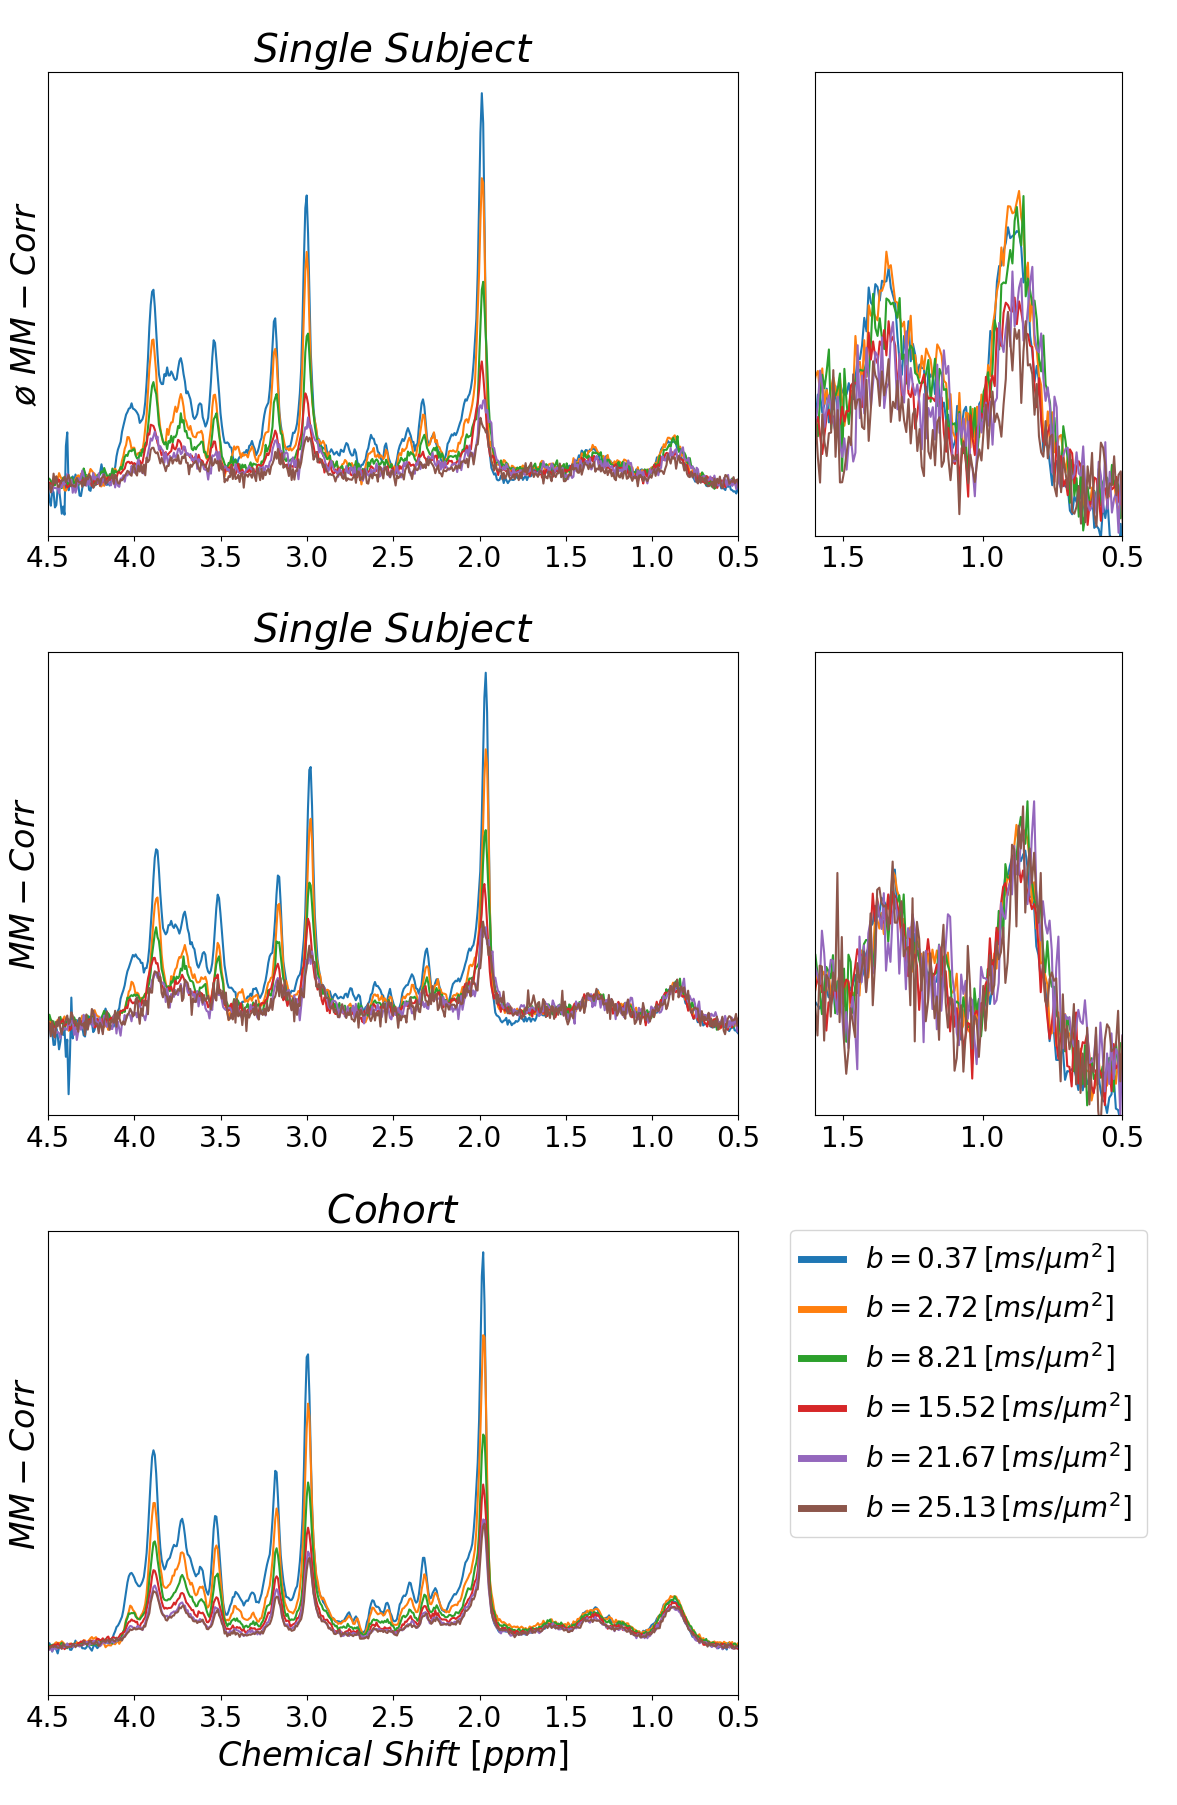
Fig. 2:
Illustration of effect of signal correction using the MM peak at 0.9 ppm on top
of water-based MoCOM. Sample spectra from multiple b-values obtained from a
single subject before (top) and after (mid) MM peak-based correction are
presented. The zoomed plot illustrates also that SNR is sufficient to reliably
determine the correction factor using M0.9 in single subject data even at
highest b-values. The lowest trace shows the averaged data for a cohort of 12
subjects after MoCom and MM-based motion correction (ADCMM=8.6 x10⁻³ µm2/ms).
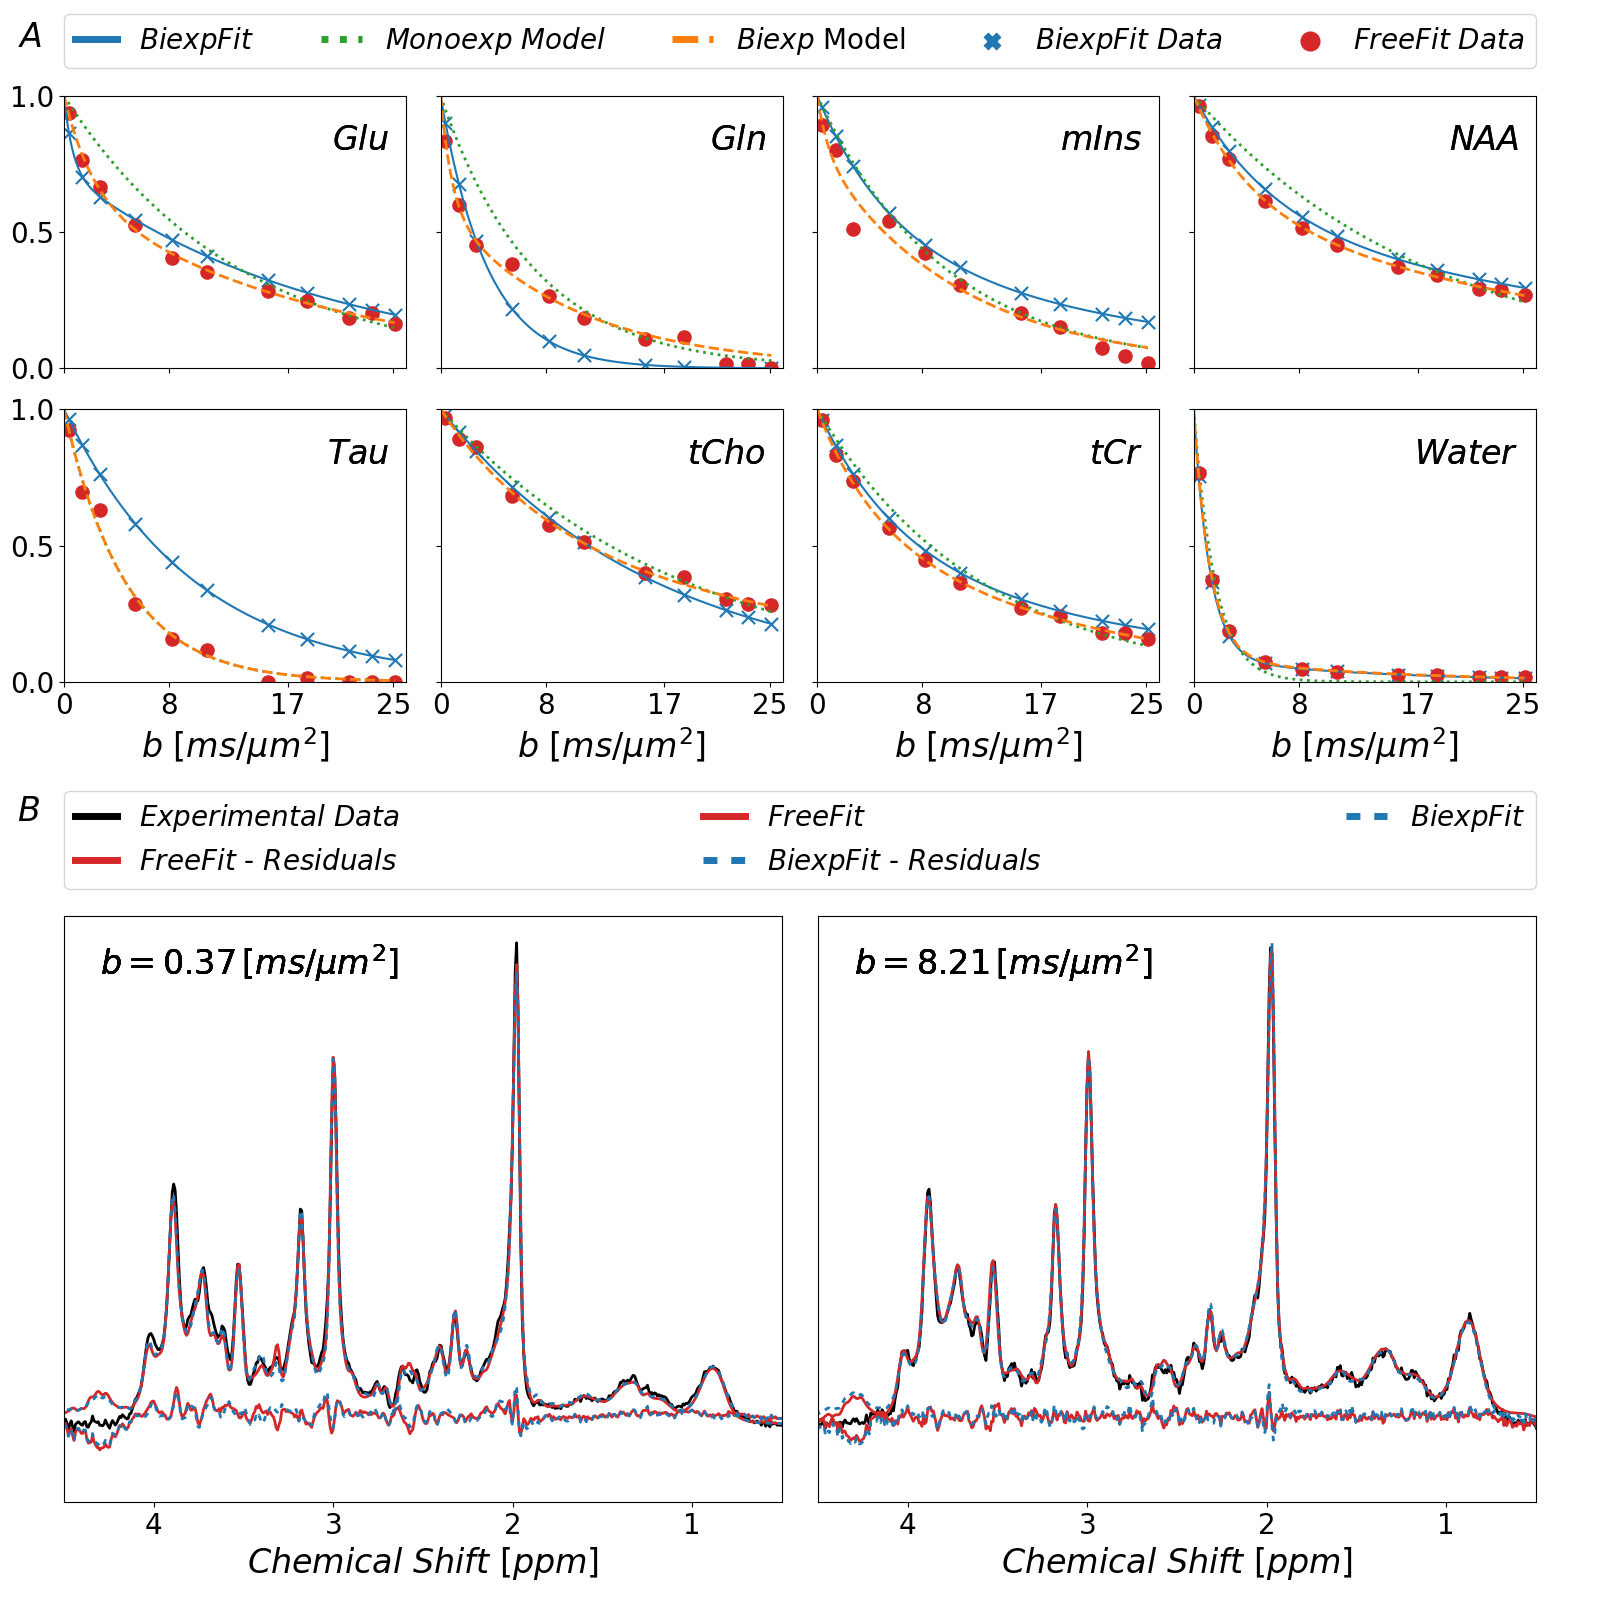
Fig.3: Fitted
diffusion decays as obtained with the different approaches described in the
text. Free-Fit data was modeled as mono- and biexponential decay. Biexp-Fit
(blue) is consistent for some metabolites but shows diverging results for
others. The non-Gaussian nature of diffusion is evident in both approaches for most
metabolites. At the bottom, spectra with the fits from Free-Fit as well as
Biexp-Fit are shown documenting how small the differences are even though the
decay function seem to differ substantially for some metabolites. (blue: Biexp-Fit;
red; Free-Fit)
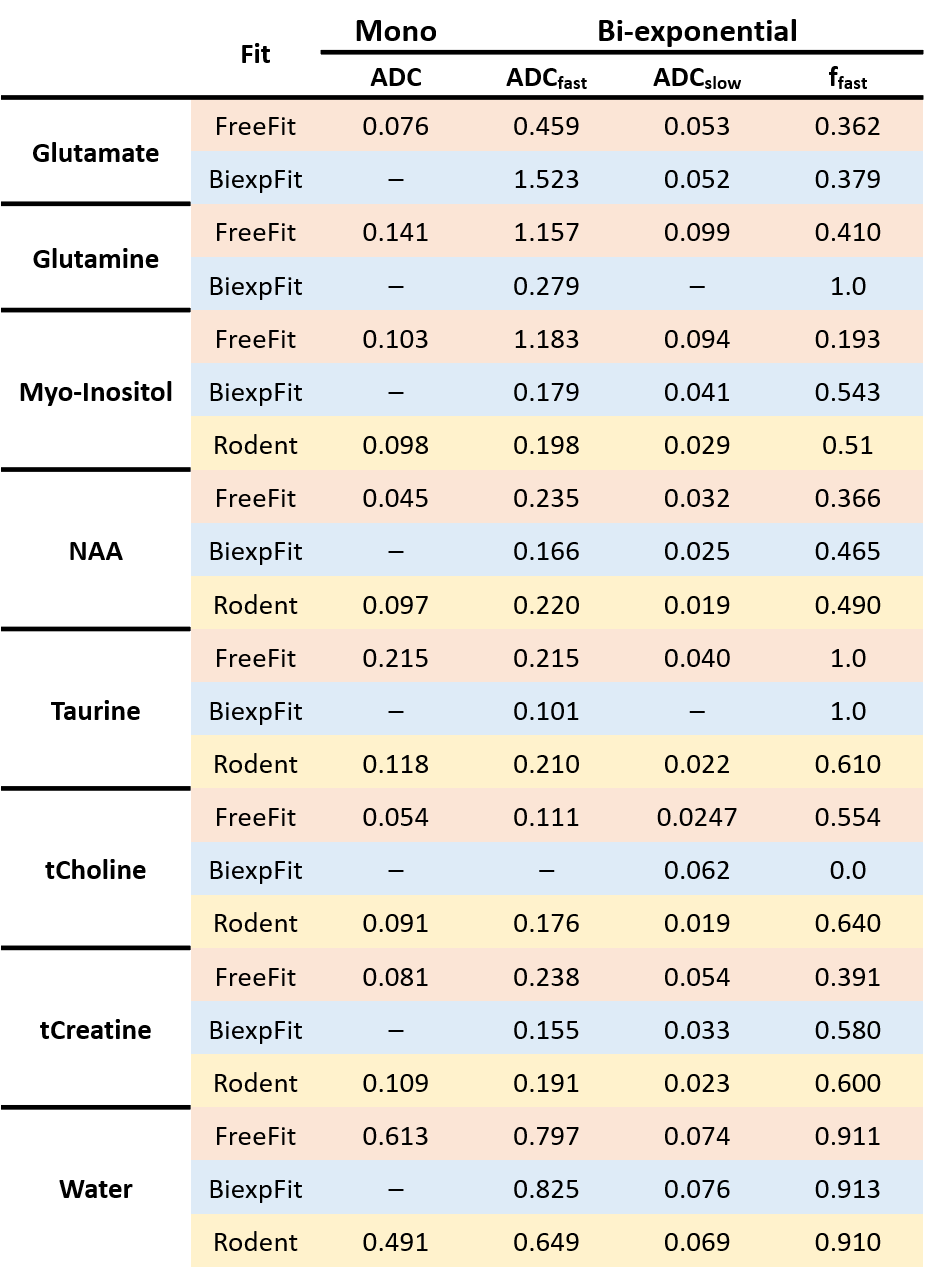
Table 1: Numeric
fit results in terms of the ADCs of both fitted components for biexponential
signal decay and the relative fraction of the fast-diffusing component in
comparison to equivalent data from rodent brain9 and the monoexponential fit results from Free-Fit. The numbers
confirm the visual differences seen in Fig-3.
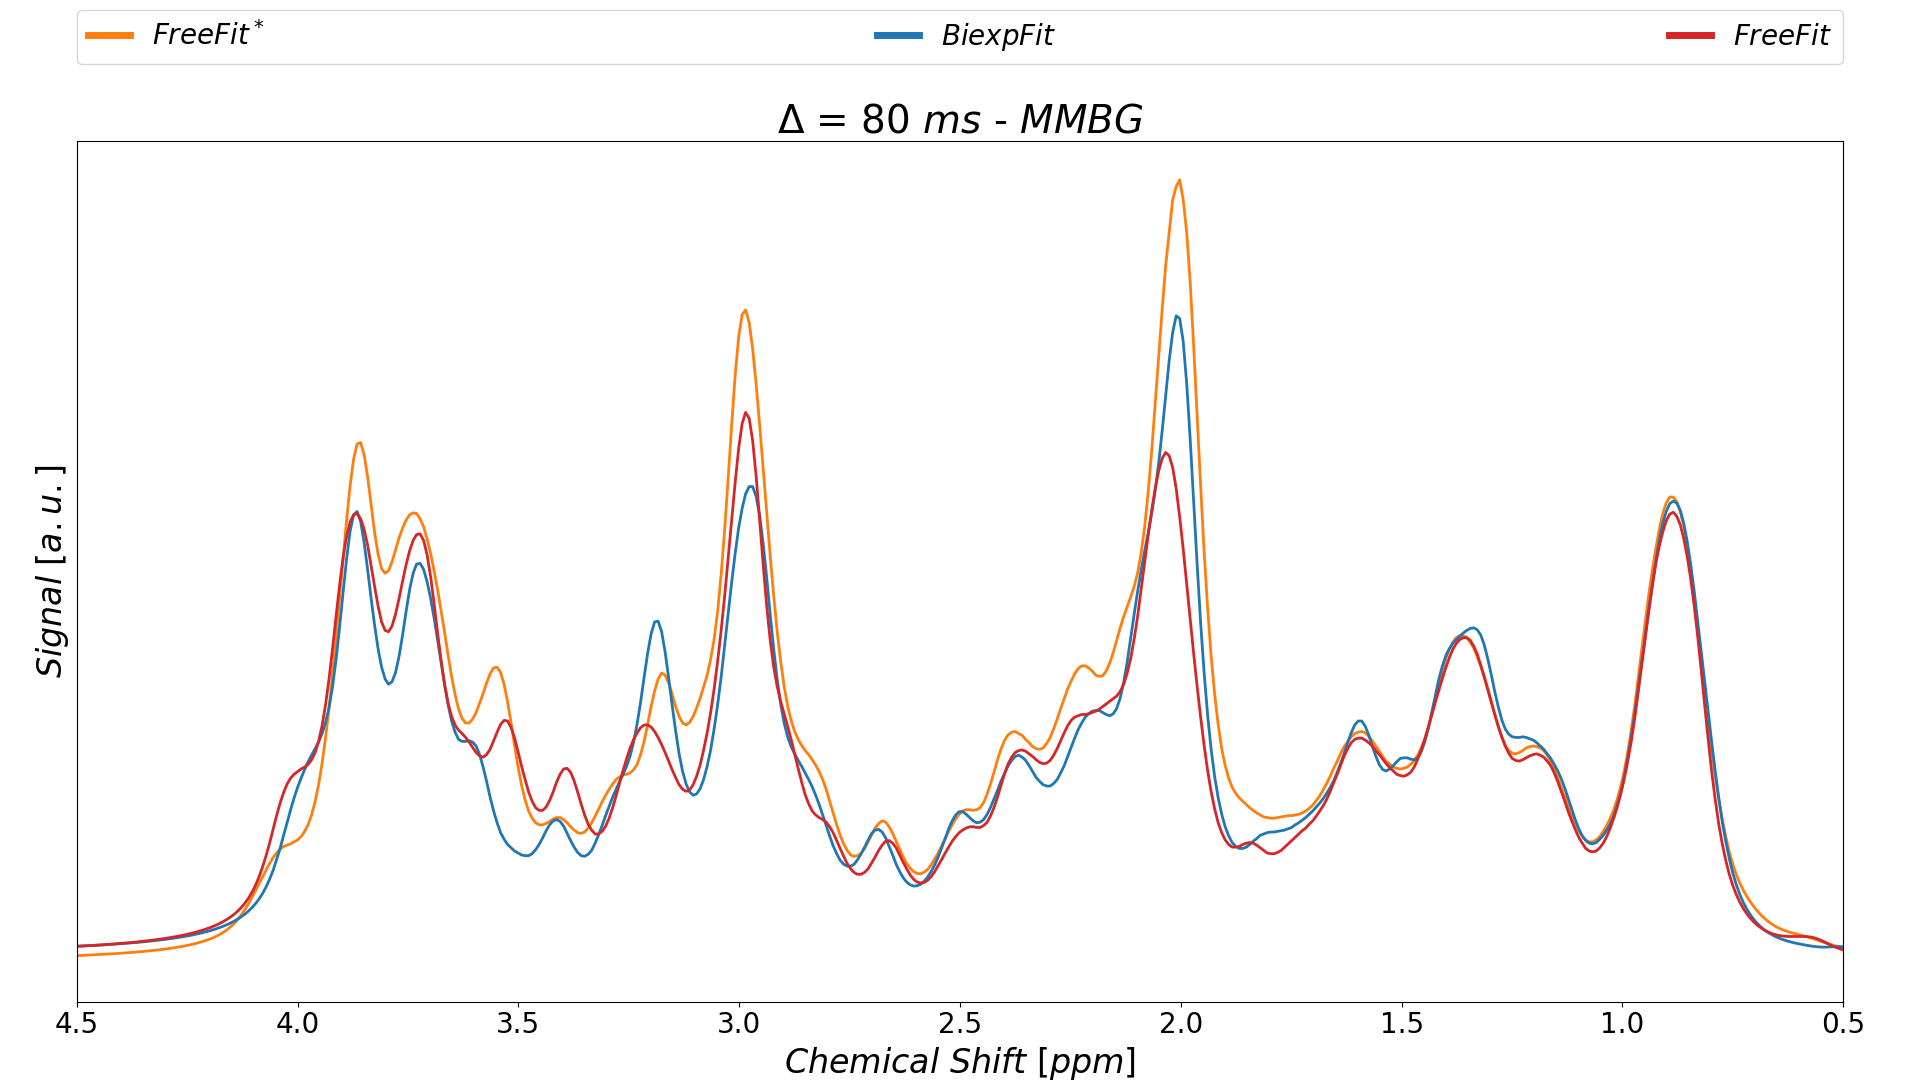
Fig.4: MMBG spectra extracted from both fitting
strategies at Δ=80
ms contrasted with the previous result that had neither made use of the MM-Corr
scheme nor the simultaneous spectral biexponential fit model for metabolites.
The type of modeling and pretreatment has a clear effect on the pattern of the
resulting MM background.