2203
Sleep-Wake Lactate Dynamics in Human Brain1Advanced Imaging Research Center, Oregon Health & Science University, Portland, OR, United States, 2Department of Neurology, Oregon Health & Science University, Portland, OR, United States, 3VA Portland Health Care System, Portland, OR, United States, 4Department of Medicine, Division of Pulmonary and Critical Care Medicine, Oregon Health & Science University, Portland, OR, United States, 5Department of Behavioral Neuroscience, Oregon Health & Science University, Portland, OR, United States, 6Oregon Institute of Occupational Health Sciences;, Oregon Health & Science University, Portland, OR, United States, 7BENFRA Botanical Dietary Supplements Research Center, Oregon Health & Science University, Portland, OR, United States, 8Department of Biostatistics, University of Alabama, Birmingham, AL, United States, 9Department of Anesthesiology and Perioperative Medicine, Oregon Health & Science University, Portland, OR, United States, 10Knight Cardiovascular Institute, Oregon Health & Science University, Portland, OR, United States, 11VISN 20 Mental Illness Research, Education and Clinical Center (MIRECC), VA Puget Sound Health Care System, Seattle, WA, United States, 12Department of Psychiatry and Behavioral Sciences, University of Washington, Seattle, WA, United States, 13Department of Neurology, University of Washington, Seattle, WA, United States
Synopsis
This study describes a non-invasive combined magnetic resonance spectroscopy and polysomnography approach to measure brain metabolite levels together with simultaneous characterization of sleep or wake states. The results provide the first in-vivo demonstration of reductions in brain lactate concentration and diffusivity during sleep versus wakefulness in young healthy human brain. These findings are consistent with invasive small-animal studies showing the loss of extracellular lactate during sleep, and support the notion of altered lactate metabolism and/or increased glymphatic activity in sleeping human brain.
Purpose
The purpose of this study is to investigate cerebral lactate concentration across natural sleep-wake cycles and evaluate the potential mechanisms associated with any alterations in lactate.Methods
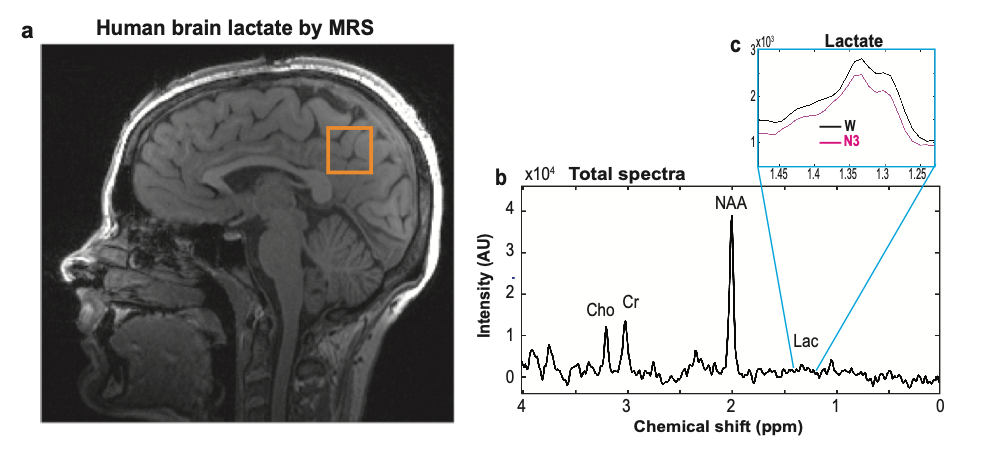
Nine subjects (four females, five males; mean age 24.2 (±2; SD) years; age range: 21-27 years) were included. Subjects were sleep deprived overnight and underwent early morning simultaneous MR-spectroscopy (MRS) and polysomnography (PSG) measurements (electroencephalogram (EEG), electrooculography (EOG), electrocardiogram (ECG), respiration and 3D acceleration; Brain Products Inc, GmbH, Munich, Germany) in a 3 T MR instrument (Prisma, Siemens Healthcare, Erlangen, Germany) using a 64-channel head/neck coil.A single voxel 1H-MRS technique acquired signals for every 7.5 s (TR: 1875 ms; TE: 270 ms; 4 signal averages with phase cycling) from a volume of interest with an inter-subject range of 12-24 cm3 (Fig. 1a, 27 y female) for a total 1H-MRS time-series with inter-subject range of 88 – 140 min. Diffusion sensitized 1H-MRS data were acquired from 3 subjects on a separate visit. Diffusion weighting was achieved by simultaneously applying gradients along all three laboratory axes (d=25 ms, D=36.5 ms, b=500 s/mm2) prior to and after the initial refocusing pulse of the PRESS sequence. The diffusion weighting was interleaved with no diffusion weighting at every TR value of 1875 ms, resulting in a complete pair (diffusion and non-diffusion MRS) being acquired every 3750 ms.
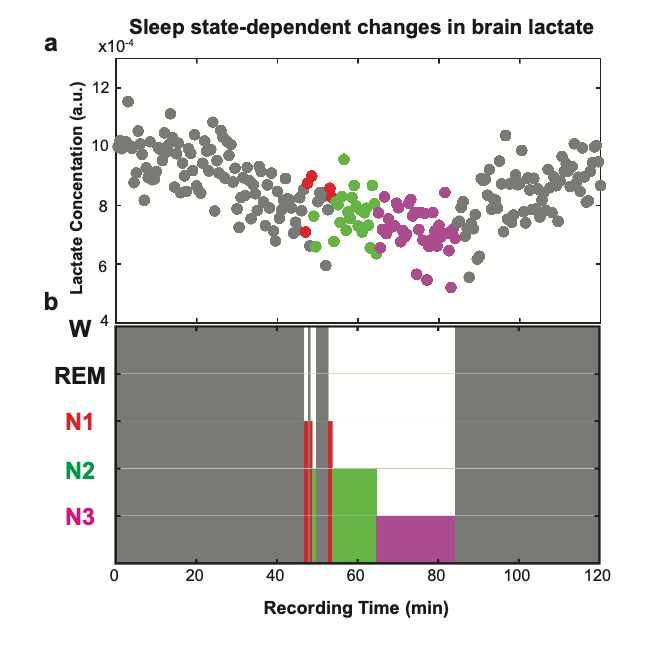
Lactate from each 7.5 s spectra (Fig. 1b) were i) determined from non-parametric signal integrals over a defined spectral range [1.23 - 1.48 ppm] (Fig. 1c), ii) normalized to corresponding water peak levels, and iii) averaged over 30 s for every 30 s of the simultaneous PSG recordings. After MR and cardioballistic data artifact correction, PSG recordings were visually evaluated and scored for each 30 s epoch using the standard criteria1 and classified into one of four stages i. wake (W), ii. non-REM sleep stage 1 (N1), iii. non-REM sleep stage 2 (N2), and iv. non-REM sleep stage 3 (N3).
Fig. 2 demonstrates a representative hypnogram depicting a single subject’s sleep stages and corresponding normalized lactate levels, which are lower during N3 compared to W, N1, and N2. To determine and compare mean lactate levels for each stage across the recording duration, we averaged lactate signals from 30 s spectra for each stage. When compared to W (86 min), normalized lactate levels were 4.6 % lower in N1 (2.5 min), 12.0 % in N2 (12 min), and 18.0 % in N3 (19.5 min). We then quantified group mean lactate for each stage across the subjects using LCModel. When compared to W, mean lactate levels within each sleep stage showed a reduction of [4.9 ± 4.9] % in N1, [10.4 ± 5.2] % in N2, and [24.0 ± 5.8] % in N3.
For lactate apparent diffusion coefficient (ADC) comparisons, we quantified lactate ADC by averaging across wake (W) and combined sleep stages (N1, N2, N3). We observed a significant decrease in lactate ADC accompanied by reduced brain lactate concentration in sleep compared to wake (P<0.002). There were no differences in ADC values between wake and sleep for H2O, NAA, tCr, or Cho.
Discussion
The combination of 1H MRS and PSG provided high quality quantifiable signals across several hours for each modality, and was safe and well-tolerated by all subjects. Substantial sleep durations in the scanner were realized by all study subjects with the majority experiencing prolonged N3 periods. The principal finding is a marked reduction in brain lactate concentration during sleep compared to wakefulness, with no change in NAA, tCr, or Cho signal levels. This observation is consistent with, and extends results from invasive small animal brain studies first reported more than 70 years ago.2 The effect sizes of our results are consistent with the previous rodent studies reporting reduced brain lactate levels during sleep compared to wakefulness (12-35 %).3-6Several mechanisms could explain decreased brain lactate during sleep versus wakefulness: i) lactate production relative to consumption is reduced during sleep, ii) lactate consumption relative to production is increased during sleep, or iii) lactate clearance from the brain is increased during sleep. The first two mechanisms are metabolic in nature, and the third is physiologic and consistent with the glymphatic hypothesis.2,7-10 While glucose is the brain’s preferred energy source under physiological conditions, there is compelling evidence that lactate can be the preferred fuel, particularly during intense neuronal activation, even when glucose is readily available.11 The reduced cerebral blood flow and metabolism observed in the sleeping brain, particularly during slow wave sleep (SWS),12 suggests that the reduction in brain lactate during SWS may result from reduced astroglial lactate production rather than an increase in neuronal metabolic demand. Selective reduction in lactate ADC suggests extracellular lactate concentration were reduced in sleep relative to wake.
Conclusion
In conclusion, we presented the first in-vivo evaluation of alterations in human brain lactate concentrations across sleep-wake cycles, which demonstrated that lactate levels decline during sleep relative to wakefulness, consistent with the previous rodent studies. Reduced lactate ADC values in sleep suggest a selective loss of lactate from the extracellular space. Further studies are required to elucidate mechanistic details associated with changes in lactate dynamics in human brain during sleep.Acknowledgements
This study was funded by The Paul. G. Allen Family Foundation.References
1. AASM Manual for the Scoring of Sleep and Associated Events: Rules, Terminology and Technical Specifications. American Academy of Sleep Medicine (2017).
2. Richter, D. & Dawson, R. M. Brain metabolism in emotional excitement and in sleep. Am J Physiol 154, 73-79 (1948).
3. Lundgaard, I. et al. Glymphatic clearance controls state-dependent changes in brain lactate concentration. J Cereb Blood Flow Metab 37, 2112-2124, doi:10.1177/0271678X16661202 (2017).
4. Cocks, J. A. Change in the concentration of lactic acid in the rat and hamster brain during natural sleep. Nature215, 1399-1400 (1967).
5. Van den Noort, S. & Brine, K. Effect of sleep on brain labile phosphates and metabolic rate. Am J Physiol 218, 1434-1439 (1970).
6. Shram, N., Netchiporouk, L. & Cespuglio, R. Lactate in the brain of the freely moving rat: voltammetric monitoring of the changes related to the sleep-wake states. European Journal of Neuroscience 16, 461-466, doi:10.1046/j.1460-9568.2002.02081.x (2002).
7. Iliff, J. J. et al. A paravascular pathway facilitates CSF flow through the brain parenchyma and the clearance of interstitial solutes, including amyloid beta. Sci Transl Med 4, 147ra111, doi:10.1126/scitranslmed.3003748 (2012).
8. Iliff, J. J. et al. Brain-wide pathway for waste clearance captured by contrast-enhanced MRI. J Clin Invest 123, 1299-1309, doi:10.1172/JCI67677 (2013).
9. Xie, L. et al. Sleep drives metabolite clearance from the adult brain. Science 342, 373-377, doi:10.1126/science.1241224 (2013).
10. Kiviniemi, V. et al. Ultra-fast magnetic resonance encephalography of physiological brain activity - Glymphatic pulsation mechanisms? J Cereb Blood Flow Metab 36, 1033-1045, doi:10.1177/0271678X15622047 (2016).
11. Gladden, L. B. Lactate metabolism: a new paradigm for the third millennium. J Physiol 558, 5-30, doi:10.1113/jphysiol.2003.058701 (2004).
12. Madsen, P. L. et al. Cerebral O2 metabolism and cerebral blood flow in humans during deep and rapid-eye-movement sleep. J Appl Physiol (1985) 70, 2597-2601 (1991).
Figures