2201
Spectral quality of J-refocused spectroscopic imaging at 7T1Radiology, University of Pittsburgh, Pittsburgh, PA, United States, 2university of pittsburgh, pittsburgh, PA, United States, 3University of Pittsburgh, Pittsburgh, PA, United States, 4Radiiology, Duke University, Durham, NC, United States, 5Neurology, University of Pittsburgh, Pittsburgh, PA, United States
Synopsis
The J-refocused double spin echo sequence is applied at 7T using the 8x2 transceiver and demonstrated in the frontal-parietal and temporal lobe regions. Spectral quality parameters based on the Cramer Rao lower bound, linewidth and SNR are calculated and considered for multiplet and singlet compounds, finding that the variance in highly overlapped compounds such as myo-Inositol are more steeply dependent on spectral uncertainty compared with singlet compounds. With fast encoding methods, the J-refocused acquisition is achieved in clinically acceptable imaging times (<3min, single slice) and can detect abnormalities in Glutamine in brain tumor patients.
Introduction
We have previously described the J-refocused double spin echo sequence at 7T, which is advantageous for its retention of coupled spins through longer echo times [1]. In this abstract we further develop this acquisition using an 8x2 transceiver to acquire studies from the frontal-parietal and temporal lobes and characterize its performance evaluating the relationship between the LCM-calculated CRLBk % and ξk=√LW/SNRk, this reflecting the consistency of the spectral basis model with the experimental data. To take advantage of the high SNR available at 7T, this work is performed using fast MRSI trajectories to reduce whole slice acquisition times to clinically relevant timeframes (<3min) and is demonstrated for the robust evaluation of tumor progression in patients with brain tumors.Methods
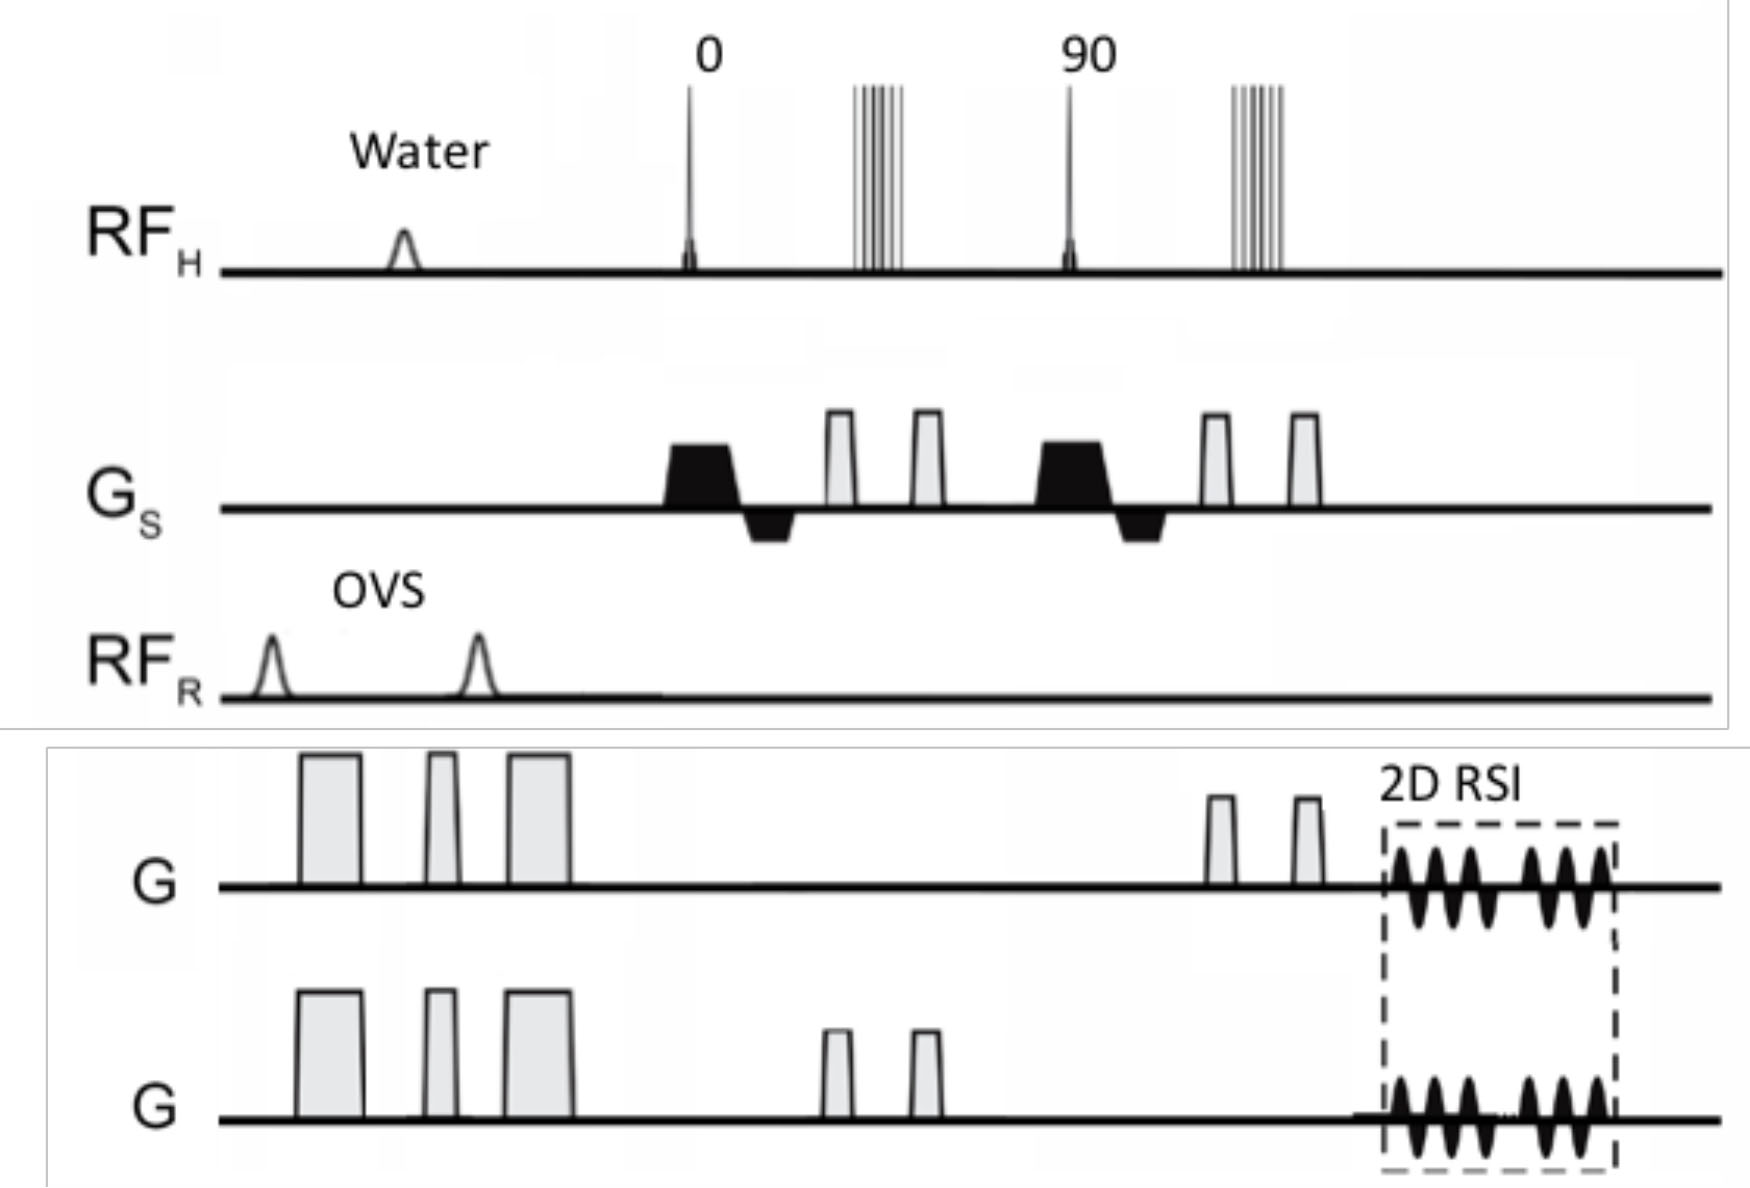
All data were acquired with a Siemens 7T Magnetom 8 channel pTx system with an 8x2 transceiver using two B1+ distributions including: a homogeneous B1+distribution targeting the entire intracranial volume (17.6uT B1+with <15%SD over the entire head) and a ring distribution targeting suppression of extracerebral tissues [3]. The B1+performance of the transceiver is particularly important for the J-refocused sequence (Fig. 1) given the high B1+ dependence of the sequence (>sin5Θ dependence; Θ is the applied excitation angle). Non-iterative B0 shimming was performed using a very high order shim insert (Resonance Research Inc.) providing 1st-4th order shims and two 5th order shims, achieving whole slice (all intracerebral tissue) homogeneity of 4-5Hz in the frontal parietal region and 15-20Hz over the temporal slice [4]. The spectroscopic image was spatially encoded using a circular rosette trajectory with two temporal interleaves and reconstructed as previously described [5] (spectral bandwidth of 2500Hz, Gmax 5.5mT/m; Smax 40.2mT/m/ms). The matched scout images were used to weight and phase correct the data prior to coil recombination. The single slice control studies (2.2min duration) were acquired with TE/TR of 34/1500ms and 88 shots.Spectral analysis was performed using LCM with tissue classification based on MP2RAGE images. A bandwidth of 1.8 to 6.6ppm (omitting the water region) was analyzed using 14 compound basis functions (NAA, NAG, aspartate, creatine CRE, GABA, glucose, glutamate GLU, glutamine GLN, glutathione, glycerophosphorylcholine, phosphorylcholine, myo-inositol INS, lactate and taurine) calculated from GAMMA simulations incorporating the semi-selective refocusing profile. SNR was determined directly from the peak-to-peak amplitude/standard deviation of the downfield 150 spectral points from the residual spectrum; linewidth determined by LCM. CRLB % values of >900% were rejected. N=5 control subjects were each studied from the frontal-parietal lobes and medial temporal lobe region, n=3 brain tumor subjects studied, targeting their lesions. The tumor studies were performed with 112 shots, 2.8min duration.
Results
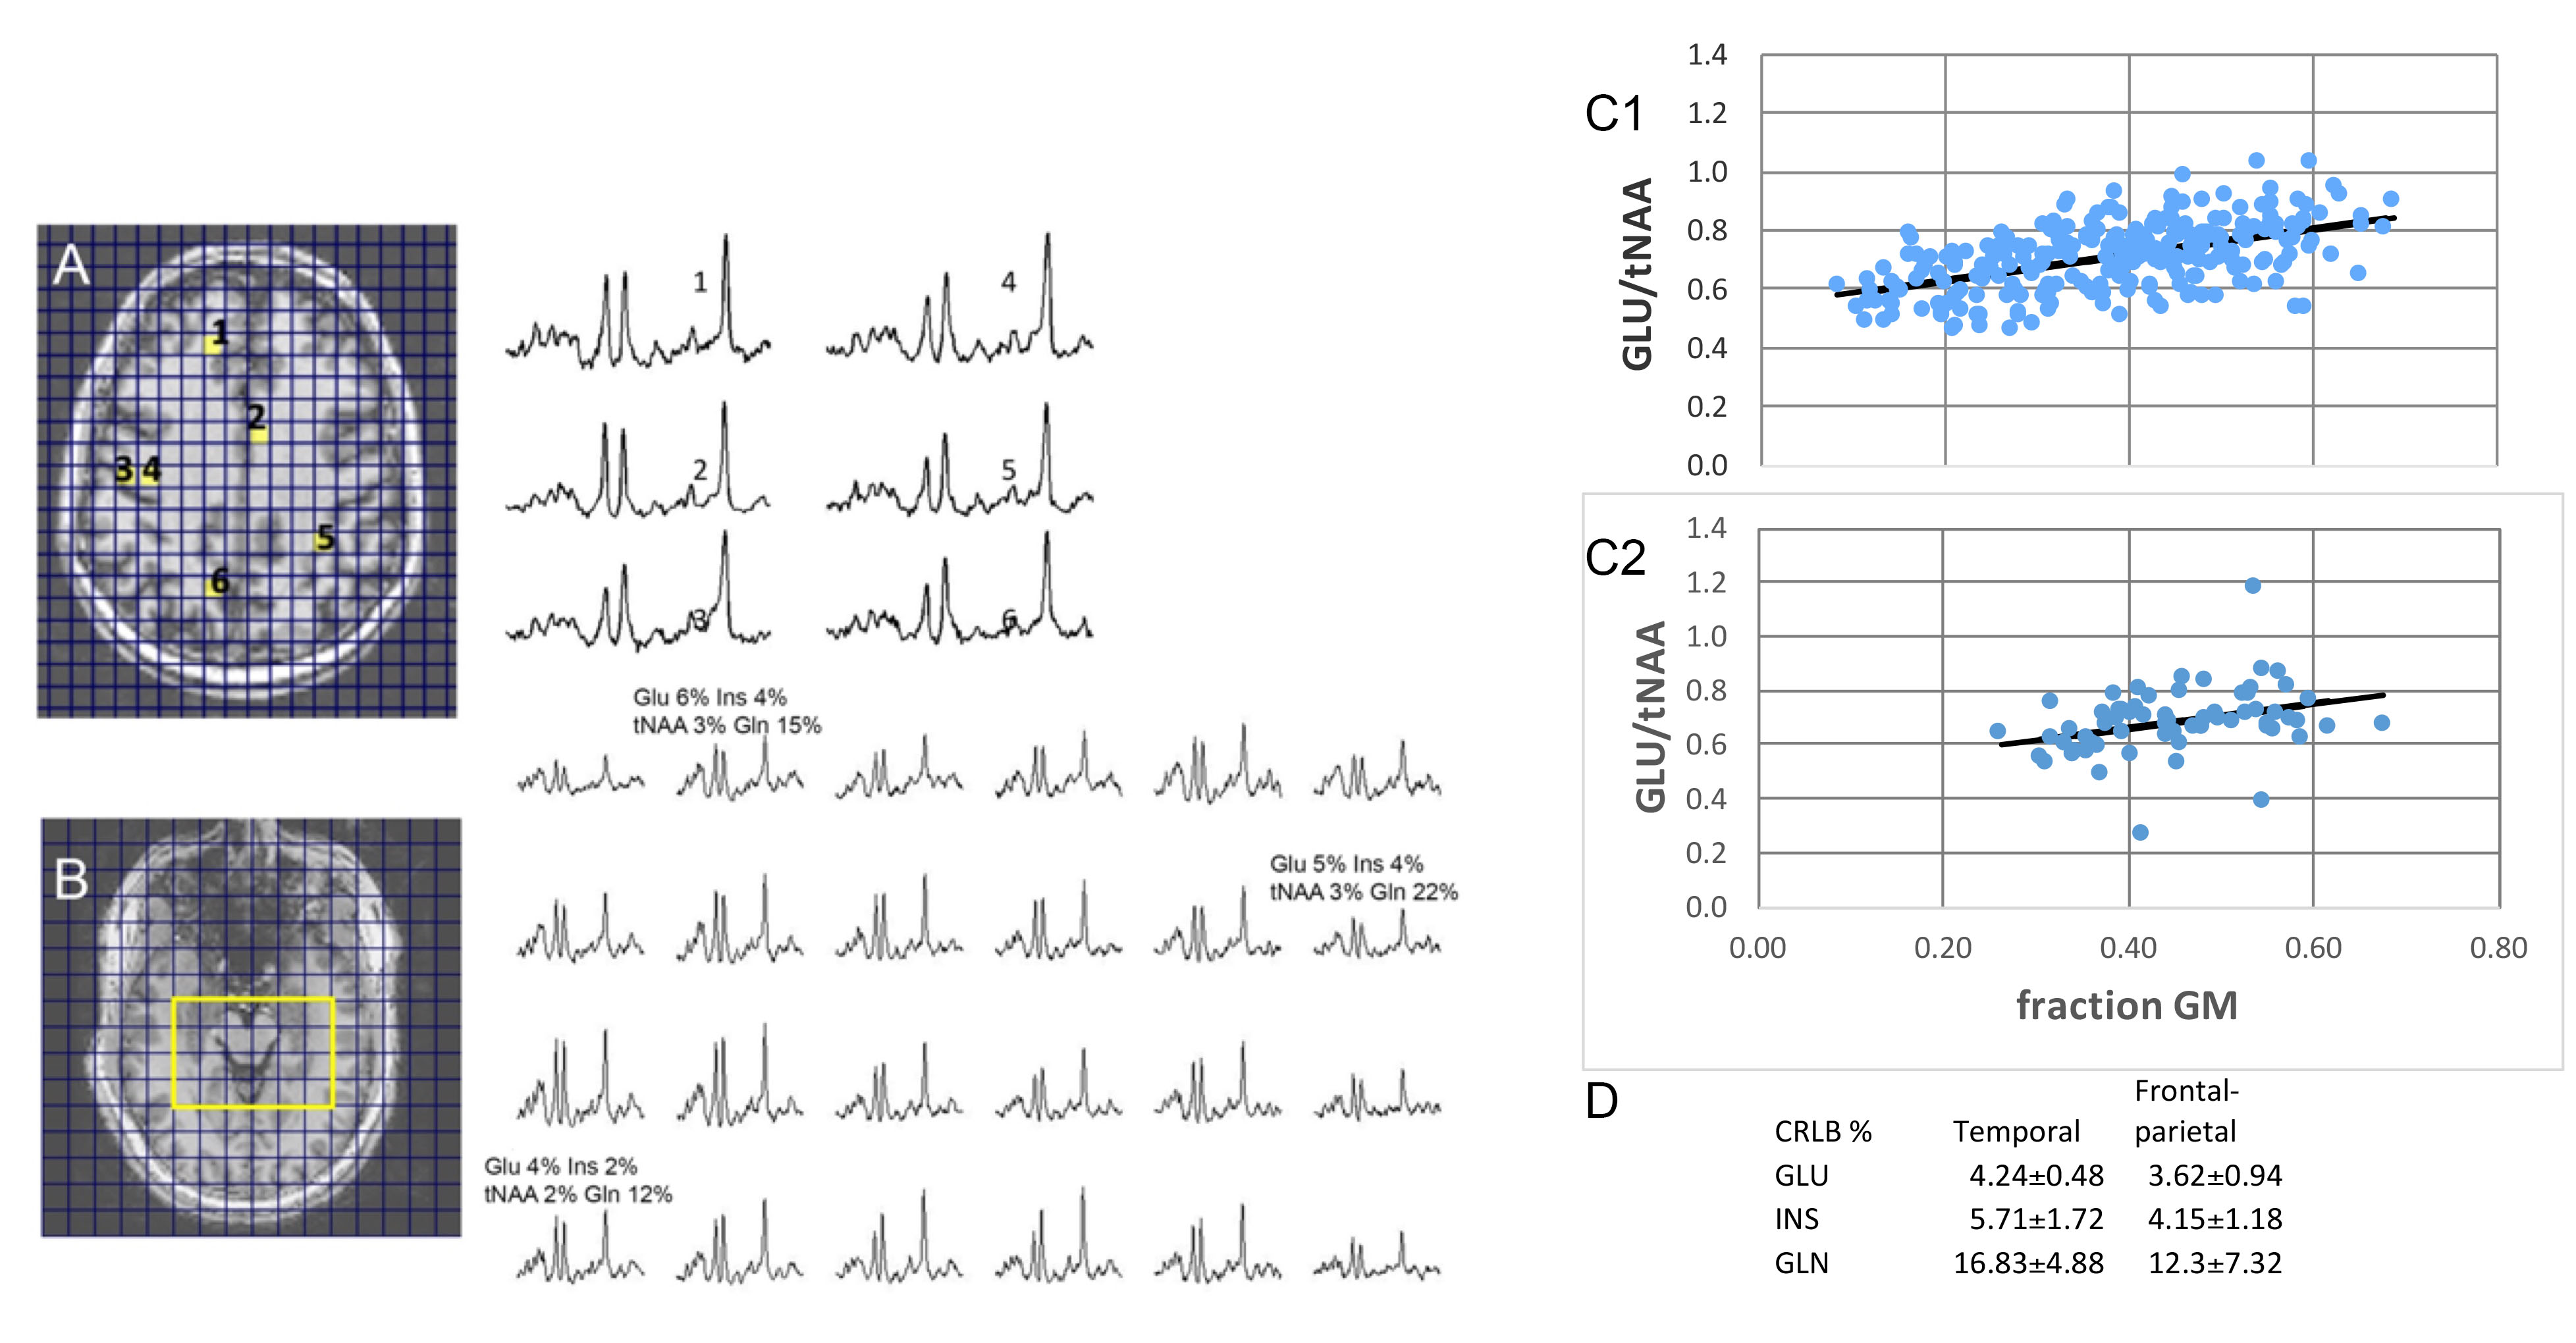
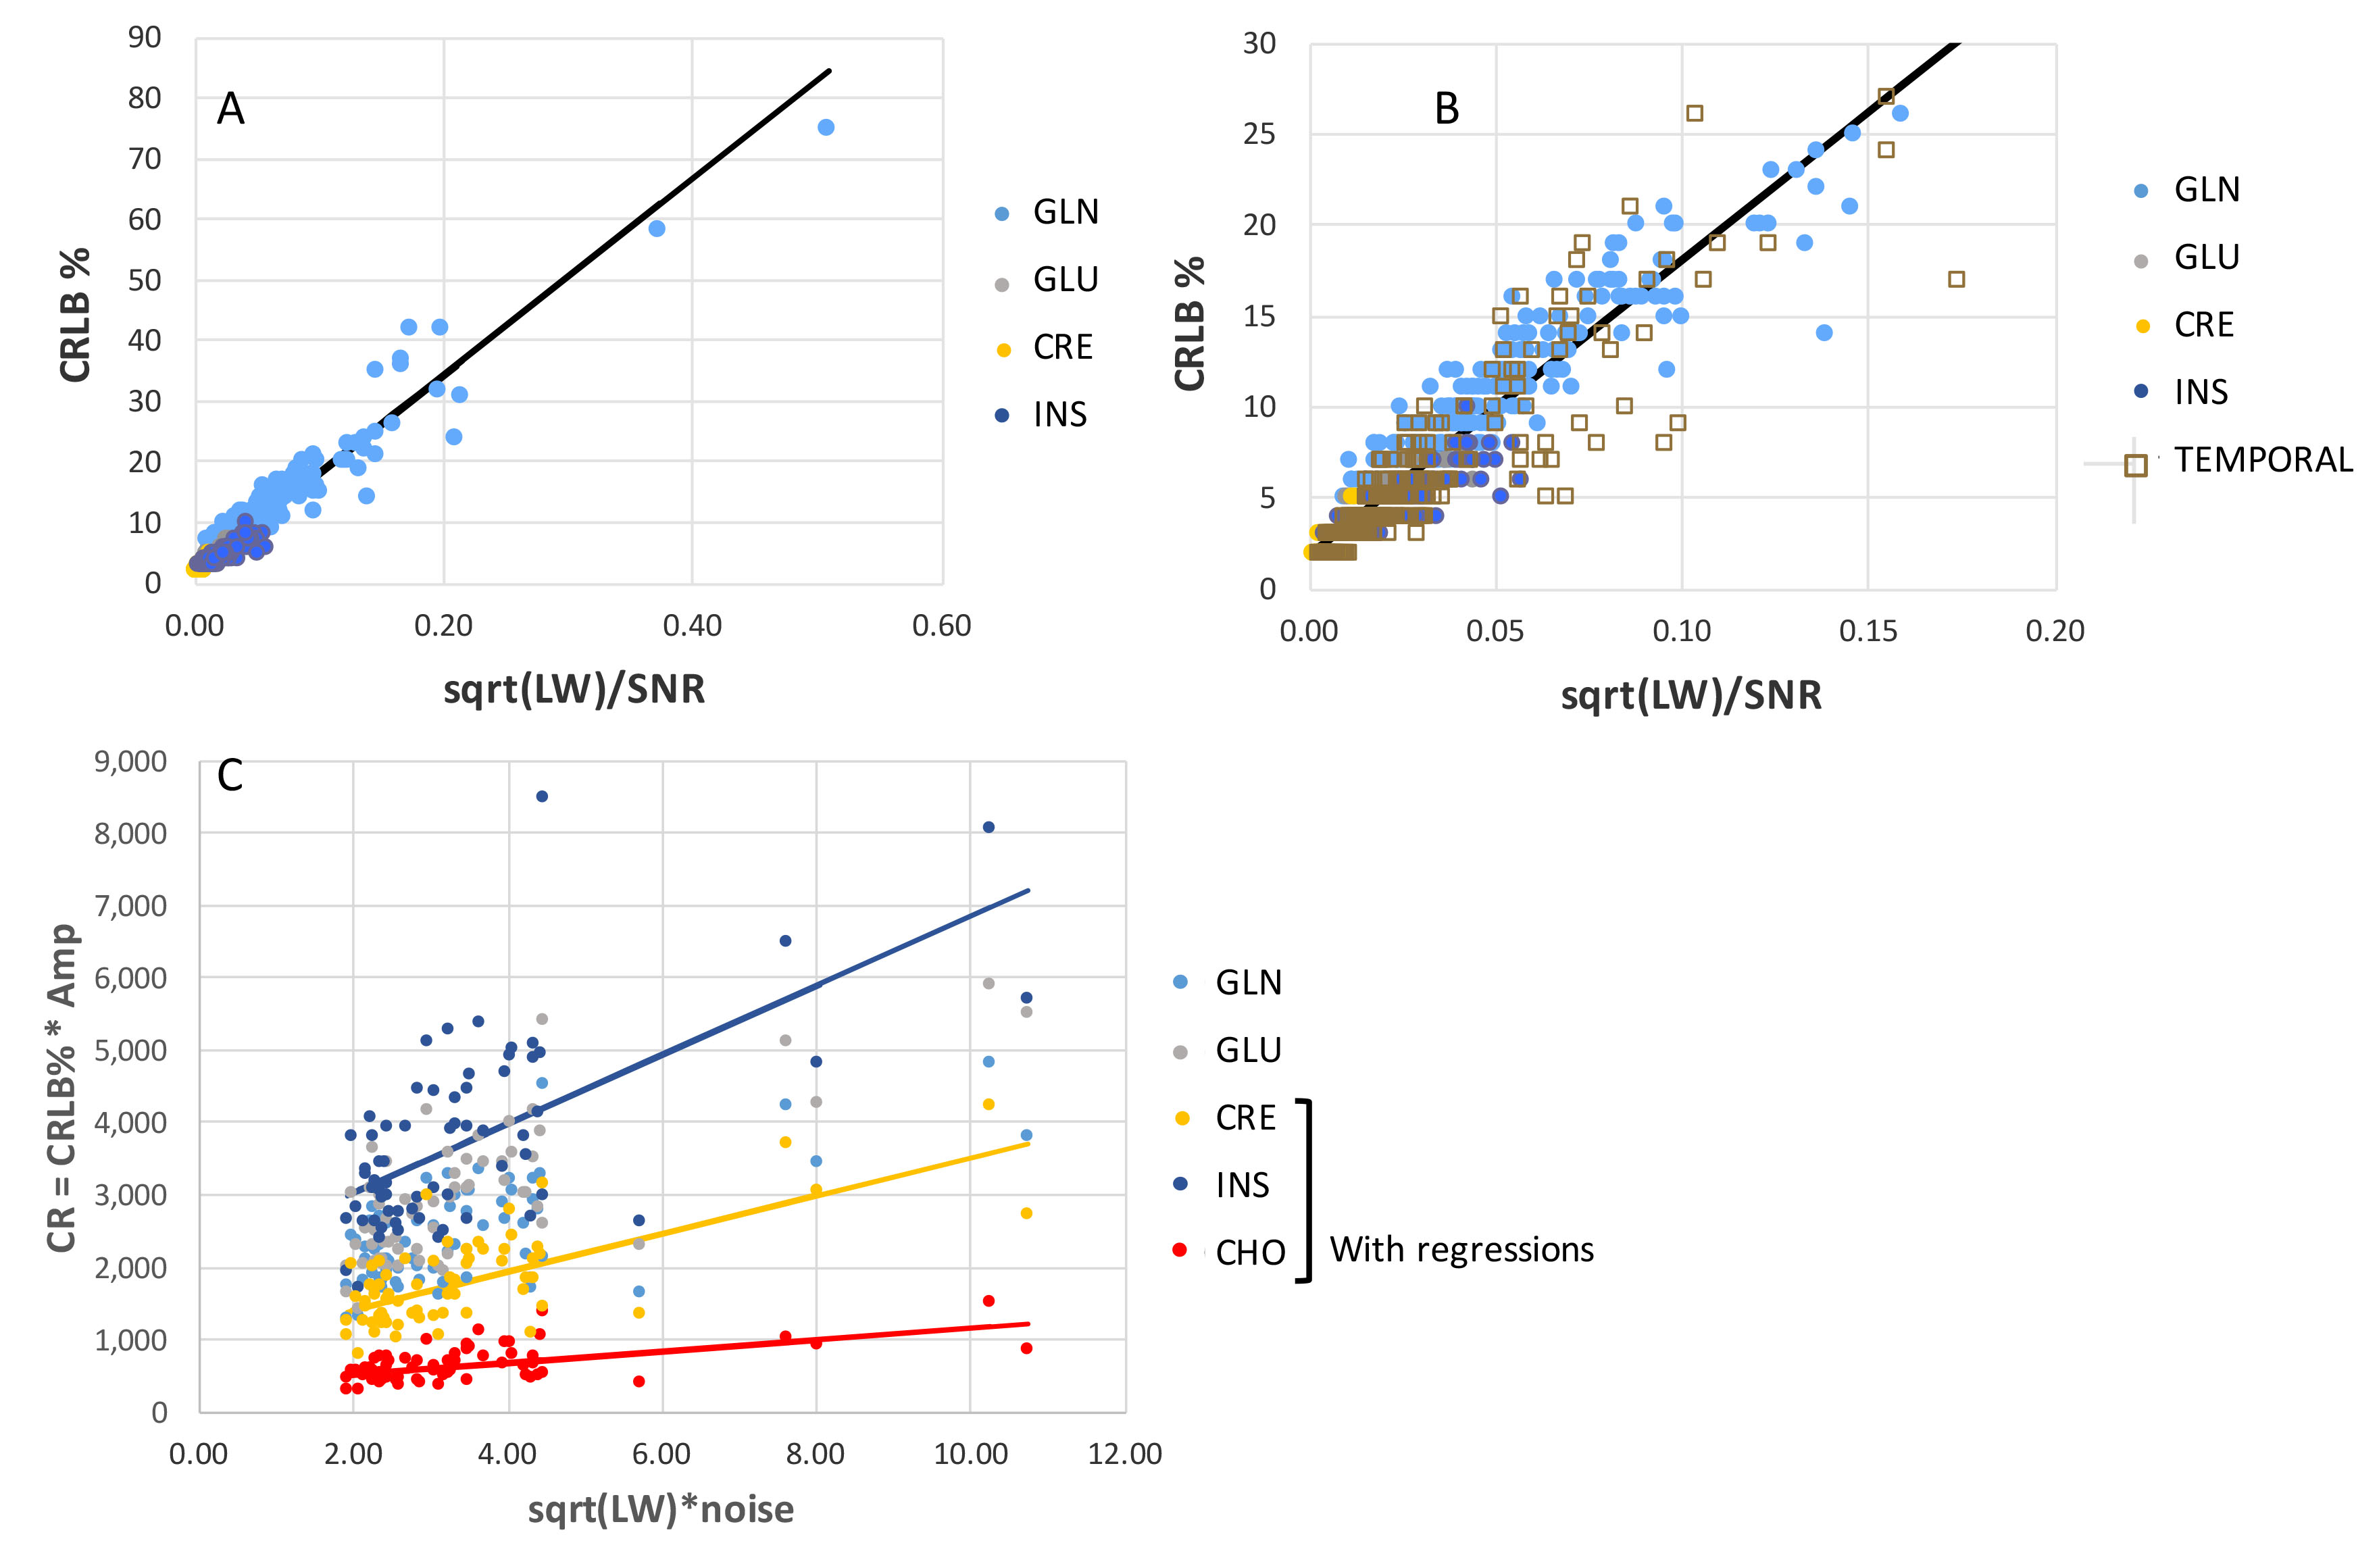
Fig. 2 shows data from two spectroscopic images acquired from the frontal-parietal SMA (24x24 nominal resolution) and medial temporal lobe (16x16 nominal resolution) regions. Using a criteria of spectral inclusion with total brain >60% and a SNRNAA of 10 in these data, the average number of surviving voxels from the n=5 subjects over the available voxels based solely on tissue content was 88.5±5.9% from the frontal/parietal region and 71.1±11.1% from the temporal region. Fig. 2C shows the tissue regression of GLU/tNAA with fraction gray matter from both regions. For both regions (n=5 subjects each), the regression is significant: frontal-parietal R =0.54, p<0.0001; temporal R= 0.36, p<0.005. Mean and SD CRLB % values are shown in Fig. 2D.To examine how the SNR impacts these values more accurately, Fig. 3 shows the regressions of the CRLBk % with shown for multiplet and singlet compounds GLU, INS, GLN and CRE (R=0.97, p<0.001) from the frontal-parietal slice. Data from the temporal region for these compounds are similar (plotted on magnified scale, Fig. 3B). With the larger dynamic range in CRLB % seen in the temporal data, Fig. 3C shows the relationship between the metabolite uncertainty (CR = CRLB %*Amplitude) and spectral uncertainty ξ0 =√LW*σ (removing the influence of signal amplitude from the CRLBk % and ξk =√LW/SNRk). These data show that the compound with greatest dependence for the CR to spectral uncertainty is INS, while CHO exhibits the least dependence, consistent with the complex and overlapping structure of INS to the entire spectrum, in comparison to the minimal overlap of the CHO singlet. These regressions provide greater certainty on the adequacy of the spectral model for the curve fitting given the applied filtering criteria.
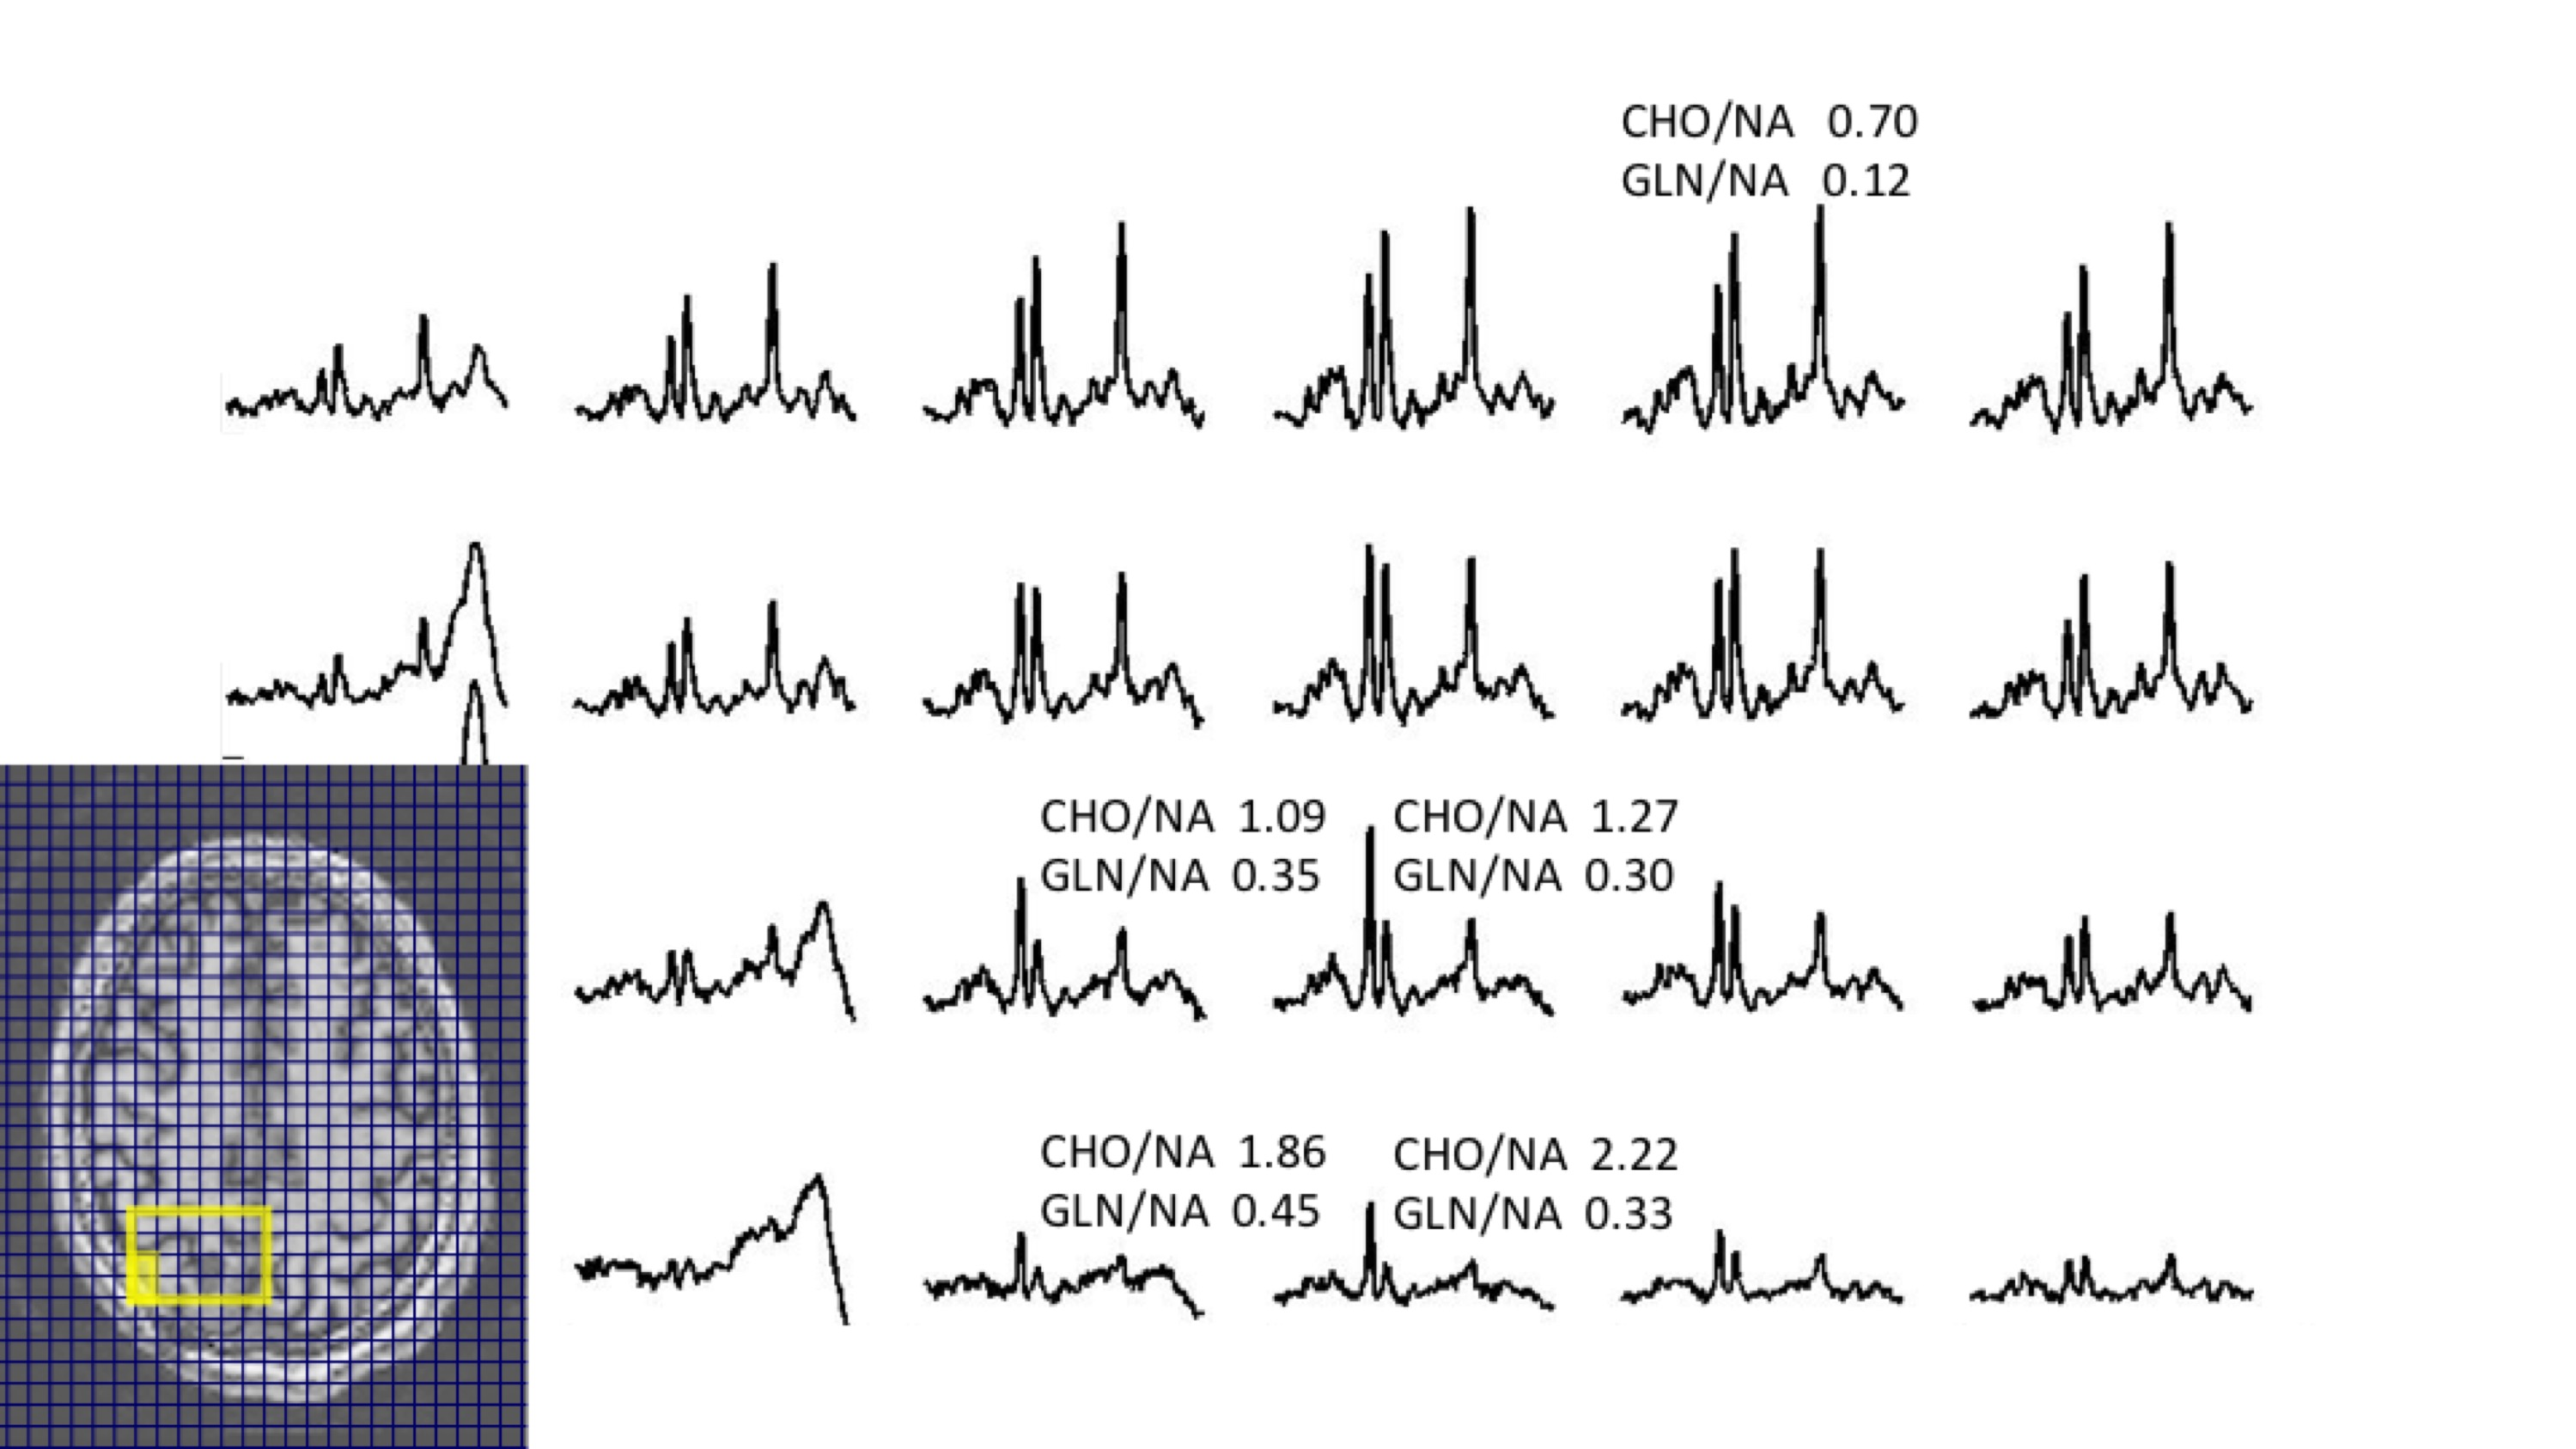
Fig. 4 shows data from a tumor patient. In all three patients, LCM analysis of tumor voxels is consistent with an overt increase in CHO/NAA, and also finds co-localized increases in GLN/NAA. Consistent with clinical history, these findings are consistent with tumor recurrence, rather than treatment effect.
Discussion
At 7T, the J-refocused double spin echo allows for retention of high SNR for fast MRSI. LCM analysis shows that the CRLBk % is highly correlated with ξk =√LW/SNRk and the spectral variance CRk, correlates with ξ0 =√LW*σ for both singlets and multiplets. These observations are evident in the temporal lobe and provides a measure of the consistency of the spectral model to fit the data. The J-refocused sequence enables abnormalities in CHO and GLN in tumor patients to be detected in patients being evaluated to resolve tumor progression versus treatment effects.Acknowledgements
This work is supported by NIH grants EB024408, NS090417, NS081772 and EB011639.References
1. Pan JW, Avdievich N and Hetherington HP. J-refocused coherence transfer spectroscopic imaging at 7 T in human brain. Magn Reson Med. 2010;64:1237-46.
2. Cavassila S, Deval S, Huegen C, van Ormondt D, Graveron-Demilly D. Cramer Rao bound expressions for parametric estimation of overlapping peaks: influence of prior knowledge. J Magn Res 2000 143:3110320.
3. Hetherington HP, Avdievich NI, Kuznetsov AM, Pan JW. RF shimming for spectroscopic localization in the human brain at 7 T. Magn Reson Med. 2010;63:9-19.
4. Hetherington HP, Moon CH, Schwerter M, Shah NJ, Pan JW. Dynamic B0 shimming for multiband imaging using high order spherical harmonic shims. Magn Reson Med. 2021;85:531-543.
5. Schirda CV, Tanase C and Boada FE. Rosette spectroscopic imaging: Optimal parameters for alias‐free, high sensitivity spectroscopic imaging. J Magn Reson Imaging, 2009;29:1375-1385.
Figures