2200
In Vivo J-difference Editing of (Phosphoryl)ethanolamine1University of Maryland School of Medicine, Baltimore, MD, United States, 2The Johns Hopkins University School of Medicine, Baltimore, MD, United States
Synopsis
Phosphorylethanolamine/ethanolamine (PE) serves as an important precursor for choline-containing compounds that are crucial for cell-membrane formation and maintenance. As such, PE can be influenced by pathways involving choline production in brain diseases that cause neuroinflammation. PE is also implicated in diseases that are known to cause neuronal damage. Therefore, PE may be a potential marker for investigating brain integrity. MEGA-PRESS, a spectral editing method, allows direct detection and in vivo measurement of PE. Here, we demonstrate the optimal editing of PE using MEGA-PRESS to facilitate unambiguous in vivo measurements of PE.
Introduction
Phosphorylethanolamine/ethanolamine (PE) are present in the brain at millimolar levels, serving as precursors to choline in phospholipid-synthetic pathways1,2. MRS studies have long recognized choline as a marker of membrane turnover and neuroinflammation3,4. In spite of relatively high concentration3 (4 mM), and close association with biochemical processes of critical interest, PE has remained largely unstudied by MRS due to overlap with signals of high-concentration metabolites, such as creatine (Cr), choline (Cho), and myo-inositol (Ins). J-difference editing is a valuable tool for enhancing resolution of 1H spectrum and alleviating signal overlap, having been applied to detect GABA, glutathione, lactate, and NAAG4. The PE spin system consists of two coupled CH2 groups with chemical shifts 3.22 (PE3.22) and 3.98 (PE3.98) ppm, both of which are potential candidates for edited detection. In this work, we demonstrate that J-difference editing of PE using the MEGA-PRESS sequence and compare the merits of two editing strategies.Methods
Density-matrix simulations5 of the PE spin system were performed using FID-A6 at 3T, assuming ideal excitation and shaped refocusing and 20-ms editing pulses. MEGA-PRESS simulations were performed at TEs ranging from 70 to 200 ms using the following parameters: 21 x 21 two-dimensional spatial array; 8192 complex datapoints sampled at 4 kHz spectral width; simulated linewidth of 2 Hz. Simulations were performed for editing pulses applied at: a) 3.98 ppm (ON3.98) and 7.5 ppm (OFF7.5) to edit PE3.22; and b) 3.22 ppm (ON3.22) and OFF7.5 to edit PE3.98. The integral of the PE3.22 (from 3.02 to 3.42 ppm) and PE3.98 (from 3.78 to 4.18 ppm) signals were calculated. Transverse relaxation was simulated assuming a T2 of 121 ms.In vivo experiments were performed in 3 subjects (M/F: 1/2; Age: 33, 31, 61) with a Philips 3T MRI scanner and 32-channel head coil. A 27-ml midline parietal voxel was prescribed, with the following parameters: TR 2000 ms; 2048 datapoints; 2 kHz spectral width; 20-ms editing pulse duration; and 384 transients. MEGA-PRESS experiments were performed at both TEs 90 and 110 ms, to edit both the 3.98 ppm and 3.22 ppm signals. Data were processed and modeled in Osprey7.
Results
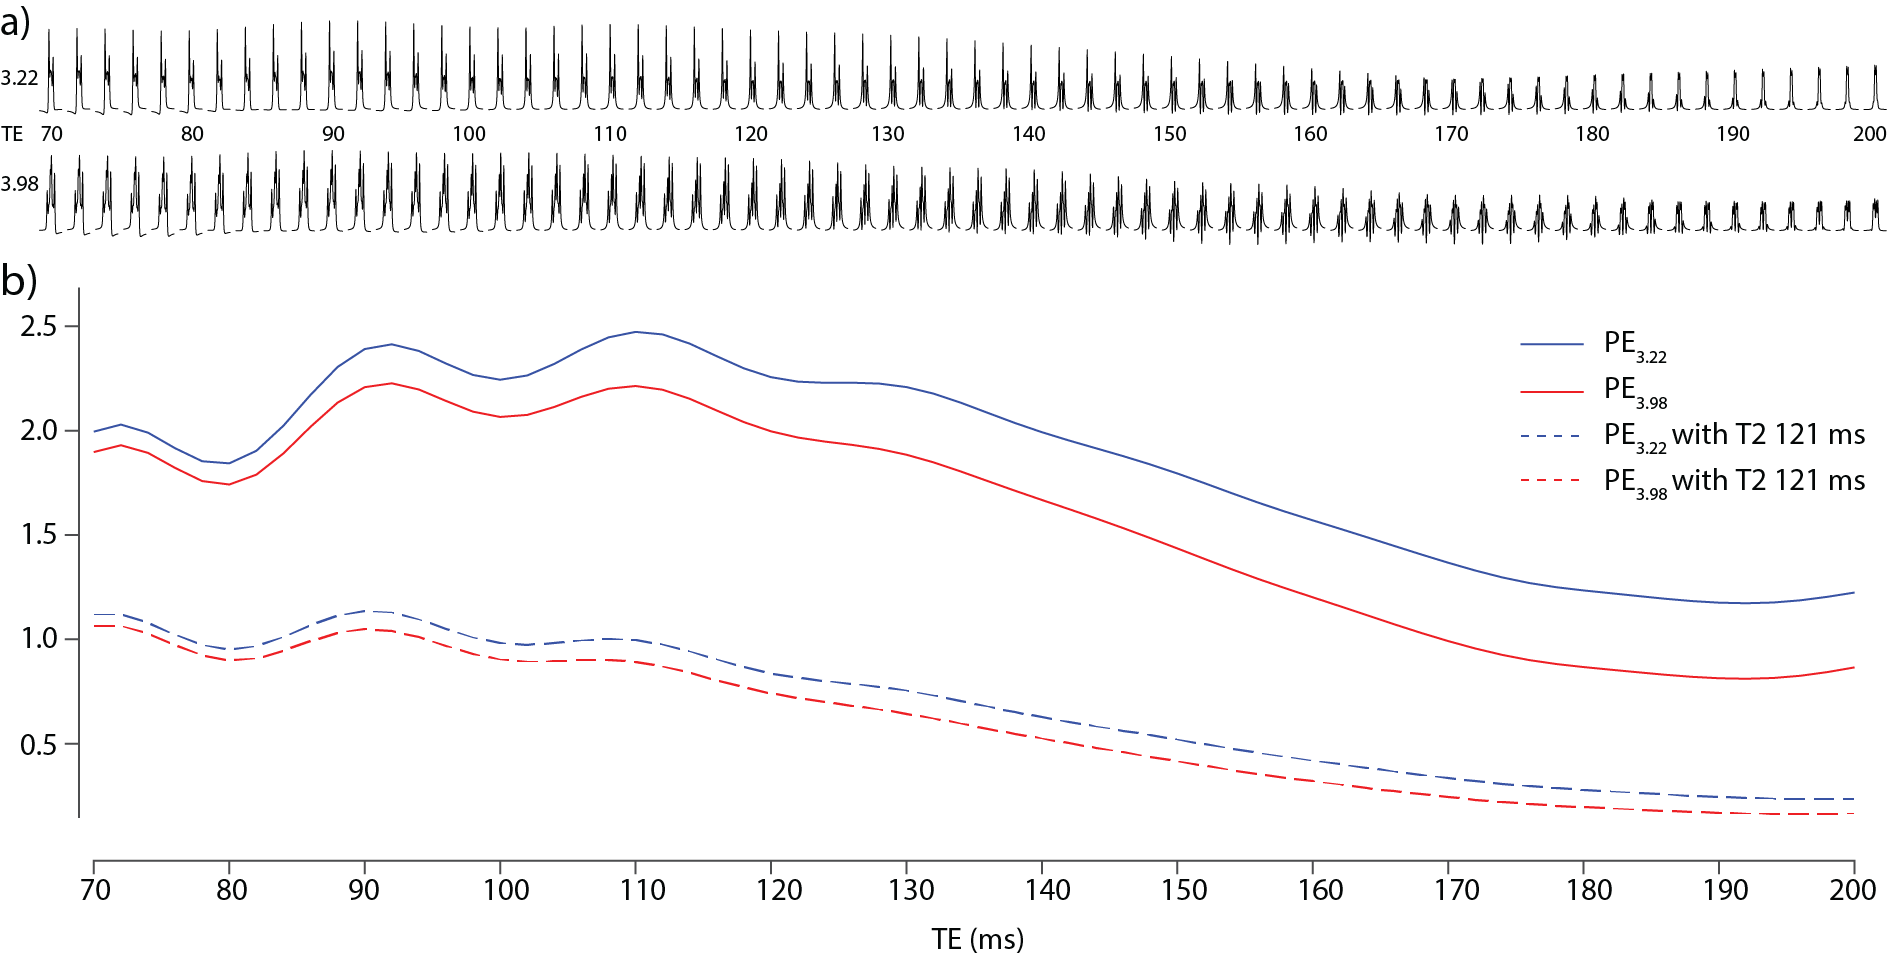
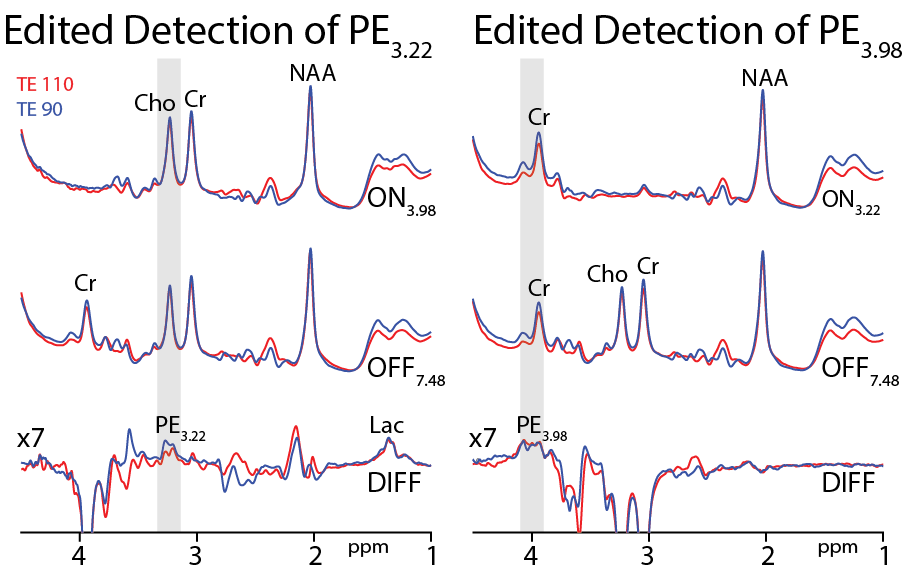
Density-matrix simulations of PE3.22 and PE3.98 in Figure 1a show substantial TE-modulation of the intensity and form of the multiplets due to coupling evolution. Each signal represents two protons, each yielding slightly different doublet-of-doublet multiplets, resulting in complex modulation of the integrals as seen in Figure 1b. In the absence of T2-weighting (solid lines), TEs of 110 and 90 ms are optimal for the edited detection of PE3.22 and PE3.98, respectively. These reduce to 90 and 70 ms, once the impact of transverse relaxation is estimated (broken lines). The ratio of PE3.22 to PE3.98 integral ratio is approximately 1.05 and 1.08 at 70 and 90 ms, respectively.Figure 2 shows typical data from one subject acquired from the midline parietal cortex at both TEs 90 and 110 ms. Both PE3.22 (left) and PE3.98 (right) are well edited without the overlapping Cho and Cr signals.
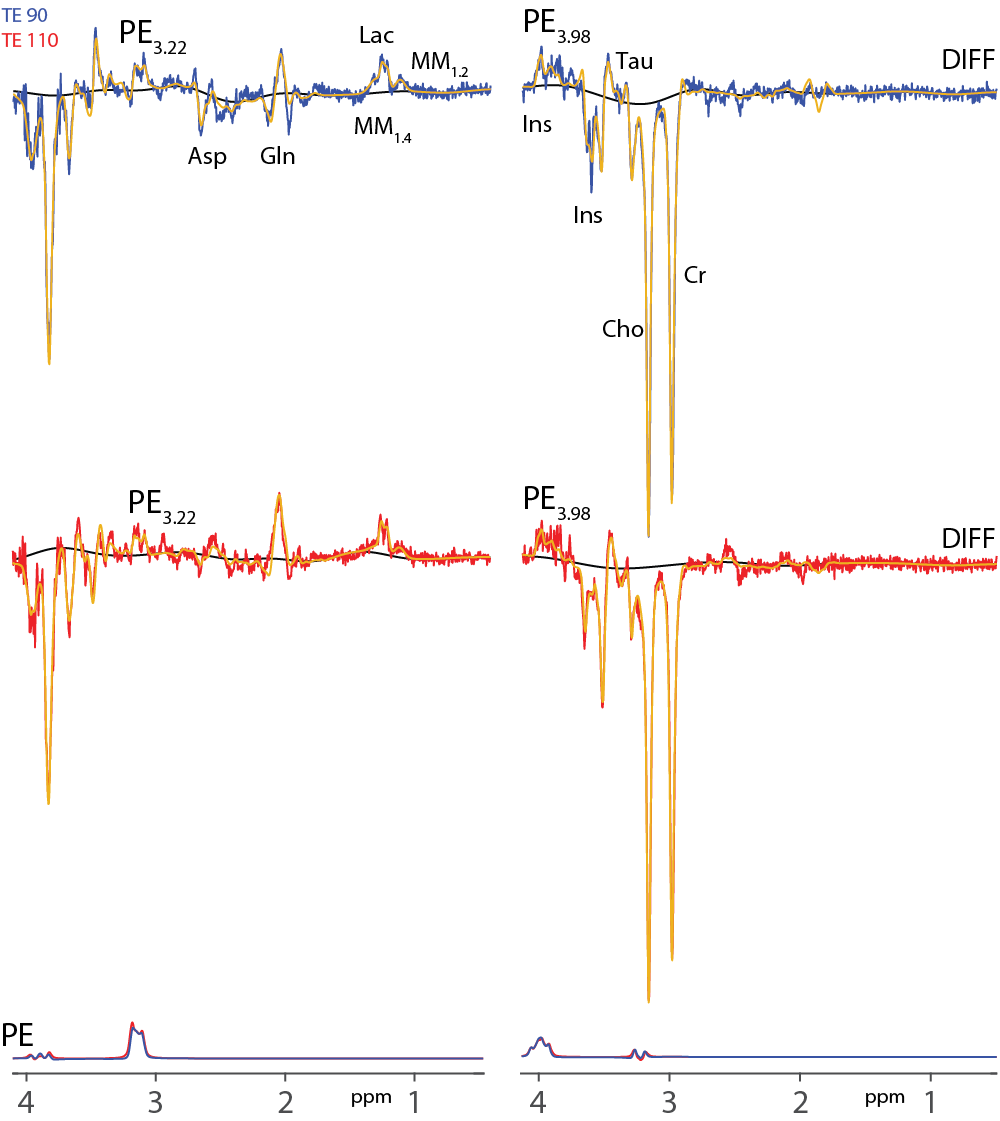
Linear combination modeling (Figure 3) quantification of the PE3.22/Cr in three subjects yields values of 0.17±0.01 at TE 90 ms and 0.18±0.01 at TE 110 ms. Quantification of the PE3.98/Cr in three subjects yields values of 0.23±0.02 at TE 90 ms and 0.34±0.08 at TE 110 ms. It is notable that the edited PE3.22 signal is both better resolved and more reproducibly modeled.
Discussion
Simulations and in vivo experiments demonstrate successful detection of PE at both 3.22 and 3.98 ppm. Edited lineshapes in the in vivo spectra show the distinct lineshapes predicted by the simulations. In considering which editing approach is more suitable, both signal yield and potential co-editing should be considered. Detecting the PE3.22 is marginally more efficient (~8% at TE 90 ms), but crucially yields the better-resolved signal in vivo, with more reproducible quantification.Conclusion
J-difference editing has successfully been applied to quantify PE in vivo; detection of PE3.22 is the slightly better strategy.Acknowledgements
This work was supported by NIH grants R01 EB016089, R01 EB023963, and P41 EB015909.References
1. Perry T, Berry K, Hansen S, Diamond S, Mok C. Regional distribution of amino acids in human brain obtained at autopsy. Journal of neurochemistry. 1971;18:513-519.
2. Li Z, Vance DE. Thematic review series: glycerolipids. Phosphatidylcholine and choline homeostasis. Journal of lipid research. 2008;49:1187-1194.
3. Govindaraju V, Young K, Maudsley AA. Proton NMR chemical shifts and coupling constants for brain metabolites. NMR Biomed. 2000;13:129-153.
4. Harris AD, Saleh MG, Edden RA. Edited 1H magnetic resonance spectroscopy in vivo: Methods and metabolites. Magn Reson Med. 2017;77:1377–1389.
5. Zhang Y, An L, Shen J. Fast computation of full density matrix of multispin systems for spatially localized in vivo magnetic resonance spectroscopy. Med Phys. 2017;44:4169-4178.
6. Simpson R, Devenyi GA, Jezzard P, Hennessy TJ, Near J. Advanced processing and simulation of MRS data using the FID appliance (FID‐A)—An open source, MATLAB‐based toolkit. Magn Reson Med. 2017;77:23-33.
7. Oeltzschner G, Zöllner HJ, Hui SC, Mikkelsen M, Saleh MG, Tapper S, Edden RA. Osprey: Open-Source Processing, Reconstruction & Estimation of Magnetic Resonance Spectroscopy Data. J Neurosci Methods. 2020;343.
Figures