2199
Evaluation of a spectroscopy sequence using polychromatic refocusing to suppress J-modulation and measure lactate diffusion in the rodent brain1Université Paris-Saclay, Commissariat à l'Energie Atomique et aux Energies Alternatives (CEA), Centre National de la Recherche Scientifique (CNRS), Molecular Imaging Research Center (MIRCen), Laboratoire des Maladies Neurodégénératives, Fontenay aux Roses, France
Synopsis
Diffusion-weighted NMR spectroscopy allows non-invasive measurement of the diffusion properties of brain metabolites. Lactate is of particular interest but has low concentration thus requiring the development of new sequences to maximize signal-to-noise ratio. In this work, we compare a reference stimulated echo sequence and two spin echo sequences using either a broad pulse, or a selective polychromatic pulse suppressing J-modulation, by measuring the signal attenuation as a function of diffusion-weighting. Suppression of J-modulation with the polychromatic spin echo sequence leads to a significant signal gain and a better precision in lactate signal attenuation.
Introduction
In vivo diffusion-weighted NMR spectroscopy (DW-MRS) allows measuring metabolite diffusion properties in the brain, and therefore to derive information about the microstructural environment they diffuse in. The low lactate concentration, compared to other metabolites, makes this measurement difficult and requires the development of new DW-MRS sequences maximizing lactate signal to-noise ratio. We compare the signal attenuation as a function of diffusion-weighting b, between a reference sequence (STE-LASER)1, as used in most of our recent works, and a spin echo sequence (SE-LASER) where the DW spin-echo part relies on a polychromatic pulse refocusing only the resonances of interest, therefore suppressing J-modulation on lactate resonance at 1.31 ppm.Methods
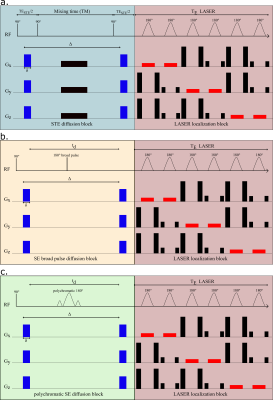
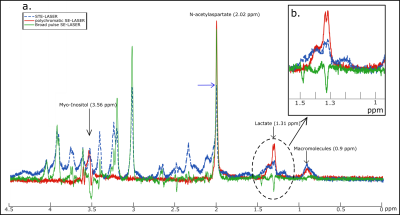
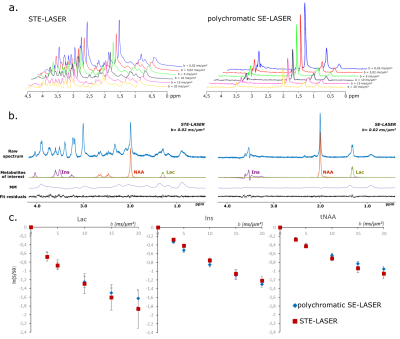
Four wild-type mice were scanned on an 11.7 T Bruker system with a quadrature surface cryoprobe. The STE-LASER sequence (fig.1a) starts by a diffusion-weighting stimulated echo block (three broad pulses, TESTE/TM=8.4/50 ms, δ/Δ=3/53.2 ms), and is followed by a LASER adiabatic localization bock (TELASER=25 ms). The SE-LASER sequence consists of a diffusion-weighting spin echo block (TESE=58.3 ms) with the same diffusion timing as the STE-LASER (δ/Δ=3/53.2 ms), followed by the same LASER block (fig.1). The sequence starts with a 90° adiabatic excitation pulse. For the refocusing, the spin echo block uses either a broad pulse (to assess the sole benefit of using a spin echo compared to a stimulated echo, fig.1b), or a polychromatic pulse (fig.1c). This pulse is inspired from works by Shemesh et al.2,3 and is designed using the Shinnar-Le Roux algorithm. Its advantage relies on its high selectivity: by choosing carefully the 180° pulse bandwidth, we can target only the resonances of interest. In this work, in order to simultaneously measure the diffusion of lactate and of metabolites with specific cellular compartmentation, we chose to excite NAA (neuronal marker) at 2.02 ppm, myo-inositol (astrocytic marker) at 3.56 ppm and the CH3 lactate group at 1.31 ppm, and to exclude the CH lactate group at 4.09 ppm which the CH3 group is coupled with. This allows for the suppression of the J-coupling effect on the 1.31 ppm resonance at the echo (moreover, the J-coupling effect during the LASER block is negligible since it consists in a CPMG refocusing train). First, spectra were acquired in a 31.5 µL hippocampal voxel of interest without diffusion-weighting (b= 0.02 ms/µm², 128 repeats) with the three sequences (STE-LASER, broad pulse SE-LASER, polychromatic SE-LASER), for signal comparison. Then, the spectra were acquired at six different b-values (b= 0.02, 3.02, 5, 10, 15 and 20 ms/µm², TR=2000 ms, 128 repeats), with the STE-LASER sequence and the polychromatic SE-LASER sequence (the full set of measurements was performed in each mouse during the same session). Spectra were analyzed with LCModel4. Experimental macromolecule spectra were included in LCModel basis-sets. Note that the polychromatic pulse was designed to also refocus the macromolecule resonance at 0.9 ppm to feed LCModel with extra information to reliably quantify macromolecule signal overlapping with lactate at 1.31 ppm (fig.3b).Results and discussion
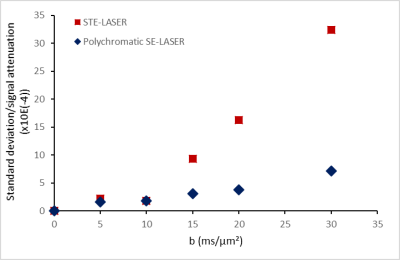
The use of a stimulated echo in the STE-LASER sequence results in the loss of half of the signal compared to a spin echo. The broad pulse SE-LASER sequence allows for partially recovering signal despite longer TE (fig.2a), but only for singlets such as NAA, tCho and tCr, not for lactate. The polychromatic SE-LASER sequence allows for a similar signal increase for NAA, and a spectacular lactate signal gain (fig.2b). Comparison of signal attenuation as measured with the reference STE-LASER sequence and the polychromatic SE-LASER sequence confirms the interest of using the latter for measuring lactate diffusion at high b: while mean signal attenuation is comparable between both sequences (i.e. there is no apparent bias) (fig.3), standard deviation on lactate signal attenuation as measured across the four animals is consistently lower with the polychromatic SE-LASER sequence, in particular at the highest b-values (fig.4).Conclusion
This work shows that J-modulation suppression provided by the polychromatic SE-LASER sequence leads to a significant increase in lactate signal intensity, in turn resulting in better precision up to higher b-values. In the future, the comparison of lactate diffusion with NAA (neuronal metabolite), and with myo-inositol (astroglial metabolite) may provide information on lactate distribution in these cellular types (as tentatively done previously5) leading to a better understanding of the lactate shuttle6.Acknowledgements
This project has received funding from the European Research Council (ERC) under the European Union’s Horizon 2020 research and innovation programs (grant agreement n° 818266)References
1. Ligneul, C., Palombo, M. and Valette, J. Metabolite diffusion up to very high b in the mouse brain in vivo: Revisiting the potential correlation between relaxation and diffusion properties. Magn. Reson. Med., 2017;77: 1390-1398.
2. Shemesh, N., Rosenberg, J., Dumez, JN. et al. Metabolic properties in stroked rats revealed by relaxation-enhanced magnetic resonance spectroscopy at ultrahigh fields. Nat Commun 5, 2014; 4958. 3. Provencher SW. Estimation of metabolite concentrations from local- ized in vivo proton NMR spectra. Magn Reson Med 1993;30:672–679 Provencher SW. Estimation of metabolite concentrations from local- ized in vivo proton NMR spectra. Magn Reson Med 1993;30:672–679
3. Shemesh N, Rosenberg JT, Dumez JN, Grant SC, Frydman L. Distinguishing neuronal from astrocytic subcellular microstructures using in vivo Double Diffusion Encoded 1H MRS at 21.1 T. PLoS One. 2017;12(10):e0185232.
4. Provencher SW. Estimation of metabolite concentrations from localized in vivo proton NMR spectra. Magn Reson Med 1993;30:672–679
5. Ligneul C, Palombo M, Hernández-Garzón E, et al. Diffusion-weighted magnetic resonance spectroscopy enables cell-specific monitoring of astrocyte reactivity in vivo. Neuroimage. 2019 May 1;191:457-469.
6. Barros LF, Weber B. CrossTalk proposal: an important astrocyte-to-neuron lactate shuttle couples neuronal activity to glucose utilisation in the brain. J Physiol. 2018;596(3):347-350.
Figures


