2196
Development and Evaluation of a software for Parametric Patlak mapping using PET/MRI input function (CALIPER).
Praveen Dassanayake1,2, Lumeng Cui3, Elizabeth Finger2,4, Andrea Soddu5,6, Bjoern Jakoby7, Keith St. Lawrence1,2, Gerald Moran8, and Udunna Anazodo1,2
1Department of Medical Biophysics, University of Western Ontario, London, ON, Canada, 2Lawson Health Research Institute, London, ON, Canada, 3Division of Biomedical Engineering, University of Saskatchewan, Saskatoon, SK, Canada, 4Department of Clinical Neurological Sciences, University of Western Ontario, London, ON, Canada, 5Brain and Mind Institute, University of Western Ontario, London, ON, Canada, 6Department of Physics and Astronomy, University of Western Ontario, London, ON, Canada, 7Department of Physics, University of Surrey, Guildford, United Kingdom, 8Siemens Healthineers, Oakville, ON, Canada
1Department of Medical Biophysics, University of Western Ontario, London, ON, Canada, 2Lawson Health Research Institute, London, ON, Canada, 3Division of Biomedical Engineering, University of Saskatchewan, Saskatoon, SK, Canada, 4Department of Clinical Neurological Sciences, University of Western Ontario, London, ON, Canada, 5Brain and Mind Institute, University of Western Ontario, London, ON, Canada, 6Department of Physics and Astronomy, University of Western Ontario, London, ON, Canada, 7Department of Physics, University of Surrey, Guildford, United Kingdom, 8Siemens Healthineers, Oakville, ON, Canada
Synopsis
Absolute quantification of tracer uptake in positron emission tomography (PET) requires the knowledge of an arterial input function (AIF) which involves invasive arterial blood sampling. Alternatively, input functions can be extracted by identifying feeding arteries from PET images. In this study we validated a software that uses magnetic resonance images to identify the feeding arteries in PET images to generate image derived input function (IDIF) for absolute quantification of PET. The ratio of area under curve between IDIFs and AIFs revealed that this tool can generate accurate IDIFs for non-invasive PET quantification.
Introduction
Positron emission tomography (PET) offers an approach for probing molecular and neurochemical changes in the body with superior sensitivity. Traditionally, PET tracer distribution in the body is quantified non-invasively using standardized uptake values (SUVs). Unlike absolute quantification of tracer uptake, SUVs are semi-quantitative and require a valid reference region to reduce variability which is not available for some tracers2. These have necessitated the move from semi-quantitative SUVs to fully quantification of tracer uptake. However, full quantification requires measuring the arterial input function (AIF) using invasive serial arterial blood sampling3. An alternative non-invasive approach would be to generate image-derived input functions (IDIFs) by defining the feeding arteries to the tissue from dynamic PET images. The main challenge of using PET only approach for IDIF is its low spatial resolution, mixing arterial tissue voxels with surrounding tissue voxels leading to partial volume errors (PVE)3-5. The combination of PET with magnetic resonance imaging (MRI) offers the possibility to measure the IDIFs noninvasively, using MRI anatomical images to help define the feeding arteries 3,5,6. Here we introduce, an automated parametric Patlak mapping using PET/MRI input function (CALIPER) tool, developed to extract IDIF by combining PET and MRI and quantify irreversible tracers (i.e.18F-fluorodeoxyglucose (FDG)) based on the Patlak graphical approach7. Our objective is to validate this tool against AIFs determined from serial arterial blood sampling with the future goal of quantifying reversible PET tracers without the requirement of serial blood sampling.Method
First, we validated our PET/MRI IDIF approach on a porcine model to evaluate the implemented PVE correction method2 and see how well our IDIF approach can resolve IF from relatively small vessels in the brain. Then, evaluated the performance of the PET/MRI IDIF approach healthy human participants. And finally, applied CALIPER to quantify FDG in a cohort of frontotemporal dementia (FTD) patients, with an effort to improve diagnostic classification and characterization of FTD. PET and MRI data for all subjects were acquired on a Biograph mMR (Siemens Healthineers, DE) for 60 minutes immediately after injection of FDG (5 MBq/kg) at fasting plasma glucose levels no more than 2-7 mmol/L.Validation
The IDIF were acquired from animal and human models using CALIPER by extracting the median PET activity from carotid vessel masks at each timeframe. The vessel mask was defined by a region-growing segmentation algorithm to identify both carotid arteries visible on either magnetization prepared rapid gradient echo (MPRAGE) MRI or 3D time of flight (TOF) MR angiography images registered to PET (figure 1C and D). The IDIF was corrected for PVE and spill-in contamination by using simulated correction factors2,4. The IDIFs from 7 pigs were compared against AIFs acquired from serial blood samples, while the IDIF acquired from 11 healthy human participants were compared against a population-based AIF (PBAIF) generated by normalizing the AIFs of 10 healthy controls by the injected dose and body weight3. Individual PBAIF were generated by calibrating the PBAIF by 2 late venous samples (45- and 60-min post injection)8,9.To assess the performance of PET/MRI IDIF, the ratio of area under the curve (rAUC) between IDIF and AIF/PBAIF were compared as:$$$(AUC IDIF/AUC AIF, or PBAIF)$$$
Application
To assess the feasibility of CALIPER in quantifying FDG uptake, we compared regional changes in parametric maps of the cerebral metabolic rate of glucose consumption (CMRglc) in 10 FTD patients and 10 age-matched controls7. Regions of interest analysis in brain regions associated with FTD were compared between groups using a two-sample t-tests1.Results
The carotid vessel size in the porcine and human subjects ranged from 4-5 mm and 5-7 mm respectively. The rAUC of pig validation experiments were overestimated by 8 ± 19 %, as shown in figure 2B . This bias was observed for both anatomical MR techniques used as a guide to generate IDIFs. For healthy human controls, IDIFs were in good agreement with PBAIF as shown in figure 3A and had less bias (6 ± 14 %) compared to the pig model. The rAUC for IDIFs generated using TOF MRI as a guide was closer to the reported bias in literature3 (figure 3B). Figure 4, A and B shows the representative CMRglc map of a healthy control and a patient generated using CALIPER. Figure 4C indicates regions of the brain implicated in FTD with a significant reduction in CMRglc in FTD patients compared to healthy controls.Conclusion
Despite the relatively small vessel diameter in the porcine model, which was close to the 4.3mm full width at half maximum of the PET/MRI10 and increased the susceptibility of the IDIF to partial volume errors, the measured IDIFs were in good agreement with the true AIFs as shown in figure 2A. Though TOF anatomical information due to its higher contrast-to-noise ratio is preferred over MPRAGE for vessel mask delineation for generating the IDIFs, we demonstrated that CALIPER could generate reliable results using both modalities. In general, the results demonstrate the potential of CALIPER as a tool for automated quantification of PET without the need for invasive AIFs. This opens the door for application of non-invasive PET tracer kinetic modeling clinically using PET and multiparametric MRI.Acknowledgements
No acknowledgement found.References
- Anazodo U et al. Using simultaneous PET/MRI to compare the accuracy of diagnosing frontotemporal dementia by arterial spin labelling MRI and FDG-PET. Neuroimage Clin. 2017 Oct 31;17:405-414.
- Croteau E et al. Image-derived input function in dynamic human PET/CT: methodology and validation with 11C-acetate and 18F-fluorothioheptadecanoic acid in muscle and 18F-fluorodeoxyglucose in brain. Eur J Nucl Med Mol Imaging. 2010 Aug;37(8):1539-50.
- Sundar LK et al. Towards quantitative [18F]FDG-PET/MRI of the brain: Automated MR-driven calculation of an image-derived input function for the non-invasive determination of cerebral glucose metabolic rates. J Cereb Blood Flow Metab. 2019 Aug;39(8):1516-1530.
- Feng ST et al. Image-derived arterial input function in dynamic positron emission tomography-computed tomography: a method using both positron emission tomographic and computed tomographic images. J Comput Assist Tomogr. 2012 Nov-Dec;36(6):762-7.
- Sari H et al. Estimation of an image derived input function with MR-defined carotid arteries in FDG-PET human studies using a novel partial volume correction method. J Cereb Blood Flow Metab. 2017 Apr;37(4):1398-1409.
- Ringheim A et al. Kinetic modeling of 68Ga-PSMA-11 and validation of simplified methods for quantification in primary prostate cancer patients. EJNMMI Res. 2020 Feb 24;10(1):12.
- Patlak CS et al. Graphical evaluation of blood-to-brain transfer constants from multiple-time uptake data. J Cereb Blood Flow Metab. 1983 Mar;3(1):1-7.
- Tsuchida T et al. Noninvasive measurement of cerebral metabolic rate of glucose using standardized input function. J Nucl Med. 1999 Sep;40(9):1441-5.
- Eberl S et al. Evaluation of two population-based input functions for quantitative neurological FDG PET studies. Eur J Nucl Med. 1997 Mar;24(3):299-304.
- Delso G et al. Performance measurements of the Siemens mMR integrated whole-body PET/MR scanner. J Nucl Med. 2011 Dec;52(12):1914-22.
Figures
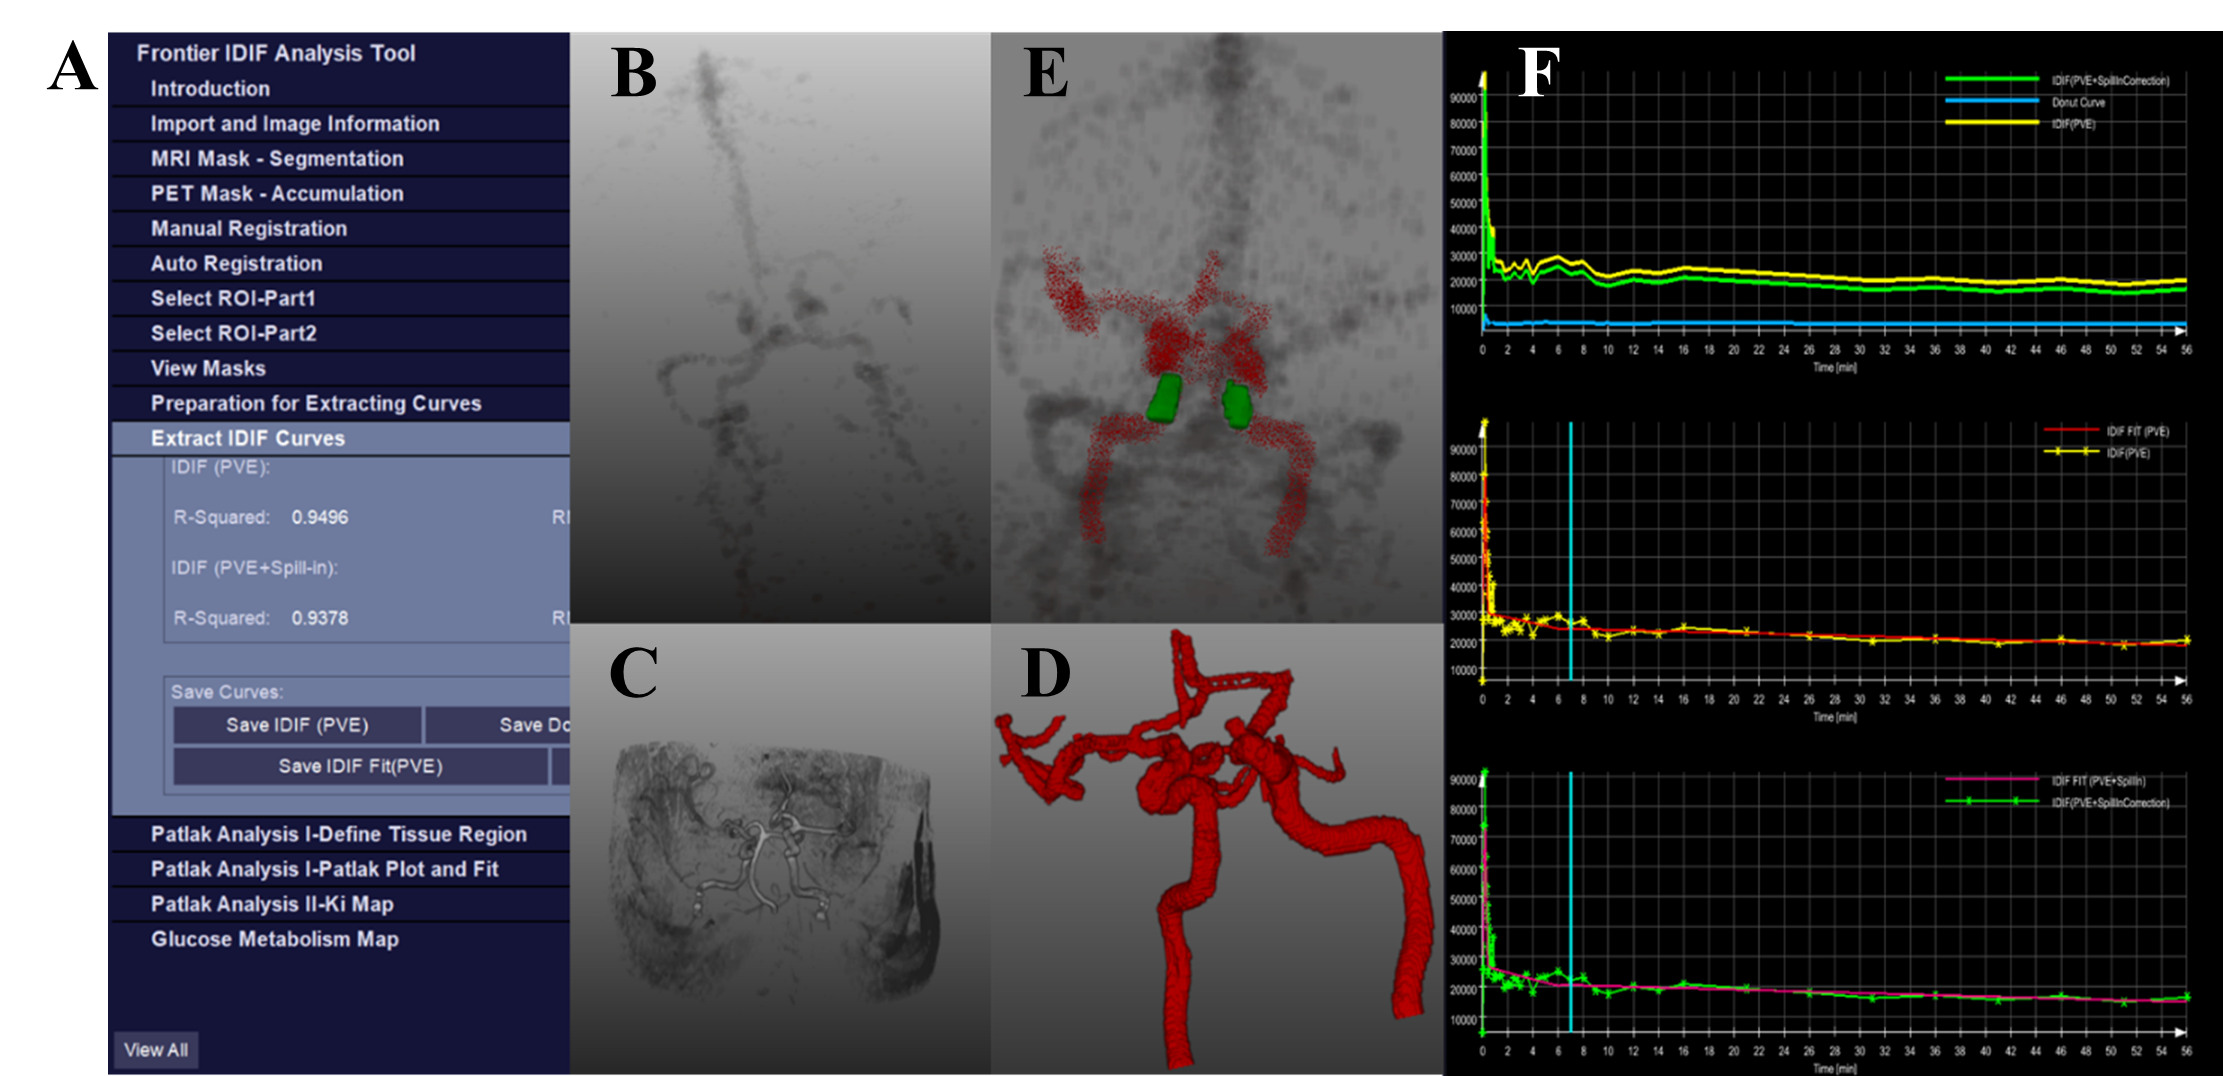
Figure 1. CALIPER’s (A). Graphical user interface consisting
(B). PET vessel accumulation, (C) and (D) MRI vessel segmentation prior to (E).
co-registration, selection of a region of interest from internal carotid
arteries and extracting a (F). IDIF corrected for PVE and spill-in contamination.
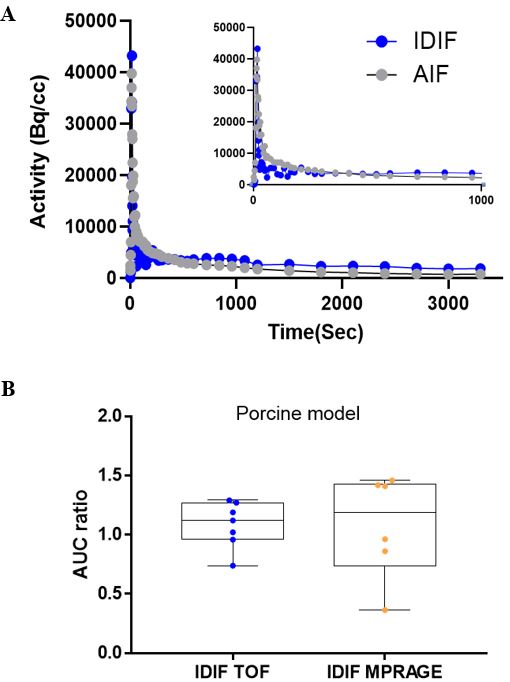
Figure 2. (A) IDIFs generated using TOF MR images and AIF of
a pig indicating the shape of the entire curve and the initial peak from 0 to 1000
s. (B) Two-sample t-test indicates no significant
changes in the ratio of AUC between IDIF and AIF for IDIFs generated using
TOF and MPRAGE MRI vessel masks.
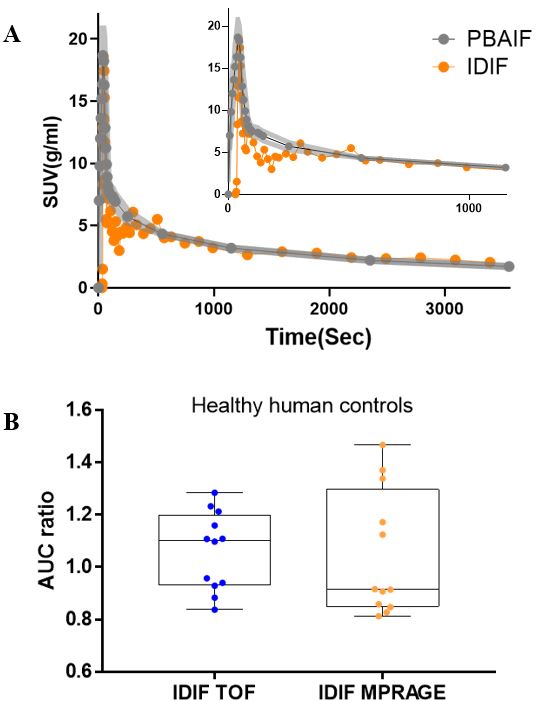
Figure 3. (A) IDIFs generated using TOF MR images and AIF of
a healthy human control indicating the shape of the entire curve and the
initial peak from 0 to 1000 s. (B). Two-sample t-test indicates no significant
changes in the ratio of AUC between IDIF and PBAIF for IDIFs generated using
TOF and MPRAGE MRI vessel masks.
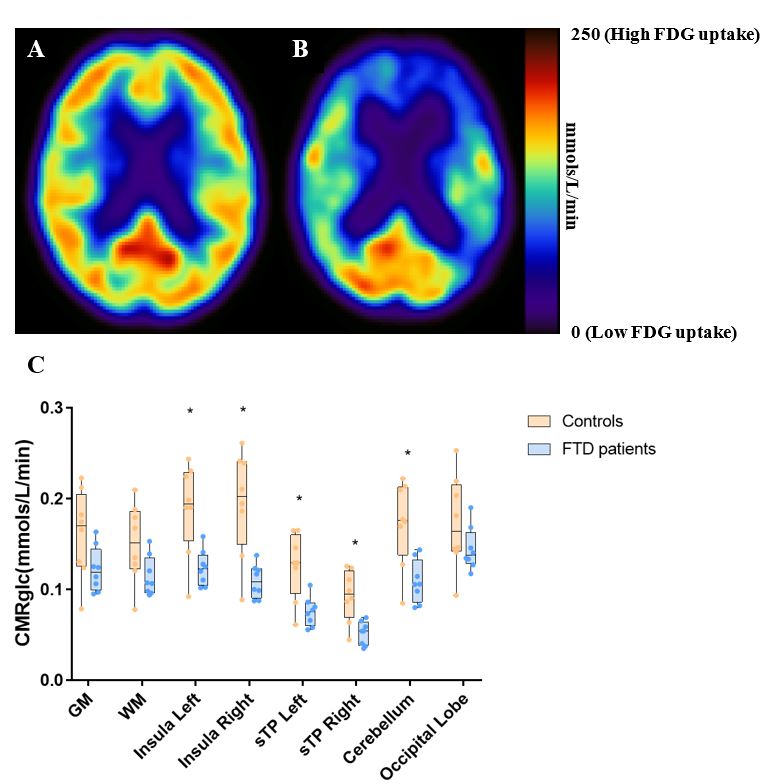
Figure 4. The corresponding CMRglc map generated in CALIPER
using Patlak graphical approach for (A). a healthy human control and (B). a
patient with FTD. (C). Two-sample t-test indicating comparison between healthy
controls and patients with FTD significant changes are observed in insula left
and right, superior temporal gyrus (sTP) left and right and cerebellum
(p<0.05).