2193
CONN-NLM: a novel CONNectome-based Non-Local Means filter for PET-MRI denoising1School of Biomedical Engineering, The University of Sydney, Sydney, Australia, 2Faculty of Medicine and Health, The University of Sydney, Sydney, Australia, 3Brain and Mind Centre, The University of Sydney, Sydney, Australia, 4Sydney Imaging, The University of Sydney, Sydney, Australia
Synopsis
Recent advances in hybrid PET-MRI systems enable simultaneous acquisition of PET and MR data. PET is used to visualize and measure biochemically-specific metabolic processes, but has limited spatial resolution and signal-to-noise ratio. Combining diffusion MRI (dMRI) and PET data, which provide highly complementary information (e.g. structural connectivity and molecular information), has rarely been exploited previously in image postprocessing. The proposed CONNectome-based Non-Local Means (CONN-NLM) exploits synergies between dMRI-derived structural connectivity and PET intensity information to denoise PET data. This method is based on the rationale that structurally-connected voxels and voxels with similar intensity should be highly weighted when smoothing noise.
Introduction
Recent advances in hybrid PET-MRI systems enable simultaneous acquisition of PET and MR data, providing new opportunities in research and clinical applications.1 PET is used to visualize and measure biochemically-specific metabolic processes, but has limited spatial resolution and signal-to-noise ratio.2 Combining diffusion MRI (dMRI) and PET data, which provide highly complementary information (e.g. structural connectivity and molecular information), has rarely been exploited in image postprocessing. The proposed CONNectome-based Non-Local Means (CONN-NLM) filter exploits synergies between dMRI-derived structural connectivity and PET intensity information to denoise PET data. Motivated by anatomical-NLM in PET/CT 3 and connectome-based cortical smoothing in EEG, 4 this method is based on the rationale that structurally-connected voxels and voxels with similar intensity should be highly weighted when computing the weighted-average. We developed a realistic PET-MRI simulation framework to test CONN-NLM.Methods
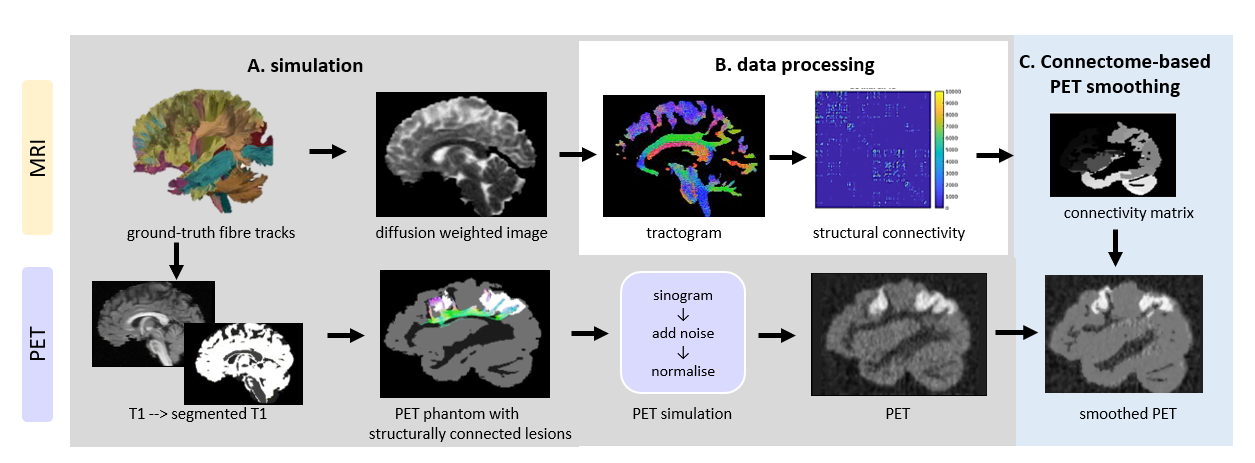
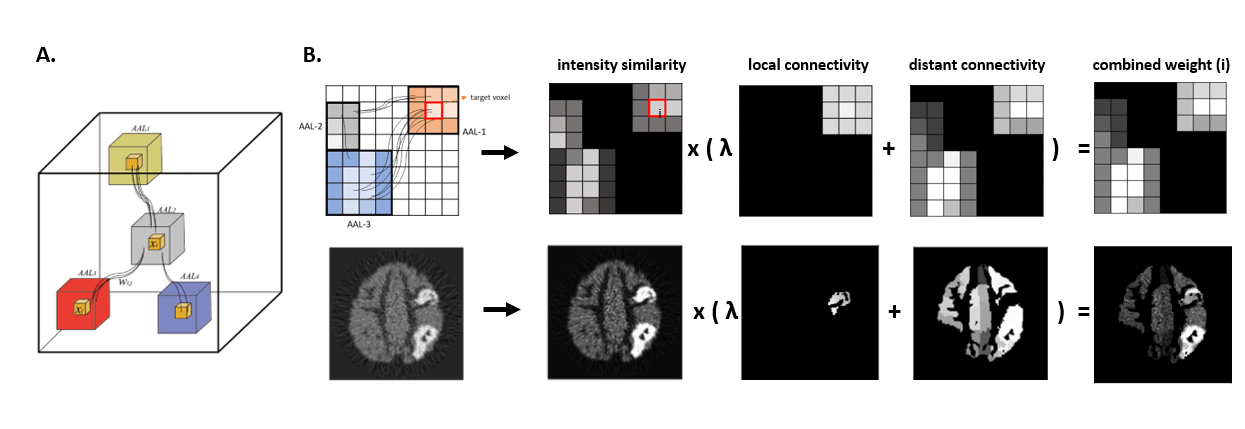
Simulation framework: a novel framework is proposed (fig. 1A) to simulate realistic PET-MRI data for testing/validating CONN-NLM. dMRI is simulated using Fiberfox, 5,6 and processed using MRtrix3.7 Based on dMRI structural connectivity matrix, pairs of highly-connected regions are constructed by dilating fibre endpoints (to simulate high-intensity connected lesions) and combined with segmented T1 as input for analytical PET simulation using ASIM; 8 after adding realistic Poisson noise, the resulting sinograms are reconstructed with STIR FBP3DRP 9 to produce the noisy PET images for optimisation/testing.CONN-NLM: A novel filtering method which combines dMRI structural connectivity and PET intensity similarity information is proposed (fig. 2). The original non-local means (NLM) filter 11 smooths voxel i by the weighted-average for all voxels j in a search window; here, j is any voxel in the AAL 10 parcellation:
$$NL_{i,j}=\exp\biggl(-\frac{(x_i-x_j)^2}{h^2} \biggr)$$
$$h^2=C\times\sigma_{PET}^2$$
where x denotes intensity value, h the smoothing strength (proportional to PET noise level, and constant C controls the smoothing strength): voxels with similar intensity are weighted highest. A hybrid connectivity measurement A is also introduced as: 4
$$A={\lambda}A_{dist}+A_{loc}$$
$${\lambda}=\frac{\lambda_{dist}}{\lambda_{loc}}=B\times\sigma_{TDI}^2$$
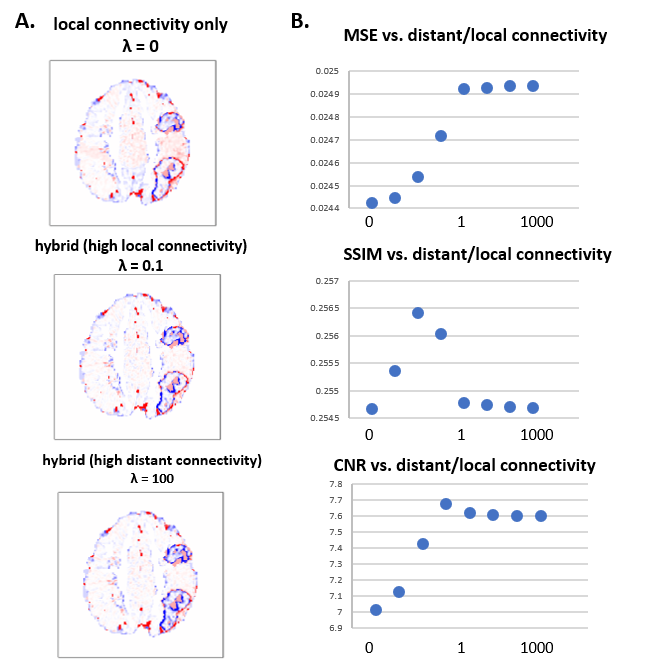
Adist is derived from connectivity to other AAL nodes and Alocal from the spatial adjacency of voxels within the same node. λ regulates the distant/local connectivity balance and is set proportional to track-density image (TDI) 12 variance, to account for the connectome sensitivity to tracking quality: worse-quality data (reflected as lower TDI contrast) leads to less reliable connectome, hence distant connectivity is weighted less. Combining intensity similarity and connectivity:
$$W_{i,j}=NL_{i,j}A=\exp\biggl(-\frac{(x_i-x_j)^2}{h^2} \biggr)({\lambda}A_{dist}+A_{loc})$$
the normalised weighted-average at voxel i becomes:
$$x_{CONN\_NLM_{i}}=\sum_{j}x_{i}W_{i,j}/\sum_{j}W_{i,j}$$
Results
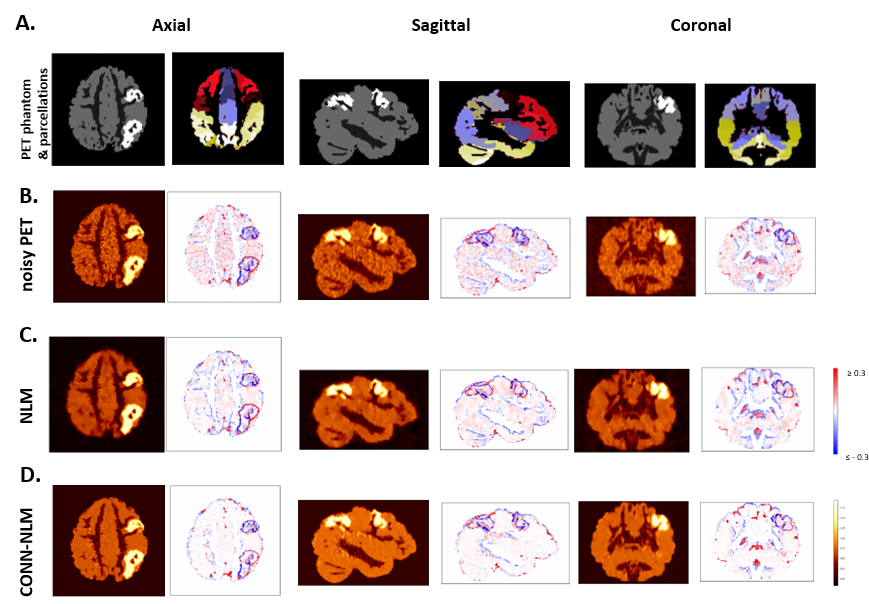
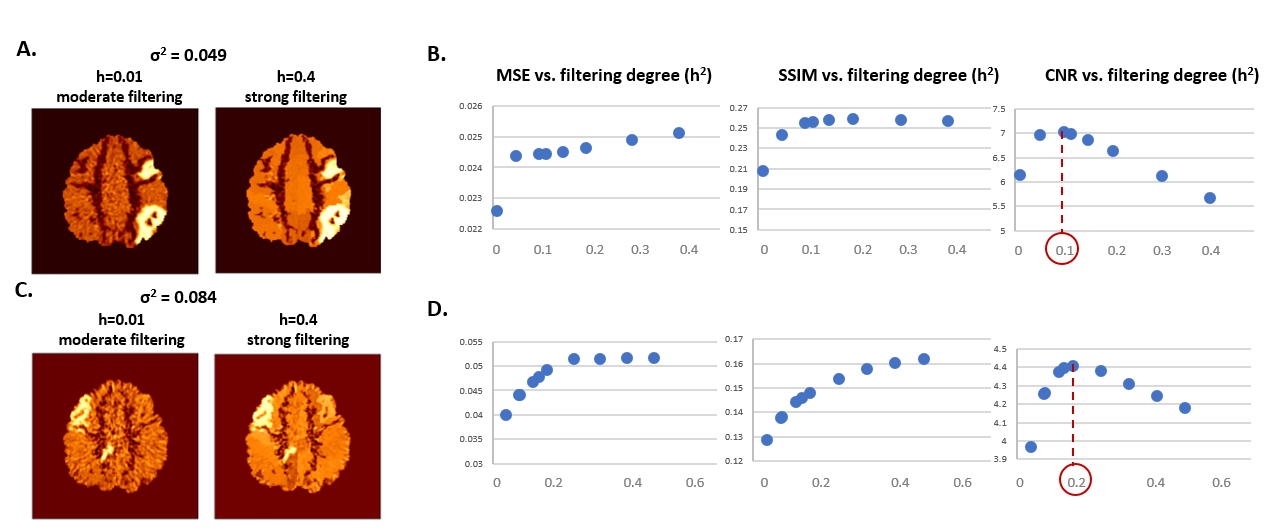
Figure 3 shows that CONN-NLM has the capacity to improve the overall PET image quality in gray matter while enhancing lesion contrast-to-noise ratio. CONN-NLM demonstrated further improvement relative to NLM without connectivity information. Figure 4 shows the effect of filtering strength on performance is consistent across noise levels and lesion patterns. An optimal filter parameter C can be estimated by inspecting the ratio of h2 to the overall variance before filtering. Figure 5 explores the effect of distant/local connectivity ratio, suggesting that the proposed hybrid connectivity model improves overall performance.Discussion
CONN-NLM has unique advantages of providing more informative and accurate PET smoothing by adding complementary structural connectivity information from diffusion MRI. For example, clinical research has established correlations between properties of structural tract and tau accumulation measured by PET.13 The CONN-NLM method represents a new avenue to exploit synergies between diffusion MRI and PET.Acknowledgements
No acknowledgement found.References
- Shah, N. (2019). Hybrid MR-PET imaging: systems, methods and applications. Cambridge: Royal Society of Chemistry.
- Chen, Z., Jamadar, S. D., Li, S., Sforazzini, F., Baran, J., Ferris, N., … Egan, G. F. (2018). From simultaneous to synergistic MR-PET brain imaging: A review of hybrid MR-PET imaging methodologies. Human Brain Mapping, 39, 5126–5144.
- Chan, C., Fulton, R., Barnett, R., Feng, D. D., & Meikle, S. (2014). Postreconstruction Nonlocal Means Filtering of Whole-Body PET with an Anatomical Prior. IEEE Transactions on Medical Imaging, 33(3), 636–650.
- D. K. Hammond, B. Scherrer, and S. K. Warfield, “Cortical graph smoothing: A novel method for exploiting dwi-derived anatomical brain connectivity to improve EEG source estimation,” IEEE Trans. Med. Imaging, vol. 32, no. 10, pp. 1952–1963, 2013.
- P. F. Neher, F. B. Laun, B. Stieltjes, and K. H. Maier-Hein, “Fiberfox: Facilitating the creation of realistic white matter software phantoms,” Magn. Reson. Med., 2014.
- Maier-Hein, Klaus, Neher, Peter, Houde, Jean-Christophe, Caruyer, Emmanuel, Daducci, Alessandro, Dyrby, Tim, … Descoteaux, Maxime. (2015). Tractography Challenge ISMRM 2015 Data [Data set].
- J. D. Tournier et al., “MRtrix3: A fast, flexible and open software framework for medical image processing and visualisation,” NeuroImage. 2019.
- B. Elston, C. Comtat, R. Harrison, and P. Kinahan, “ASIM: An analytic PET simulator,” Monte Carlo Calc. Nucl. Med. Appl. Diagnostic Imaging, 2012.
- K. Thielemans et al., “STIR: software for tomographic image reconstruction release 2,” Phys. Med. Biol., vol. 57, no. 4, pp. 867–883, Feb. 2012.
- Automated anatomical labelling atlas 3. E.T. Rolls, C.C. Huang, C.-P. Lin, J. Feng, M. Joliot, 2019.
- A. Buades, B. Coll and J. Morel, "A non-local algorithm for image denoising," 2005 IEEE Computer Society Conference on Computer Vision and Pattern Recognition (CVPR'05), San Diego, CA, USA, 2005, pp. 60-65 vol. 2.
- Calamante F, Tournier JD, Jackson GD, Connelly A. Track-density imaging (TDI): super-resolution white matter imaging using whole-brain track-density mapping. Neuroimage. 2010 Dec;53(4):1233-43.
- Jacobs HIL, Hedden T, Schultz AP, Sepulcre J, Perea RD, Amariglio RE, Papp KV, Rentz DM, Sperling RA, Johnson KA. Structural tract alterations predict downstream tau accumulation in amyloid-positive older individuals. Nat Neurosci. 2018 Mar;21(3):424-431.
Figures