2184
High resolution PET image denoising using anatomical priors by K-nearest neighborhood method in the feature space1Radiology, Stanford University, Stanford, CA, United States, 2Engineering Dept., GE Healthcare, Waukesha, WI, United States, 3Neurology, Stanford University, Stanford, CA, United States
Synopsis
After PET images are reconstructed by OSEM, a spatial filter which exploits the correlation between neighboring voxels, is applied to remove noise. A new filtering method is proposed that also exploits the correlation between voxels from the same tissue. Anatomical priors are processed for bias correction and registered to PET images. For each voxel, similar voxels within the PET volume are identified using KNN method in the feature-space built by anatomical priors. These similar voxels and also the neighboring voxels are then used to remove the high frequency noise on PET images using a Gaussian and a weighted averaging filter.
Objectives
Existing approaches for controlling PET image noise can be divided into two categories. One approach is post-processing after the iterative reconstruction is complete (for instance using Ordered Subset Expectation Maximization or OSEM); and in another way it is done in each iteration during reconstruction. The latter approach is called penalized likelihood method1-2 , an example of which is Block Sequential Regularized Expectation Maximization or BSREM. Recently, a new method was introduced that uses anatomical priors to control image noise and to achieve high image resolution within the BSREM method.3 However, BSREM is computationally expensive and requires balancing a weighting factor between controlling the image noise and image sharpness which may vary for different studies. Here we present a new way to use anatomical priors in the post processing of PET images, which is faster than BSREM method and can be easily applied to PET studies on any PET/MR scanner.Theory and Methods
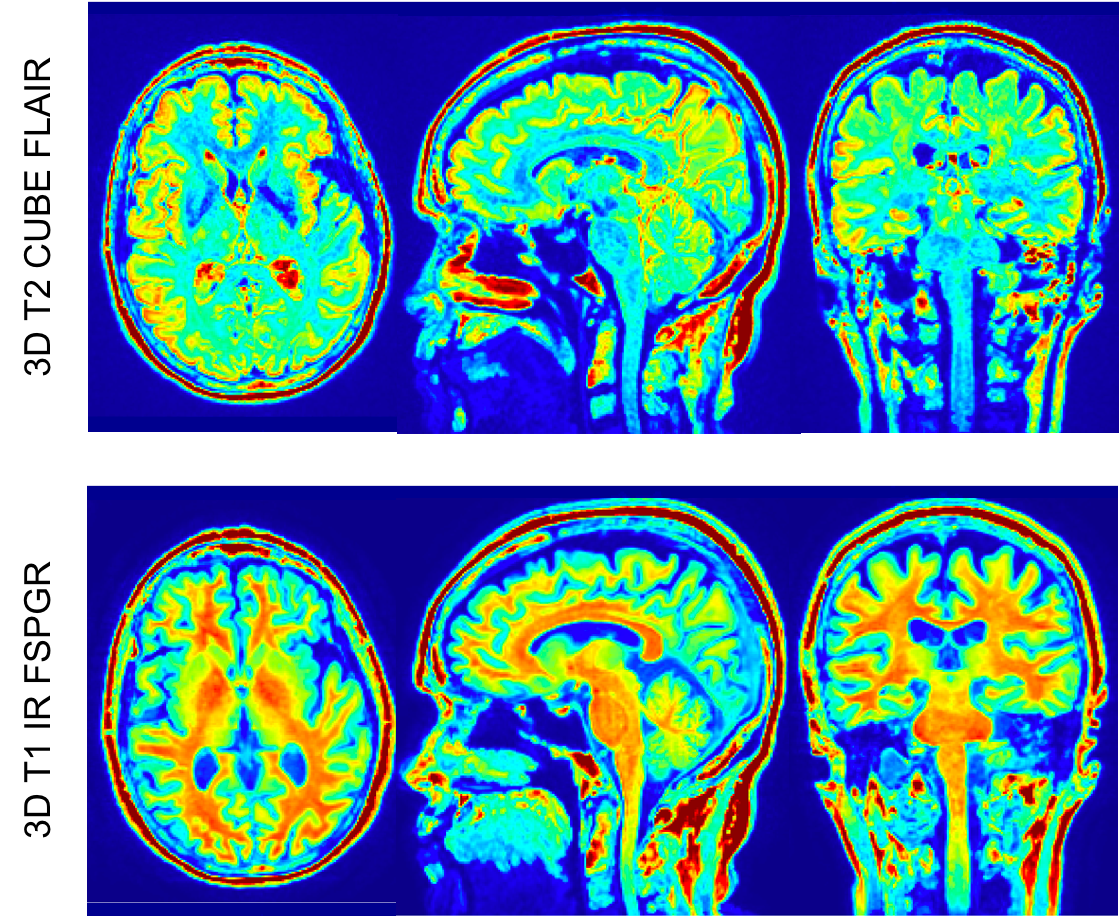
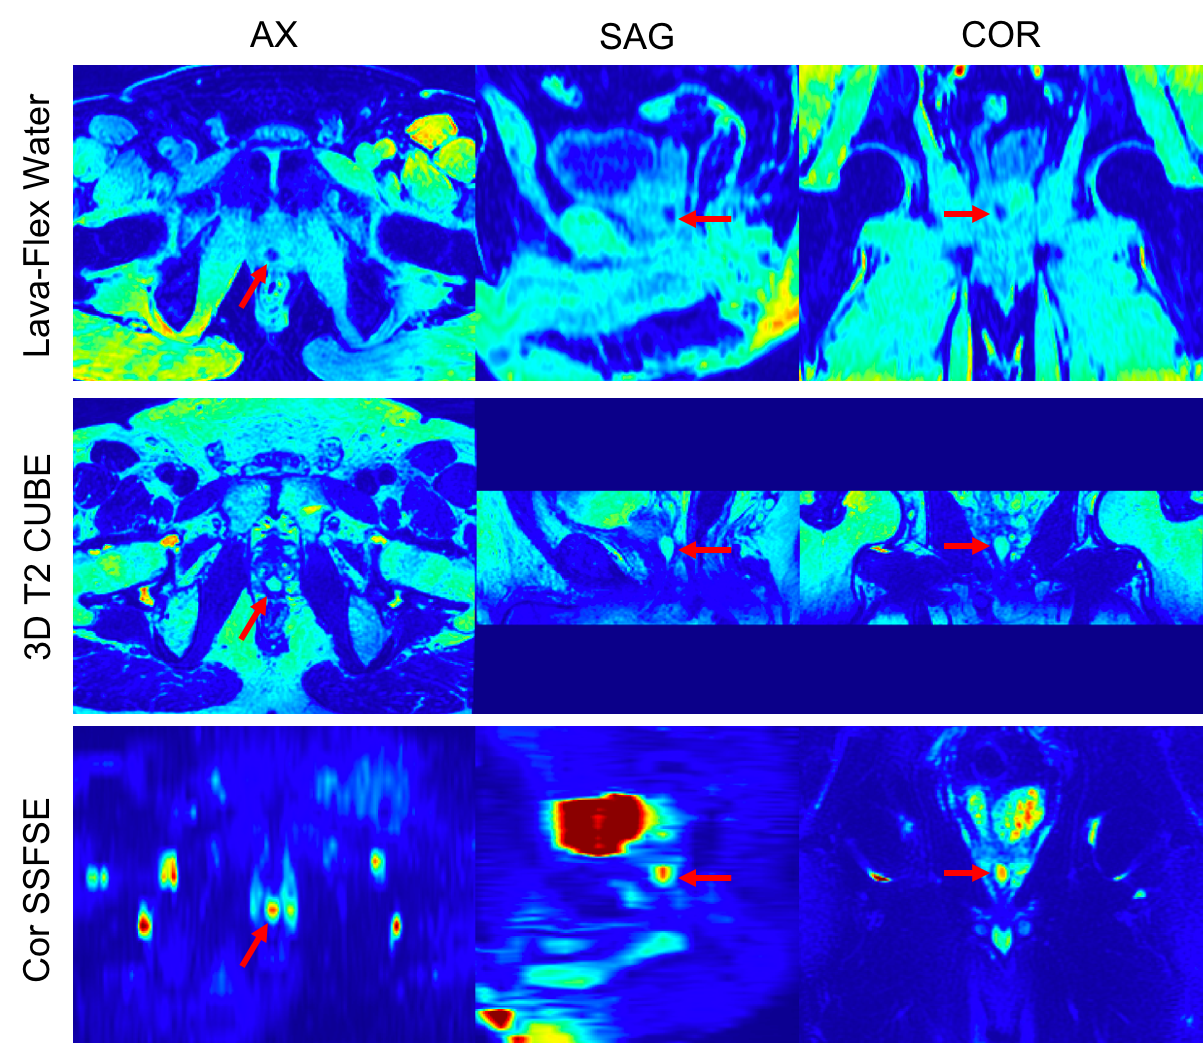
In a conventional OSEM PET reconstruction method, the PET images are filtered in the post processing to remove high frequency spatial noise. These filters (such as Gaussian filter) exploit the spatial correlation between adjacent voxels to filter noise. Here, in addition to the spatial filter, we apply another denoising method which is based on anatomical priors and exploits the correlation between similar voxels. First the anatomical images are co-registered with PET images and corrected for background bias. Then they are normalized to the mean intensity of tissues in each series. These images are then mapped to a feature space where each voxel is represented by a point with its values in each anatomical volume set. For each voxel in the PET image volume, the close vicinity of that voxel in the feature space is searched to find its K-nearest neighbors, which are then used to calculate a weighted average for that voxel in the PET image volume. At the end a low-pass spatial filter is applied to remove any remaining high frequency noise. The application of KNN denoising and lowpass spatial filter can be repeated iteratively for further image noise reduction, if desired.One subject was injected with 8.1 mCi of 18F-FlorBetaben (FBB) and underwent a 20-minute brain scan 90 min post injection on a SIGNA PET/MR (GE Healthcare, Waukesha, WI). 3D T1 IR FSPGR and 3D T2 FLAIR CUBE images were acquired simultaneously with PET. Another subject was injected with 5 mCi of 68Ga-RM2 and after 45 min uptake time, they underwent a 20 min prostate exam on SIGNA PET/MR (GE Healthcare, Waukesha). T2 CUBE and DWI were acquired simultaneously with PET. Both studies were approved by Stanford's Institutional Review Board and all subjects provided written consent. The PET images were reconstructed with TOF-OSEM with 1 mm isotropic resolution. The anatomical images were co-registered with the PET volume and corrected for background bias and normalized to their mean intensity over all tissues and then mapped into the feature space. A neighborhood within 3 mm radius around each voxel was searched to find the 25 nearest neighbors of that voxel which are then used to calculate a weighted average for that voxel in the PET image volume. The weights were calculated based on the distance between each neighboring voxel to the central voxel. A Gaussian filter with a 2 mm spatial cut-off frequency was then applied to remove any remaining high frequency noise. The KNN and the Gaussian filter were applied 2 times iteratively to produce the final images.These images were compared to the conventional Gaussian filter with a 4 mm spatial cut-off.
Results
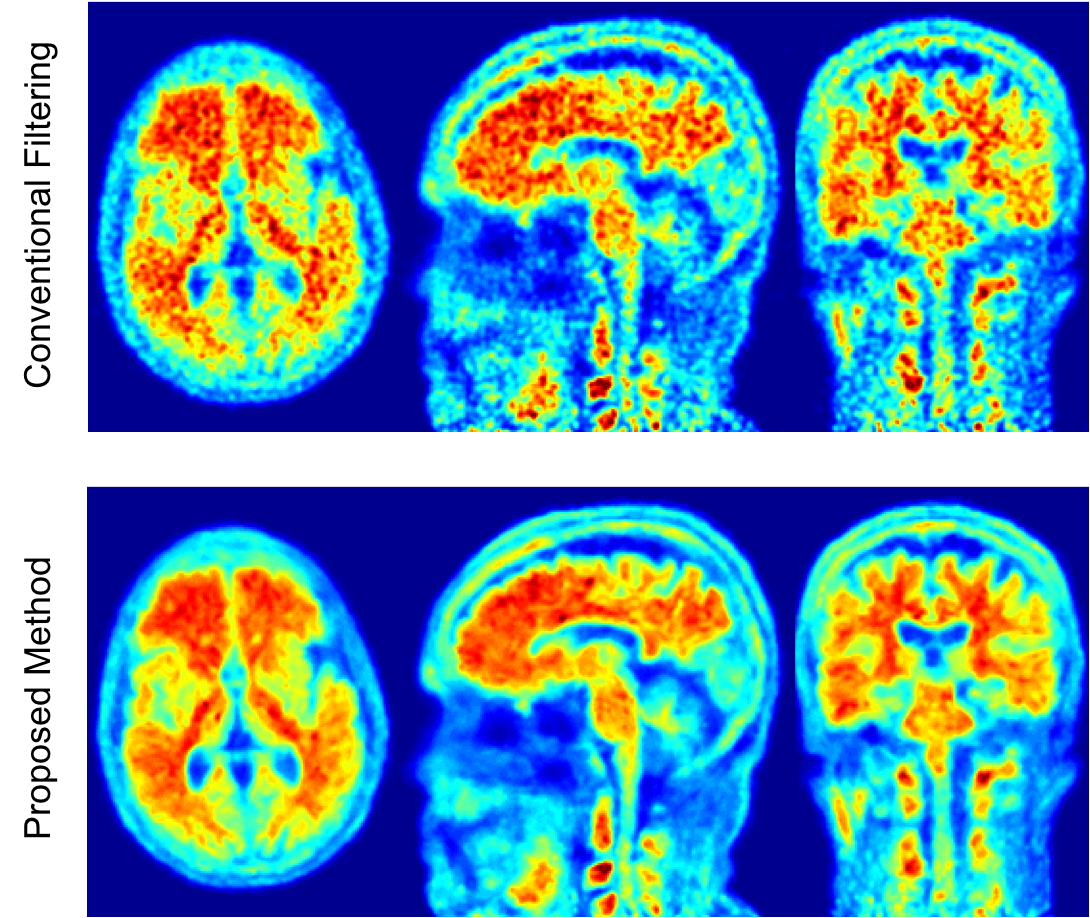
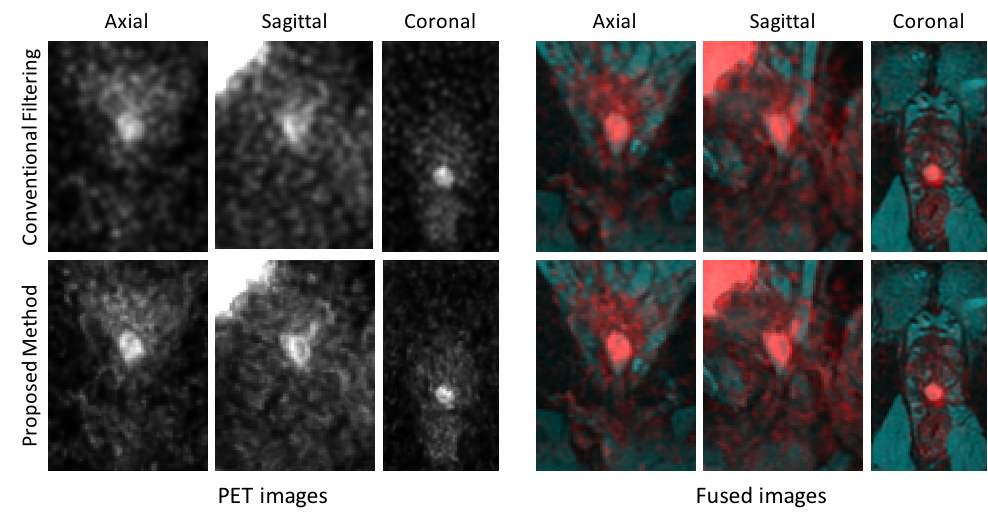
Figures 1 and 2 show the anatomical images for the brain and prostate studies after background correction, registration and normalization. Figures 3 and 4 show a comparison of brain and prostate PET images with both conventional denoising method and the proposed denoising method. The proposed method exhibits a higher SNR and image resolution compared to the conventional Gaussian filter on both subjects.Discussions
In the KNN denoising method, the number of anatomical series is not limited, and any co-registered anatomical images (MR, CT, …) can be used to form the feature space. The PET images are reconstructed completely independent of the anatomical priors. By searching in a small vicinity of each voxel (e.g. 3 mm radius from each voxel) we prevent any artifact arising from mismatches between anatomical priors and true activity as the spatial resolution of most commercially available PET detectors is about 4-6 mm depending on the distance from the iso-center. This denoising method can be validated by a Hoffman phantom or by applying it on a short frame with low SNR and comparing the results with a longer frame. Both proposed validation methods have advantages and disadvantages of their own but a combination of them will provide more insights into the method.Acknowledgements
GE Healthcare.References
1. Teoh EJ, McGowan DR, Macpherson RE, Bradley KM, Gleeson FV. Phantom and clinical evaluation of the Bayesian penalized likelihood reconstruction algorithm Q. Clear on an LYSO PET/CT system. Journal of Nuclear Medicine. 2015;56(9):1447-1452.
2. Sah BR, Stolzmann P, Delso G, et al. Clinical evaluation of a block sequential regularized expectation maximization reconstruction algorithm in 18F-FDG PET/CT studies. Nuclear medicine communications. 2017;38(1):57-66.
3. Khalighi MM, Deller T., et Al. High Quality Isotropic Whole-body PET Imaging Using MR Priors. J Nucl Med May 1, 2020 vol. 61 no. supplement 1 1477
Figures