2180
Deep Learning Reconstruction of MR Fingerprinting for simultaneous T1, T2* mapping and generation of WM, GM and WM lesion probability maps1Computer Assisted Clinical Medicine, Medical Faculty Mannheim, University Heidelberg, Mannheim, Germany, 2Magnetic Resonance Systems Lab, Department of Imaging Physics, Delft University of Technology, Delft, Netherlands, 3Mannheim Institute for Intelligent Systems in Medicine, Medical Faculty Mannheim, University Heidelberg, Mannheim, Germany, 4Center of Neuroimmunology, Laboratory of Advanced Imaging in Neuroimmunological Diseases, Hospital Clinic Barcelona, Universitat de Barcelona, Barcelona, Spain, 5Department of Neurology, Medical Faculty Mannheim, University Heidelberg, Mannheim, Germany
Synopsis
A single deep learning regression network was trained for unified reconstruction, distortion correction and denoising of T1, T2*, WM, GM and lesion probability maps from MRF-EPI acquisition. The network was trained with binary lesion masks and the WM, GM probability maps generated with SPM. The training T1 and T2* maps were reconstructed using dictionary matching. The relative deviation was 7.6% for the 5 output mask in the whole brain between the proposed deep learning network and the conventional processing. Dice coefficients were 0.85 for WM and GM and 0.67 for the lesions with a lesion detection rate of 0.83.
Introduction
Deep learning emerged in the field of MRI in the last years and showed promise, especially in speeding up reconstruction pipelines compared to conventional methods. Numerous of publications showed the benefit of using convolutional neural networks (CNN) for MRI image processing, as denoising, distortion correction, segmentation, classification, and reconstruction.[1,2,3] The large number of images acquired for quantitative MRI is amenable to processing with CNNs, especially MRF where thousands of images my be acquired in short scan times.[4,5] Rieger et al.[6] proposed an MRF sequence based on an echo-planer imaging readout for quantification of T1 and T2* maps with whole brain coverage in less than 5 minutes. In contrast to conventional MRF, MRF-EPI does not apply ultra-high acceleration factors, therefore, only 35 contrast weightings are acquired. In this work a U-net was trained for reconstructing distortion corrected and denoised T1 and T2* maps. Additionally our network generates WM, GM probability maps and probability maps of white matter lesions all combined within one network architecture.Methods
An MRF sequence based on an echo-planar imaging (EPI) readout was acquired across two sites. 6 healthy subjects and 18 patient with white matter lesions at a 3T scanner (Magnetom Skyra, Siemens Healthineers) were scanned at site 1 and 24 patient with white matter lesions a 3T scanner (Magnetom Prisma, Siemens Healthineers) in site 2. The sequence parameters for both scanners were FOV = 240 x 240 mm, matrix size = 240 x 240, slice thickness = 2 mm, GRAPPA factor = 3, partial fourier = 5/8, varying flip angle α (17-43°), TE (16-76.5 ms), TR (3530-6370 ms). At site 2, simultaneous multi-slice imaging was additionally used with an acceleration factor of 3. A U-net for the reconstruction of T1, T2* maps, WM-, GM and lesion probability maps. Reference WM and GM probability maps were generated using SPM. White matter lesions were annotated manually by an expert radiologist. Lesions were annotated three times with a time gap of one year, one week and one day between the annotations. Intra-observer variability was calculated as the average of the dice coefficient between the annotations. For the conventional processing T1 and T2* maps were denoised before applying patter matching and distortion correction onto T2-weighted images using a non-rigid registration. The mean squared error as loss function with patch-wise training of 64 random patches per slice, a mini batch-size of 64 and a learning rate of 10-4 was used. Slices containing white matter lesions of a volume bigger than 100ml were augmented by a factor of five to overcome the small overall volume of the lesions compared to the whole brain. The dice coefficient was calculated by binarizing the WM and GM maps at a threshold of 80%.Results
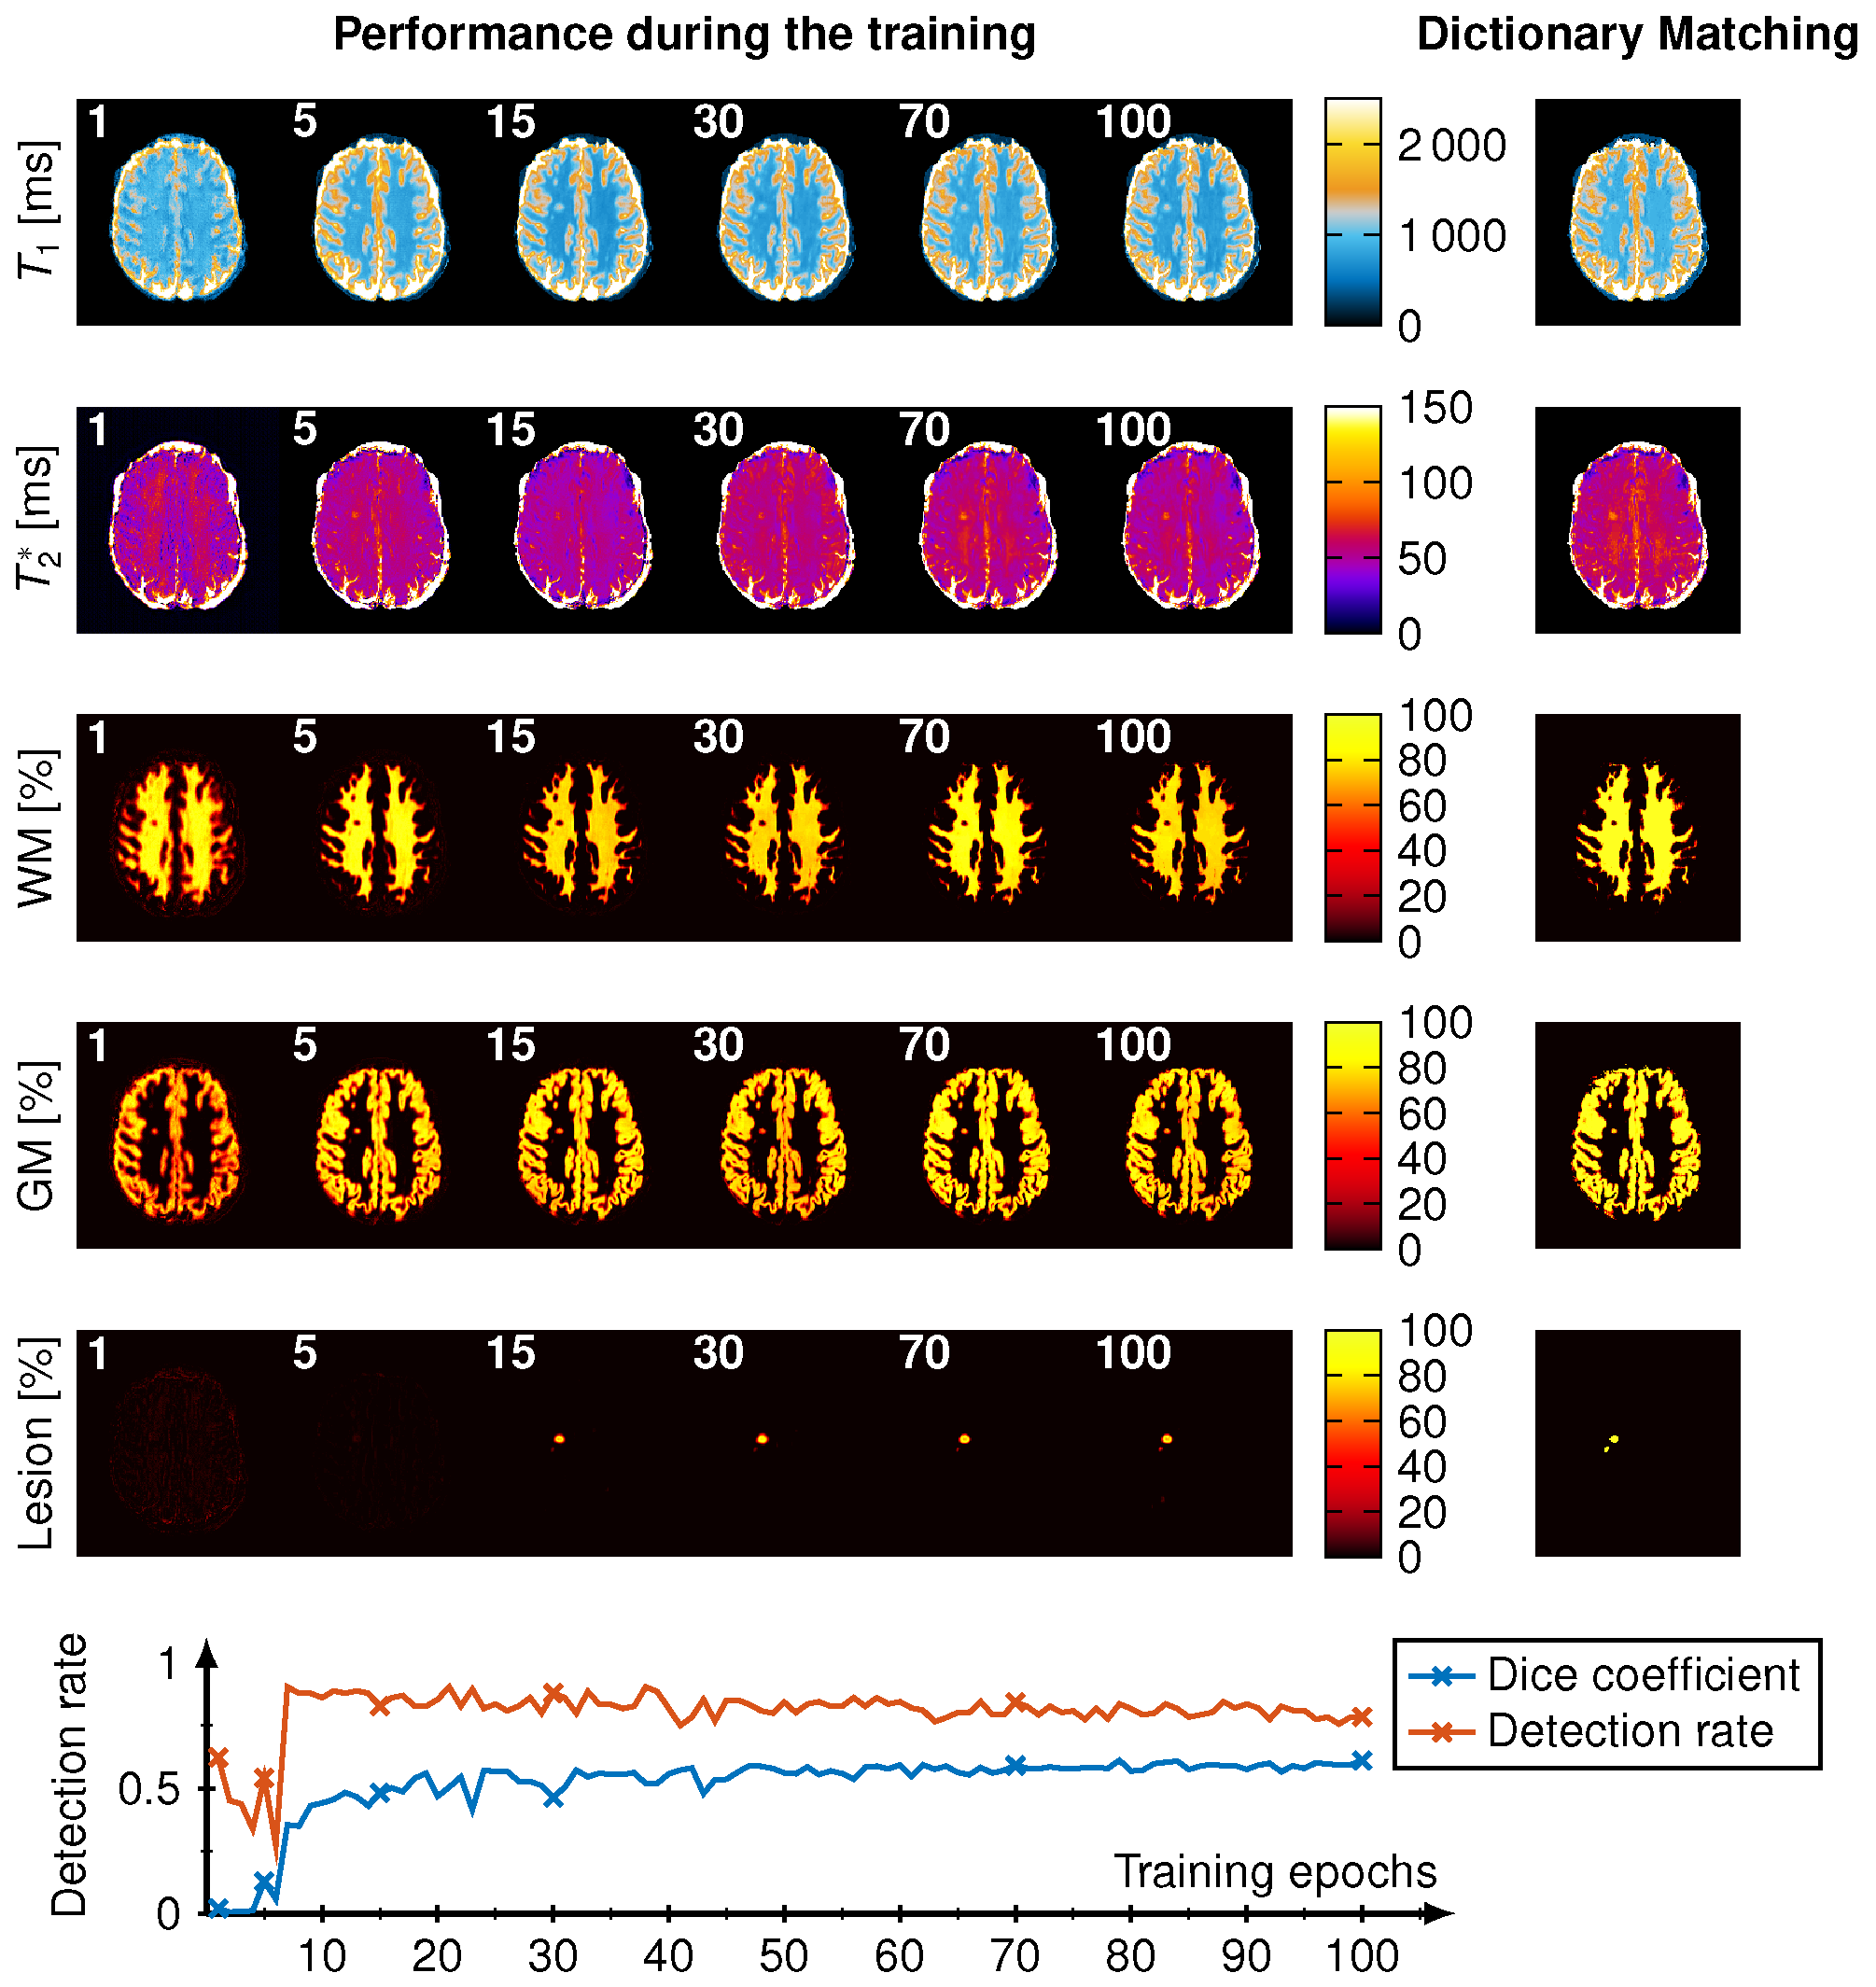
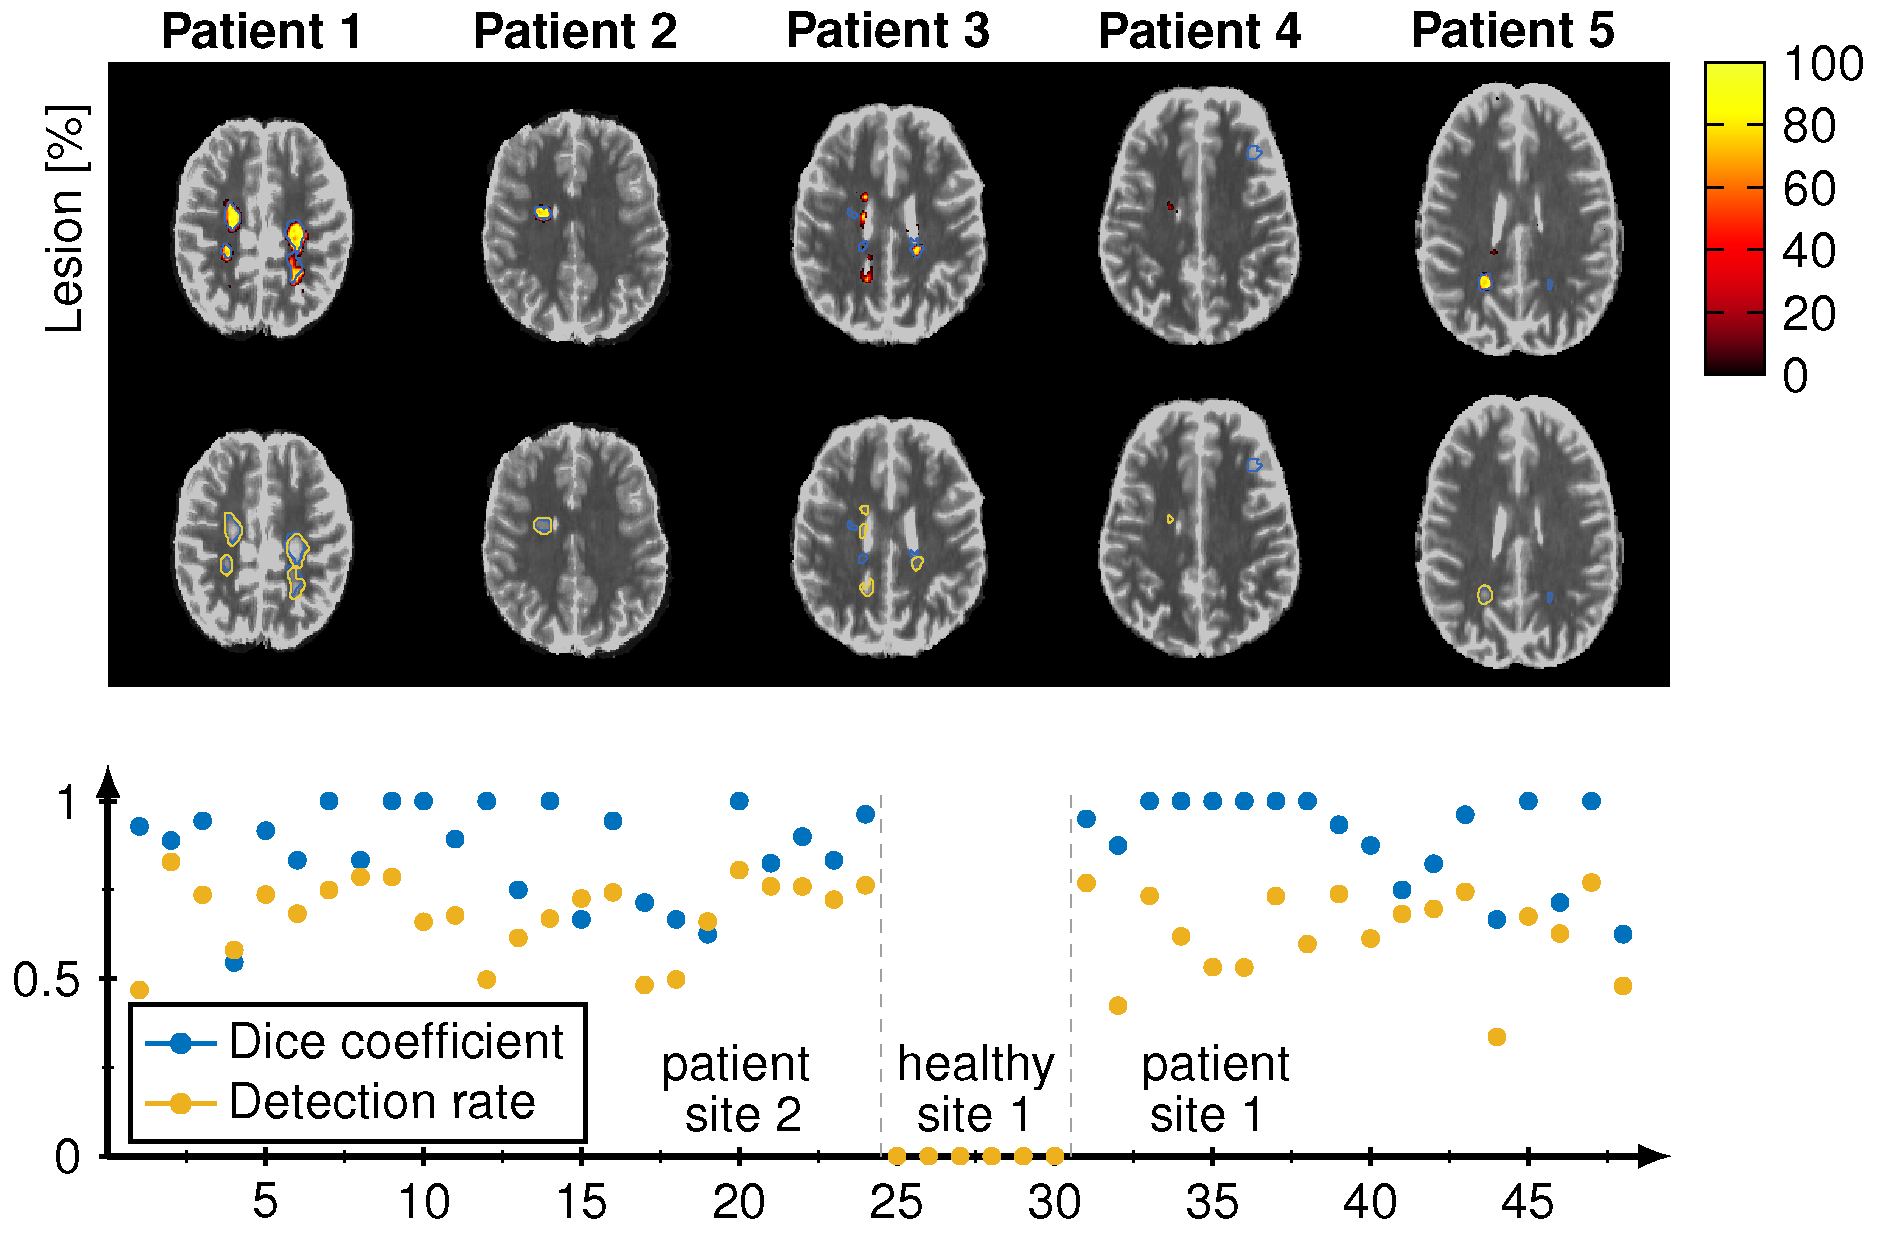
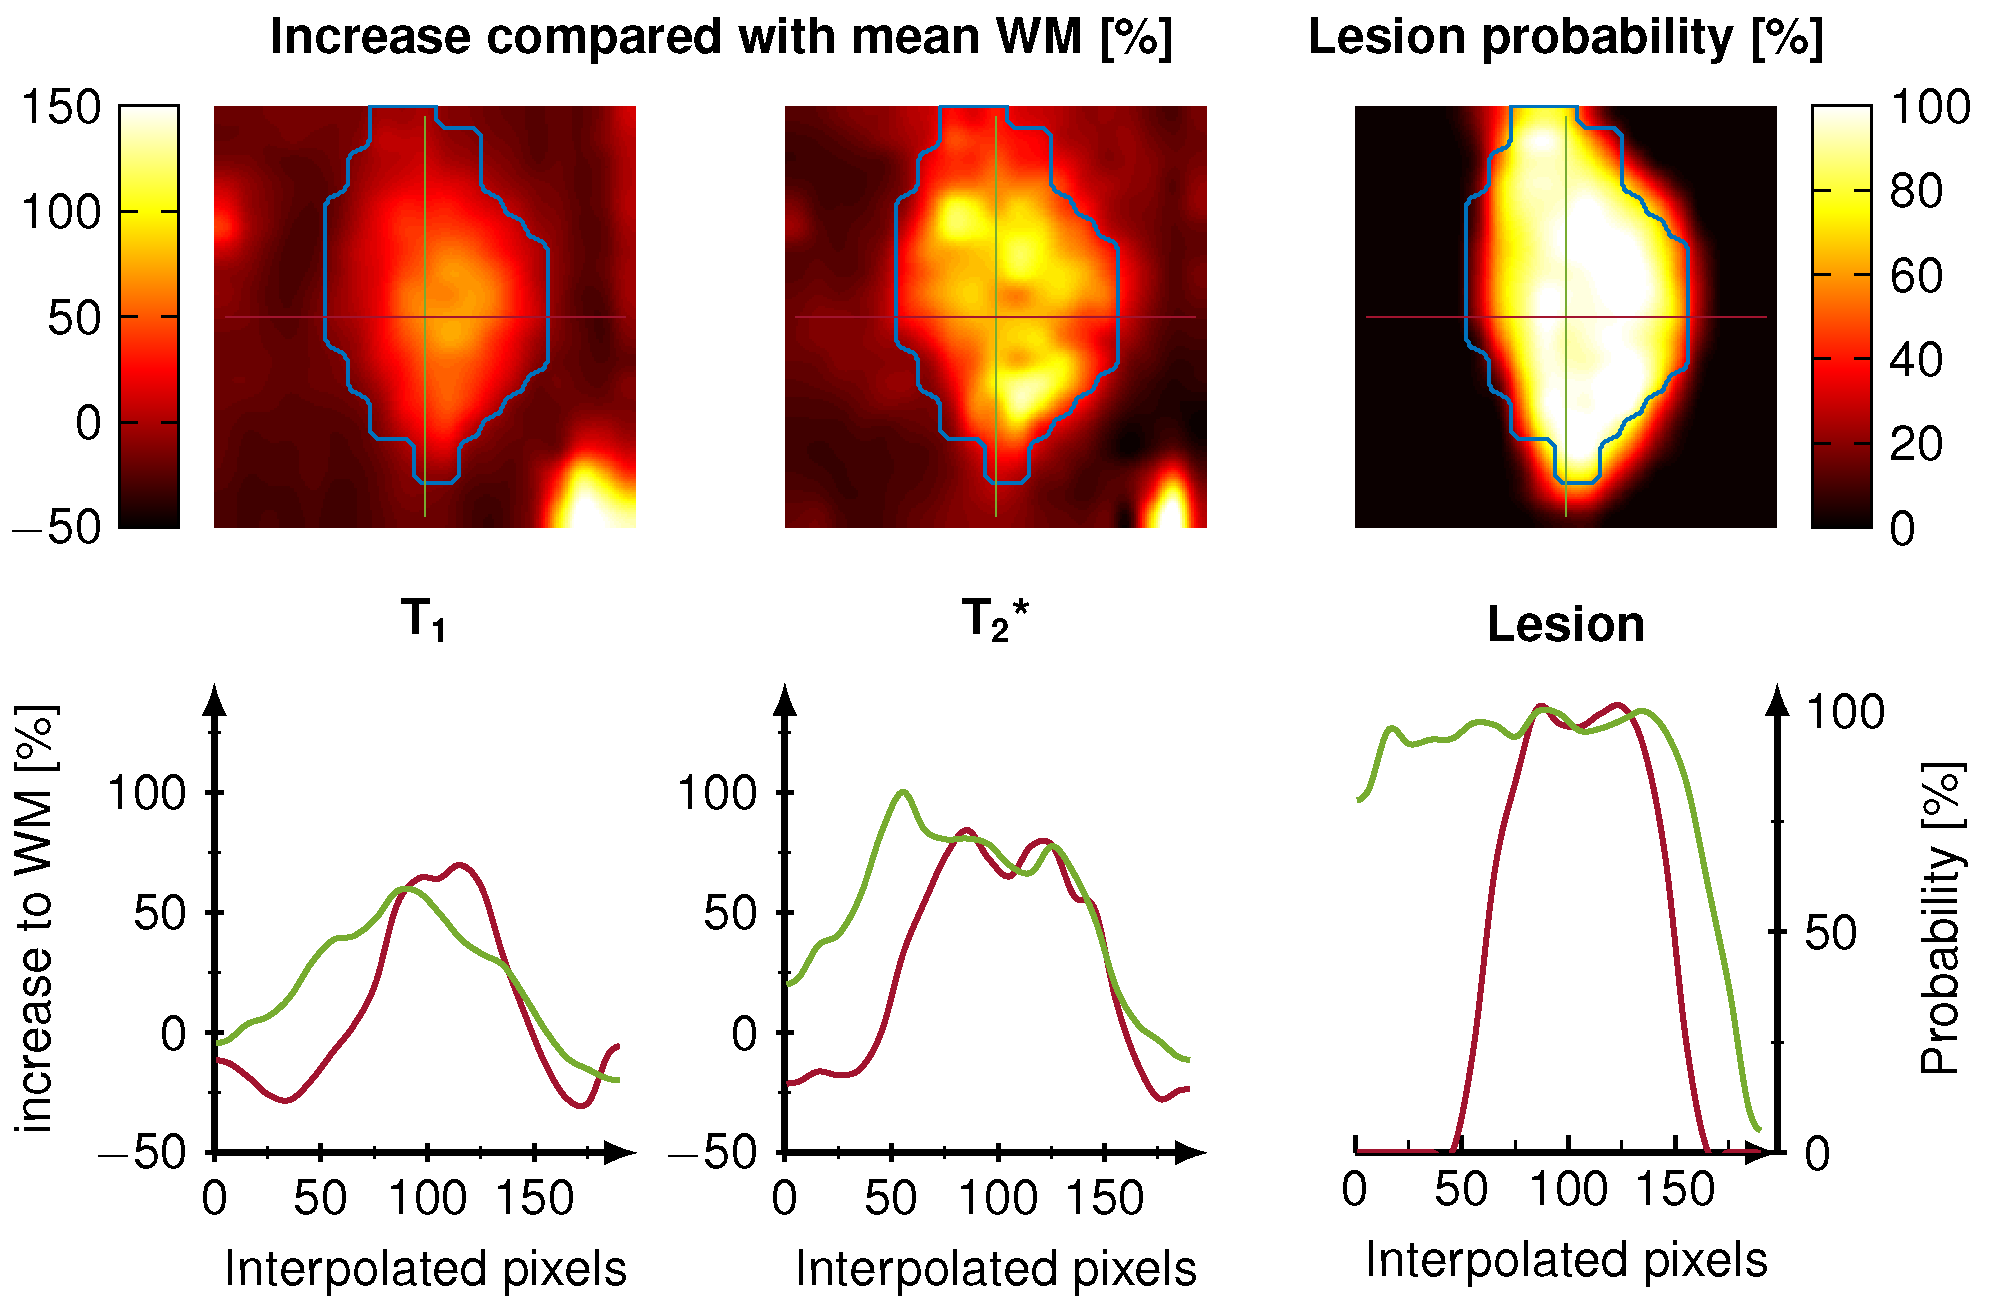
Our CNN showed good agreement to the conventional pattern matching reconstruction for T1 and T2* with an average 7.6% relative deviation in the whole brain. The dice coefficient of the binarized WM and GM masks were both 0.85 and the average dice coefficient for the detected lesions were 0.67 with a lesion detection rate of 0.83. Intra-observer variability of the lesion annotation was 0.57±0.25. Figure 1 shows the reconstruction during the training. The dice coefficient and lesion detection rate converges for the training after 100 epochs. WM and GM probability maps are visually in good agreement with the reference, however, at the border of GM and WM a reduced probability is observed. Figure 2 shows the lesion reconstructed by the CNN (color encoded) and the manual annotations (blue line) for five different patients. Below the dice coefficient and lesion detection rate show a converging for the training reaching 100 epochs. Figure 3 depicts the voxel-wise increase in WM and the lesion probability of on lesion. The probability of the lesion correlates with the increase in T1 and T2*.Discussion
Our results in this study show that a single CNN is capable of performing the following tasks: reconstruction, denoising, distortion correction and segmentation within on architecture with promising accuracy. WM and GM probability maps were successfully delineated by the CNN showing a good agreement with the reference SPM generated probability maps. The average dice coefficient in lesions (0.67) is comparable to literature (0.47-0.87)[7] and to the intra-observer variability of the manual annotation (0.32-0.83), hence the CNN is more robust and standardized than manual annotation. The CNN delineates the lesions more precisely around structures like the ventricle and at tissue borders. The lesion probability map has an increased probability in the center for intense and large lesions and decreases towards the edges. This additional information may facilitate improved lesion characterization and differentiation of lesions in future. Compared to several hours of post processing for the conventional methods, the proposed CNN only takes around 30 seconds for the reconstruction of one whole brain generating T1, T2* maps and WM, GM and WM lesion probability maps.Conclusion
A single reconstruction CNN is a promising tool for the reconstruction of T1, T2*, WM, GM and white matter lesion probability maps in a fraction of time with potential for new clinical applications and insights.Acknowledgements
No acknowledgement found.References
[1] Lundervold Alexander Selvikvag, Lundervold Arvid. An overview of deep learning in medicalimaging focusing on MRI Zeitschrift f ¨ur Medizinische Physik. 2019;29:102 - 127. SpecialIssue: Deep Learning in Medical Physics.
[2] Benou A., Veksler R., Friedman A., Riklin Raviv T.. Ensemble of expert deep neural networksfor spatio-temporal denoising of contrast-enhanced MRI sequences Medical Image Analysis.2017;42:145 - 159.
[3] Cao X., Yang J., Zhang J., Wang Q., Yap P., Shen D.. Deformable Image Registration Usinga Cue-Aware Deep Regression Network IEEE Transactions on Biomedical Engineering.2018;65:1900-1911.
[4] Fang Z., Chen Y., Liu M., et al. Deep Learning for Fast and Spatially Constrained TissueQuantification From Highly Accelerated Data in Magnetic Resonance Fingerprinting IEEETransactions on Medical Imaging. 2019;38:2364-2374.
[5] Cohen Ouri, Zhu Bo, Rosen Matthew S.. MR fingerprinting Deep RecOnstruction NEtwork(DRONE) Magnetic Resonance in Medicine. 2018;80:885-894.
[6] Rieger Benedikt, Akc¸akaya Mehmet, Pariente Jos´e C., et al. Time efficient whole-braincoverage with MR Fingerprinting using slice-interleaved echo-planar-imaging Sci Rep.2018;8:2045-2322.
[7] Llado Xavier, Oliver Arnau, Cabezas Mariano, et al. Segmentation of multiple sclerosis lesions in brain MRI: A review of automated approachesInformation Sciences. 2012;186:164 - 185.
Figures