2179
8X Accelerated Intervertebral Disc Compositional Evaluation with Recurrent Encoder-Decoder Deep Learning Network
Aniket Tolpadi1,2, Francesco Caliva1, Misung Han1, Valentina Pedoia1, and Sharmila Majumdar1
1Radiology and Biomedical Imaging, UCSF, San Francisco, CA, United States, 2Bioengineering, University of California, Berkeley, Berkeley, CA, United States
1Radiology and Biomedical Imaging, UCSF, San Francisco, CA, United States, 2Bioengineering, University of California, Berkeley, Berkeley, CA, United States
Synopsis
Degeneration of intervertebral discs (IVDs) is correlated with low back pain, but conventional MRI fails to capture early signs of degeneration. Quantitative MRI (qMRI) is sensitive to early degenerative biochemical changes but suffers from long acquisition times. We present a recurrent encoder-decoder architecture that predicts fully sampled IVD T2 maps from spatially and temporally undersampled qMRI echos. The network allows for up to eightfold reduction in acquisition time while exhibiting strong correlation to ground truth maps, maintaining fidelity to T2 values, and retaining textures. With further development, this network can make qMRI a more regular part of lumbar spine imaging.
Introduction
Low back pain (LBP) is the second leading cause of disability in the United States1. LBP causes are complex—including anatomic and spinal mechanics anomalies—but intervertebral disc (IVD) degeneration is correlated with LBP, capable of inducing spinal mechanics alterations and adjacent tissue damage2,3. Early IVD degeneration identification is therefore crucial to manage LBP, but standard approaches rely on conventional Magnetic Resonance Imaging (MRI) or other imaging modalities not sensitive to early IVD degenerative biochemical changes4. Unlike conventional sequences, quantitative MRI (qMRI) techniques like T2 mapping are sensitive to water, proteoglycan, and collagen content, making them more effective in illuminating early degenerative IVD changes5. Additionally, disc degeneration is typically staged by radiologists with Pfirrmann grades subject to inter and intra-reader variability, whereas qMRI of IVDs yields T2 values inversely correlated with degree of disc degeneration, quantitatively and consistently assessing IVD health6,7. Unfortunately, acquisition times for qMRI sequences, such as Magnetization-prepared Angle-modulated Partitioned k-space Spoiled gradient echo Snapshots (MAPSS), are high, making them impractical for clinical use8. qMRI acquisition time reduction could facilitate clinical use, providing quantitative assessments of IVD health for all degenerative stages.Methods
36 lumbar spine MAPSS sequences were acquired among 31 subjects: 8-10 minutes scan time, 20cm FOV, 256×128 acquisition matrix, 6-8mm slice thickness, 10-12 slices, fat suppression, TR=5.8ms, T2 preparation TEs=0, 12, 25, 51ms, T1ρ preparation TSLs=0, 10, 40, 80ms with 500 Hz spin-lock frequency. Acquisitions thus had 7 echos per slice: 3 each unique to T1ρ and T2 and 1 shared TSL/TE=0ms. Acquisitions were split into training/validation/test datasets by subject (21/5/5 by subject, 25/6/5 by acquisition). Echos were registered to the shared TSL/T2=0ms echo using a 3D rigid registration algorithm with a normalized mutual information criterion9. Ground truth T2 maps were calculated slice-by-slice from the 4 T2-weighted echos using a Levenberg-Marquardt algorithm10. Coarse-to-fine context memory networks segmented maps into IVDs11. Coil-combined images from reference T2 echos were Fourier transformed into k-space, and 3D k-space data for all echos was undersampled using a variable-density pattern unique to each echo: the MAPSS sampling ellipse in the ky-kz plane was undersampled from a normal distribution centered at (ky, kz)=(0,0) with a set standard deviation length, repeatedly sampling points until the desired number were sampled. K-space data was shared across echos of the same slice for points sampled in at least one but not all echos, and k-space subsequently zero-filled, yielding spatially undersampled echos.A recurrent encoder-decoder network was designed to take undersampled T2 echos and predict fully sampled T2 maps (Fig. 1). Pipelines accepted 3 or 4 of 4 spatially undersampled T2 echos; 3-echo pipelines thus undersampled MAPSS spatially and temporally. Pipelines were trained at multiple spatial acceleration factors using a multi-component loss function: global L1 loss, IVD-only L1 loss, feature-based loss12, and structural similarity index. Loss function weightings, undersampling pattern standard deviation, and other parameters were optimized in a random hyperparameter search. Pipelines were evaluated on holdout set IVDs through Pearson’s correlation coefficient and normalized mean square error (NMSE). IVD regions were segmented into the nucleus pulposus (NP) and annulus fibrosus (AF) using a k-means clustering algorithm13; pipelines were further evaluated in IVD NP and AF using Gray-Level Co-occurrence Matrix (GLCM)14 metrics and Bland-Altman plots.
Results
Visually, the network reconstitutes T2 maps with strong fidelity to ground truth up to R=3 in the 3-echo pipeline and R=6 in the 4-echo pipeline (Fig. 2). Pearson’s r and NMSE show strong correlation between predicted and ground truth maps and low error rates up to R=4 and R=8 for the 3 and 4-echo pipelines, respectively (Fig. 3).As the 4-echo pipeline sustained stronger performance at higher acquisition time reductions, only its performance is further assessed (Fig. 4, 5). Bland-Altman plots comparing predicted and ground truth T2 values show at select spatial acceleration factors, the network exhibits slight bias for underestimating T2 values in the NP and AF, but largely maintains fidelity to ground truth (Fig. 4). Spearman’s ρ showed that with respect to ground truth, there were significant correlations across tested R values within the NP and AF for GLCM dissimilarity and energy, and in the AF for GLCM homogeneity, α=1.0×10⁻³ (Fig. 5).
Discussion and Conclusions
The recurrent encoder-decoder architecture shows strong performance, particularly for the 4-echo pipelines, in predicting T2 maps from undersampled MAPSS acquisitions: predictions demonstrate strong correlations to ground truth while largely retaining textures. Although the network shows small biases to T2 underestimation, this is clinically preferable to the alternative: underestimated T2 values correspond with poorer IVD health assessment7, which would cause careful monitoring of patients rather than failure to monitor at-risk patients. 4-echo pipeline performance was best up to R=8, facilitating MAPSS T2 mapping acquisition time reduction from 5:398 to 0:42; similar performance is expected for MAPSS T1ρ mapping acceleration. This reduction would transform MAPSS from impractical to implementable for clinical imaging, making qMRI a more regular part of lumbar spine imaging.These findings justify additional investigation into means of further improving map texture retention, reduction of bias in predicted maps, and extension to MAPSS T1ρ mapping acceleration. Further applications include extending these techniques to accept multi-coil, real k-space data rather than retrospectively undersampled coil-combined images, and application to more anatomic regions.
Acknowledgements
We would like to thank Claudia Iriondo for developing an IVD segmentation pipeline crucial to our analyses and Claudia Iriondo, Kenneth Gao, and Felix Liu for feedback on figures and future studies. This study was supported by the NIH/NIAMS grants 1UH2AR076724-01 (S.M.) and R00AR070902 (V.P.).References
- Prevalence and Most Common Causes of Disability Among Adults --- United States, 2005. (2009)
- Ogon I, Takebayashi T, Takashima H et al. Analysis of Neuropathic Pain Using Magnetic Resonance Imaging T2 Mapping of Intervertebral Disc in Chronic Low Back Pain. Asian Spine J. 2019;13(3):403-409.
- Kos N, Gradisnik L, Velnar T. A Brief Review of the Degenerative Intervertebral Disc Disease. Med Arch. 2015;73(6): 421-424.
- Wang C, Auerbach JD, Witschey WRT et al. Advances in Magnetic Resonance Imaging for the assessment of degenerative disc disease of the lumbar spine. Semin Spine Surg. 2007;19(2):65-71.
- Wáng YXJ. Towards consistency for magnetic resonance (MR) relaxometry of lumbar intervertebral discs. Quant Imaging Med Surg. 2016;6(4):474-77.
- Pfirrmann CW, Metzdorf A, Zanetti M et al. Magnetic resonance classification of lumbar intervertebral disc degeneration. Spine (Phila Pa 1976). 2001;26(17):1873-78.
- Xie R, Ruan I, Chen L et al. T2 relaxation time for intervertebral disc degeneration in patients with upper back pain: initial results on the clinical use of 3.0 Tesla MRI. BMC Medical Imaging. 2017;17(9). https://doi.org/10.1186/s12880-017-0182-z
- Li X, Wyatt C, Rivoire J et al. Simultaneous acquisition of T1ρ and T2 quantification in knee cartilage: repeatability and diurnal variation. J Magn Reson Imaging. 2014;39(5):1287-93.
- Weingärtner S. Manual for RView. 2010.
- More JJ. The Levenberg-Marquardt algorithm: Implementation and theory. In: Watson G.A. (eds) Numerical Analysis. Lecture Notes in Mathematics, vol 630. Springer, Berlin, Heidelberg. https://doi.org/10.1007/BFb0067700
- Iriondo C, Pedoia V, Majumdar S. Lumbar intervertebral disc characterization through quantitative MRI analysis: An automatic voxel-based relaxometry approach. Magn Reson Med. 2020;84(3). https://doi.org/10.1002/mrm.28210
- Ledig C, Theis L, Huszar F et al. Photo-Realistic Single Image Super-Resolution Using a Generative Adversarial Network. arXiv Preprint. 2017.
- Pandit P, Talbott JF, Pedoia V et al. T1ρ and T2-based characterization of regional variations in intervertebral discs to detect early degenerative changes. J Orthop Res. 2016;34(8):1373-81.
- Haralick RM, Shanmugam K, Dinstein I. Textural Features for Image Classification. in IEEE Transactions on Systems, Man, and Cybernetics. 1973;3(6):610-21.
Figures

Figure 1: Recurrent encoder-decoder architecture used to predict T2 maps from spatially undersampled MAPSS T2 echos. Initial recurrent network includes connections between processing streams of each echo to exploit temporal correlations. Subsequent encoder-decoder network exploits spatial correlation and predicts final T2 map. The network could be configured for any number of input T2 echos, but the number of filters throughout the encoder-decoder network portion are presented as for 4-echo inputs.
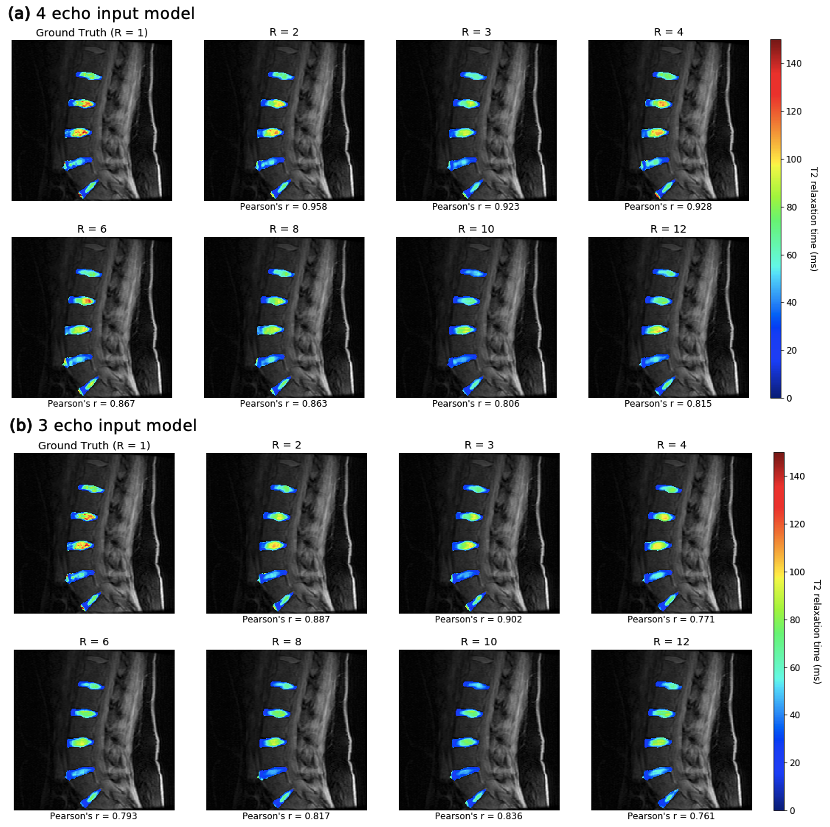
Figure 2: Performance of 3 and 4-echo pipelines in predicting fully sampled T2 maps in an example of holdout set. Pearson’s r is calculated for each map with respect to ground truth. (a) Predicted 4-echo pipeline maps showed fidelity to ground truth up to R=6, and for (b) the 3-echo pipeline, up to R=3. Up to these acceleration factors, maps reconstitute T2 values and preserve NP/AF delineation, and can thus quantitatively assess disc health and reflect early degenerative changes.

Figure 3: (a) Pearson’s correlation coefficient and (b) NMSE for 3 and 4-echo pipelines across holdout set (n=5) with respect to ground truth. Acquisition times resulting from undersampling are shown; estimates are based on 12-slice MAPSS acquisition (5:39 for R=1, 4 echos) with only T2 preparation. Predictions show strong correlation to ground truth and low error up to R=4 for 3-echo and R=8 for 4-echo pipelines, showing eightfold acquisition time reduction is possible while retaining qMRI benefits.

Figure 4: Bland-Altman plots were generated from the holdout set (n=5) for the 4-echo pipeline. In the AF, models across spatial acceleration factors showed fidelity to ground truth, revealing only slight bias to underestimating T2. In the NP, models showed slightly larger bias towards underestimating T2, but the line of equality was well within all limits of agreement. These results show predicted maps show strong fidelity to ground truth T2 in both NP and AF across many spatial acceleration factors.

Figure 5: 3 GLCM metrics—(a) dissimilarity, (b) homogeneity, and (c) energy—were calculated for disc slices of predicted maps in 4 directions (n=84). Sharp contrasts maximize dissimilarity while smoothness maximizes homogeneity and energy. Spearman’s ρ showed significant correlations between predictions and ground truth for all metrics in NP and AF across plotted acceleration factors with these exceptions: homogeneity at R=2, 3, 4, and 8 for NP, α=1.0×10⁻³. Predicted maps thus largely retained textures.