2178
Accelerated cardiac T1 mapping using attention-gated neural networks1Department of Biomedical Engineering, University of Utah, Salt Lake City, UT, United States, 2Utah Center for Advanced Imaging Research, University of Utah, Salt Lake City, UT, United States, 3Department of Cardiology, University of Utah, Salt Lake City, UT, United States
Synopsis
Cardiac T1 mapping has been shown to be a promising method for assessing different cardiomyopathies. Recently, native T1 mapping has been used to identify ischemic regions in coronary artery disease without the use of gadolinium-based contrast agents. Most cardiac T1 mapping methods require long breath holds during the acquisition sequence which can be difficult for patients particularly during exercise or pharmacologically induced stress. Here we proposed using attention-gated neural networks to reduce the acquisition time of native and post-contrast cardiac T1 mapping sequences without significant loss of quality.
Introduction
By using the spin-lattice relaxation time (T1) as a biomarker, cardiac T1 mapping can be used to quantitatively characterize the myocardium. As such cardiac T1 mapping has shown promise in differentiating various cardiomyopathies [1-5]. Recently, stress and rest native T1 mapping were used to detect obstructive coronary artery disease (CAD) without the use of gadolinium-based contrast agents [6-8]. The 5(3)3 and the 4(1)3(1)2 MOLLI sequences [9] are among the most popular T1 mapping sequences that are widely used for native and post-contrast T1 mapping respectively due to their high precision. However, long breath holds during the scans can be difficult for patients particularly during exercise or pharmacologically induced stress. These breath holds result in loss of stress time due to longer rest periods and can lead to poor quality T1 maps. Shorter sequences using 9 heart beats [10] and 10 heart beats [11] have been shown but result in reduced precision compared to the MOLLI sequences [12]. To reduce scan times without compromising the quality of the MOLLI sequences, we propose using attention-gated neural networks to generate high-quality T1 maps from a reduced number of T1-weighted images.Methods
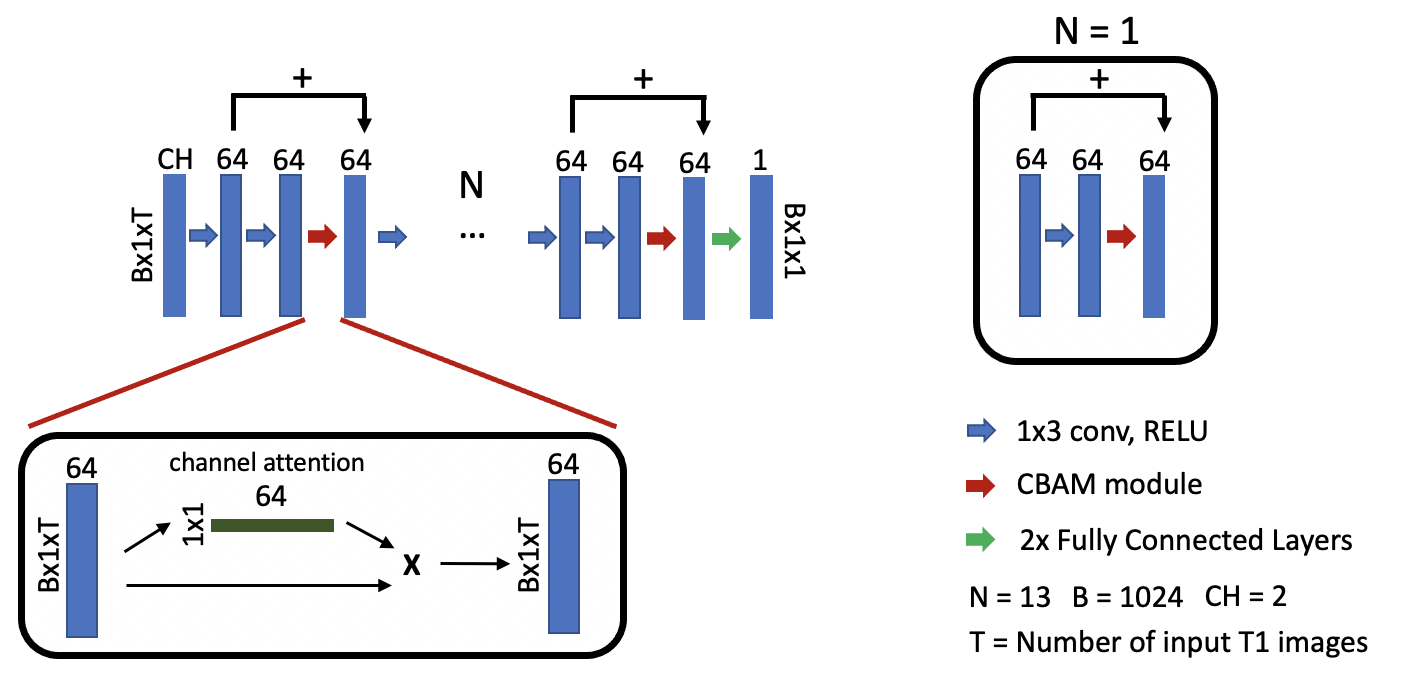
Data Acquisition and Processing439 native T1 mapping datasets from 151 patients and 150 post-contrast datasets from 43 patients were acquired using the 5(3)3 MOLLI sequence and the 4(1)3(1)2 MOLLI sequence respectively. All acquisitions used similar parameters: $$$TR = 2.2$$$ $$$ms$$$, $$$TE = 1.12$$$ $$$ms$$$, and $$$FA = 35^\circ $$$. Pre-contrast networks were trained using the first five acquired T1-weighted images and their corresponding inversion times. Post-contrast networks were trained using the first four acquired T1-weighted images and their corresponding inversion times. These T1-weighted images were motion compensated, cropped to $$$144\times144$$$, and vectorized giving dimensions of $$$B \times CH \times 1 \times T$$$ as input to the network. $$$T$$$ corresponds to the number of input T1 images and inversion times for pre-contrast $$$(T = 5)$$$ and post-contrast $$$(T = 4)$$$ acquisitions. $$$CH$$$ corresponds to the T1-weighted values and their inversion times $$$(CH = 2)$$$. $$$B = 1024$$$ is the batch size. Reference T1 maps were generated from the scanner using all acquired T1-weighted images.
Network
Attention-gated mechanisms have recently demonstrated significant improvements in performance of neural networks in tasks such as image classification and object detection [13, 14]. These attention-gated mechanisms assist neural networks focus on important feature information as opposed to background information. The convolutional block attention (CBAM) module has shown excellent capabilities by using global average-pooled features combined with max-pooled features to generate channel attention maps [14]. This module can be defined using the following equations.
$$M_c = σ( M(Avg(F_n)) + M(Max(F_n)) ) \quad(1) $$ $$F_{n+1} = M_c \cdot F_n + F_n \quad(2)$$
Equation 1 describes the generation of channel attention maps where information from the output of the Nth layer of the network, Fn, is aggregated using global average pooling and global max pooling layers. These pooled outputs are then fed into a shared two-layer convolutional neural network, M, and added to combine features extracted from the neural network. The sigmoid function, σ, is then used to generate weight factors for all feature channels. The input of the (N+1)th layer of the network is generated using Equation 2. We combine CBAM modules with a multi-layer perceptron neural network architecture to generate T1 maps using approximately 300,000 parameters. Figure 1 demonstrates the architecture of the attention-gated multi-layer perceptron. Training was done using the L1 loss function for 100 epochs on a NVIDIA P40 GPU and took approximately 12 hours. The Adam optimizer was used with a learning rate of 0.0003, and a batch size of 1024. Training was performed on 379 datasets from 105 patients, validation was performed on 24 datasets from 13 patients, and testing was performed on 36 datasets from 13 patients for the pre-contrast network. Training was performed on 121 datasets from 32 patients, validation was performed on 11 datasets from 5 patients, and testing was performed on 18 datasets from 6 datasets for post-contrast networks.
Results
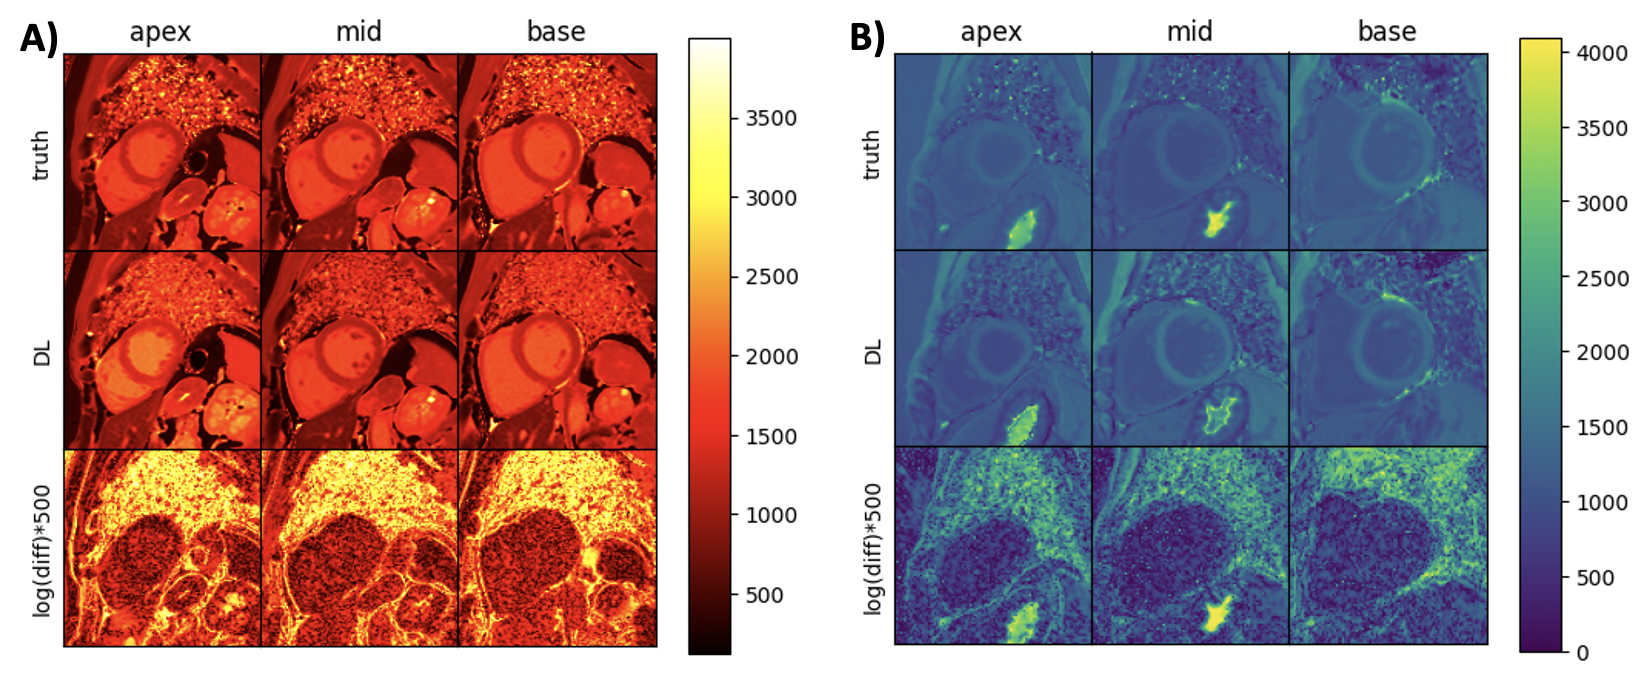
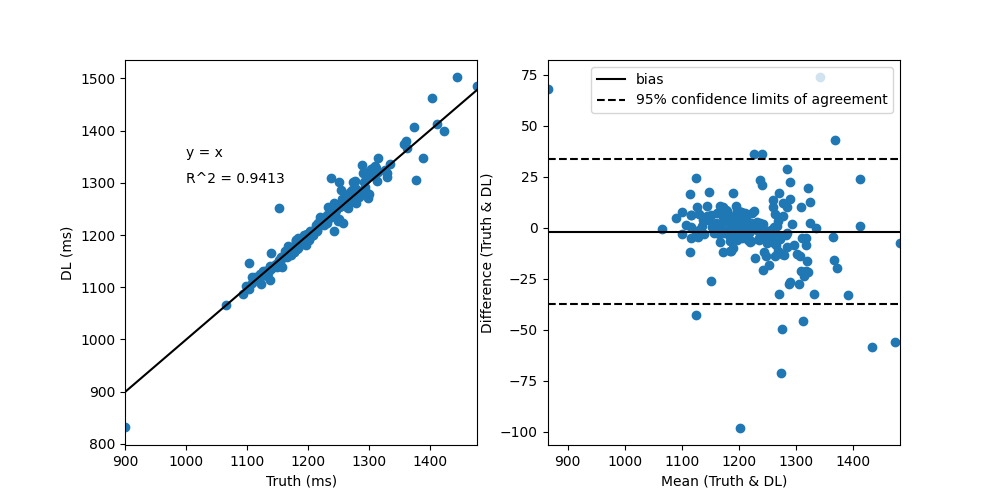
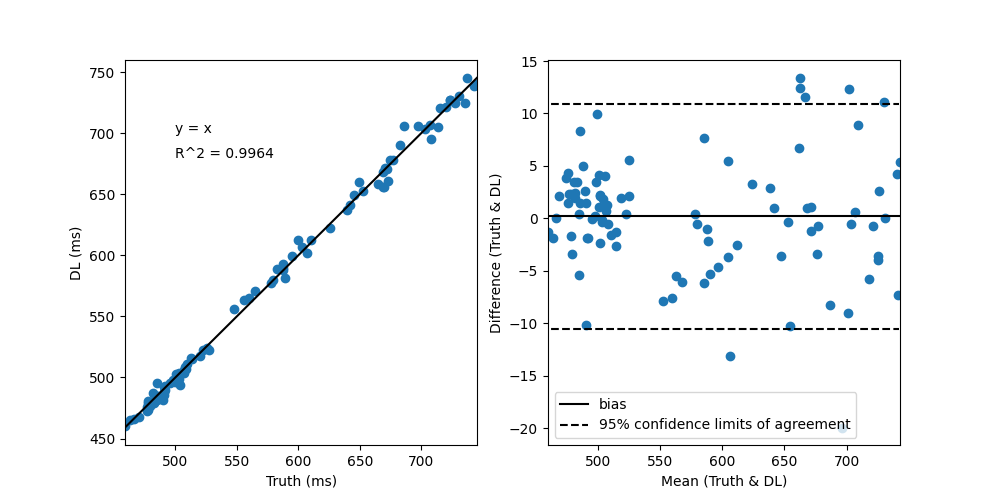
Figure 2 demonstrates network generated T1 maps in comparison to scanner generated reference T1 maps for (A) pre-contrast T1 maps and (B) post-contrast T1 maps. Figure 3 and Figure 4 demonstrates correlation and Bland-Altman plots for the pre-contrast and post-contrast networks respectively.Discussion and Conclusions
Our results demonstrate promise for the application of deep learning for rapid cardiac T1 mapping. By using an attention-gated multi-layer perceptron, we have demonstrated that deep learning can be used to potentially accelerate T1 mapping sequences by reducing the number of T1-weighted images required to produce high-quality T1 maps. Deep learning can decrease the 5(3)3 MOLLI sequence to only 5 heart beats and decrease the 4(1)3(1)2 MOLLI sequence to only 4 heart beats without significantly compromising the quality of T1 maps.Acknowledgements
This work is supported by the National Institute of Health grant ROIHL138082 and S10OD018482-01.References
[1] Dall'Armellina E, Piechnik SK, Ferreira VM, Si QL, Robson MD, Francis JM, et al. Cardiovascular magnetic resonance by non contrast T1-mapping allows assessment of severity of injury in acute myocardial infarction. J Cardiovasc Magn Reson 2012;14:15.
[2] Karamitsos TD, Piechnik SK, Banypersad SM, Fontana M, Ntusi NB, Ferreira VM, et al. Noncontrast T1 mapping for the diagnosis of cardiac amyloidosis. JACC Cardiovasc Imaging 2013;6(4):488-97.
[3] Sado DM, White SK, Piechnik SK, Banypersad SM, Treibel T, Captur G, et al. Identification and assessment of Anderson-Fabry disease by cardiovascular magnetic resonance noncontrast myocardial T1 mapping. Circ Cardiovasc Imaging 2013;6(3):392-8.
[4] Taylor AJ, Salerno M, Dharmakumar R, Jerosch-Herold M. T1 Mapping: Basic Techniques and Clinical Applications. JACC Cardiovasc Imaging 2016;9(1):67-81.
[5] Schelbert EB, Messroghli DR. State of the Art: Clinical Applications of Cardiac T1 Mapping. Radiology 2016;278(3):658-76.
[6] Liu A, Wijesurendra RS, Francis JM, Robson MD, Neubauer S, Piechnik SK, et al. Adenosine Stress and Rest T1 Mapping Can Differentiate Between Ischemic, Infarcted, Remote, and Normal Myocardium Without the Need for Gadolinium Contrast Agents. JACC Cardiovasc Imaging 2016;9(1):27-36.
[7] Liu D, Borlotti A, Viliani D, Jerosch-Herold M, Alkhalil M, De Maria GL, et al. CMR Native T1 Mapping Allows Differentiation of Reversible Versus Irreversible Myocardial Damage in ST-Segment-Elevation Myocardial Infarction: An OxAMI Study (Oxford Acute Myocardial Infarction). Circ Cardiovasc Imaging 2017;10(8).
[8] Nakamori S, Fahmy A, Jang J, El-Rewaidy H, Neisius U, Berg S, et al. Changes in Myocardial Native T1 and T2 After Exercise Stress: A Noncontrast CMR Pilot Study. JACC Cardiovasc Imaging 2020;13(3):667-80.
[9] Kellman P, Wilson JR, Xue H, Ugander M, Arai AE. Extracellular volume fraction mapping in the myocardium, part 1: evaluation of an automated method. J Cardiovasc Magn Reson 2012;14:63.
[10] Piechnik SK, Ferreira VM, Dall'Armellina E, Cochlin LE, Greiser A, Neubauer S, et al. Shortened Modified Look-Locker Inversion recovery (ShMOLLI) for clinical myocardial T1-mapping at 1.5 and 3 T within a 9 heartbeat breathhold. J Cardiovasc Magn Reson 2010;12:69.
[11] Chow K, Flewitt JA, Green JD, Pagano JJ, Friedrich MG, Thompson RB. Saturation recovery single-shot acquisition (SASHA) for myocardial T(1) mapping. Magn Reson Med 2014;71(6):2082-95.
[12] Roujol S, Weingartner S, Foppa M, Chow K, Kawaji K, Ngo LH, et al. Accuracy, precision, and reproducibility of four T1 mapping sequences: a head-to-head comparison of MOLLI, ShMOLLI, SASHA, and SAPPHIRE. Radiology 2014;272(3):683-9.
[13] Hu J, Albanie S, Sun G, Wu E. Squeeze-and-Excitation Networks. IEEE Transactiton on Pattern Analysis and Machine Intelligence 2020;42(8):2011-23.
[14] Woo S, Park J, Lee J-Y, Kweon IS. CBAM: Convolutional Block Attention Module. European Conference on Computer Vision 2018:3-19.
Figures