2177
Accelerating 3D MULTIPLEX MRI Reconstruction with Deep Learning1United Imaging Intelligence, Cambridge, MA, United States, 2UIH America, Inc., Houston, TX, United States, 3United Imaging Healthcare, Shanghai, China
Synopsis
We propose a deep learning framework for undersampled 3D MRI data reconstruction and apply it to a recently developed multi-flip-angle (FA) and multi-echo GRE method (named MULTIPLEX) that can simultaneously acquire multiple parametric images with just one single MRI scan. The proposed deep learning method shows good performance in image quality and reconstruction time.
Introduction
Multi-contrast MRI images provide complementary contrast information about the characteristics of anatomical structures and are commonly used in clinical practice. Recently, a multi-flip-angle (FA) and multi-echo GRE method, hereinafter named as MULTIPLEX MRI, has been developed to simultaneously acquire multiple parametric images with just one single scan1,2, which includes perfectly aligned PDW, T1W, T2* mapping and QSM images. However, it poses two challenges for MULTIPLEX to be used in the 3D high-resolution setting: a relatively long scan time and the huge amount of 3D multi-contrast data for reconstruction. To accelerate the 3D MULTIPLEX data acquisition, undersampled k-space data can be acquired. However, this makes the reconstruction of 3D MULTIPLEX data even more challenging. Since the compressed sensing (CS) algorithms are often iterative and time-consuming, it is difficult for CS-based method to reconstruct such a large amount of high-resolution 3D data within a clinically acceptable duration. On the other hand, deep learning (DL) methods only take one forward pass of the trained model to generate the reconstructed images and therefore such methods are much faster. Currently, no DL based method has been proposed for 3D MULTIPLEX data reconstruction. In this paper, we propose a DL framework for undersampled 3D MULTIPLEX MRI data reconstruction. The proposed method shows good performance in image quality and reconstruction time.Methods
Data collection: The multi-FA and multi-echo GRE brain scans were performed on a 3T scanner (uMR 790 United Imaging Healthcare, Shanghai, China) with a 32-channel head coil, using the following parameters: FA1/FA2=4/16, 6~8 echoes with TE=2.1~20.8ms and TR=34.9ms, matrix size=336x278x64 with a voxel size of 0.69x0.69x2mm3. The data were acquired with parallel imaging, which was used as the ground truth to train and evaluate the DL model. The ground truth data were then retrospectively undersampled using the 3X and 5X Poisson-disk undersampling scheme in phase encoding and slice directions.The data includes total 49 scans and we randomly split the data into 42 scans (662 3D echo data) for training and 5 scans (75 3D echo data) for testing.Reconstruction framework: With different echo and FA configures in one single scan, the 3D MULTIPLEX MRI can generate multiple (e.g., 7x2=14) 3D echo data, which is much larger than conventional 3D MRI data. To balance the reconstruction speed and GPU memory usage, we utilize the following strategy. We first used the DL model to construct all MULTIPLEX echo images. We reconstructed each coil in each echo data separately to avoid loading the whole multi-echo multi-coil 3D data into the GPU memory. In the training stage, the readout (RO) was randomly cropped into 128 to further reduce memory consumption. In the testing stage, full RO was used. Then the DL reconstructed echo images were processed to generate the following parametric images: (1) Composite PDW and T1W: by averaging all the echo images from FA1 or FA2, respectively. (2) T2* mapping: calculated using MDI method3 on multi-echo images. (3) QSM: the field map was first extracted from multi-echo images4, and was then used to generate QSM using the L2-norm optimization method with dynamic streaking artifact regularization5.
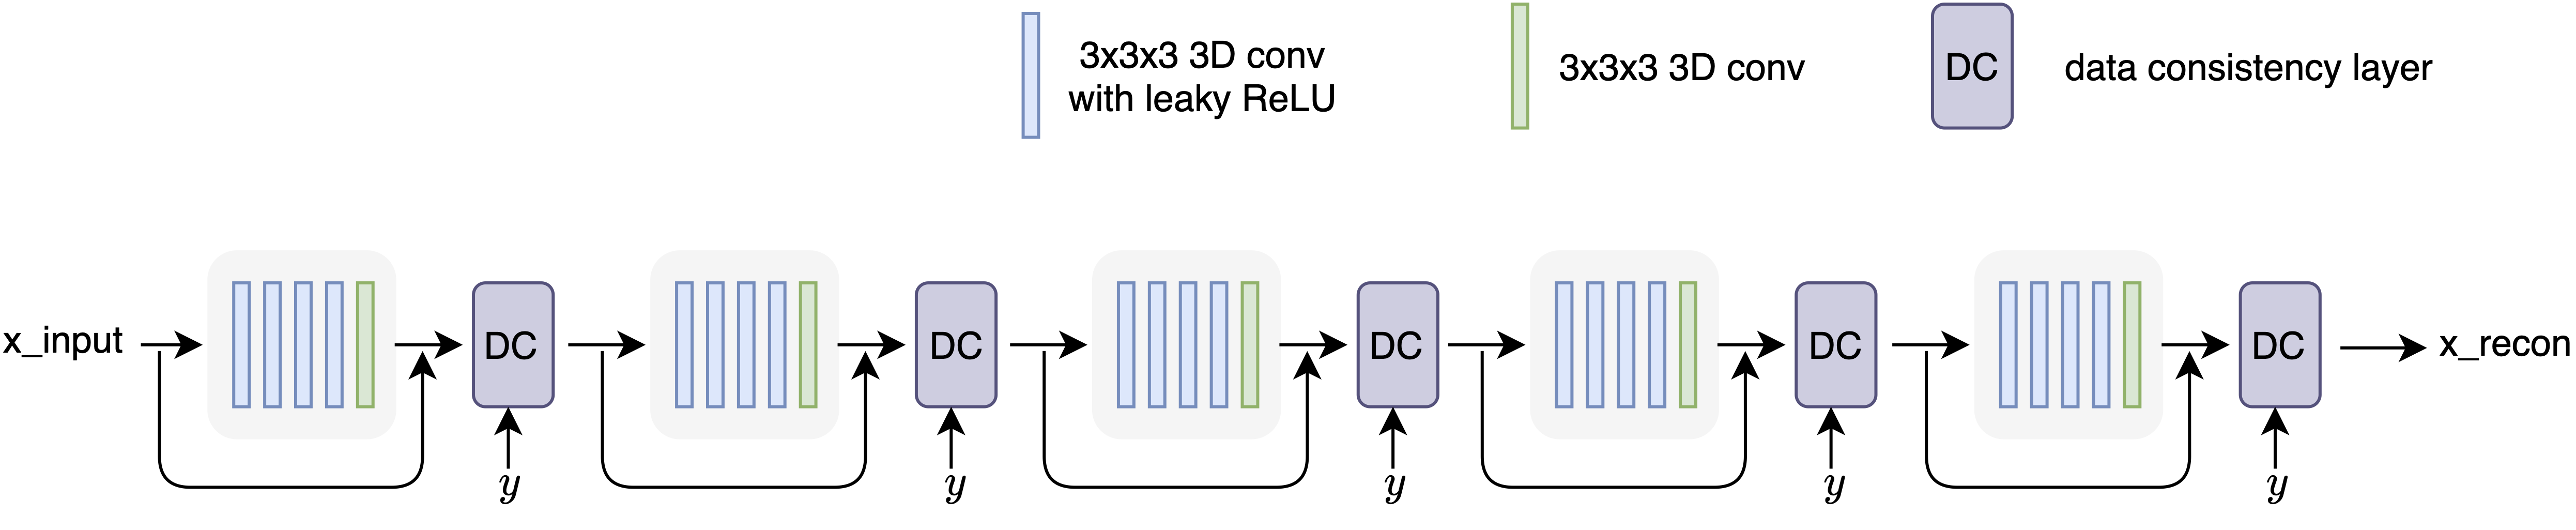
DL model: We employed a cascaded CNN model6 with 3D convolutional layers and data consistency layers (Figure 1). The model is fully convolutional and thus can take input images with flexible sizes. The images were reconstructed using an Nvidia Tesla V100 GPU (16G memory).
Results
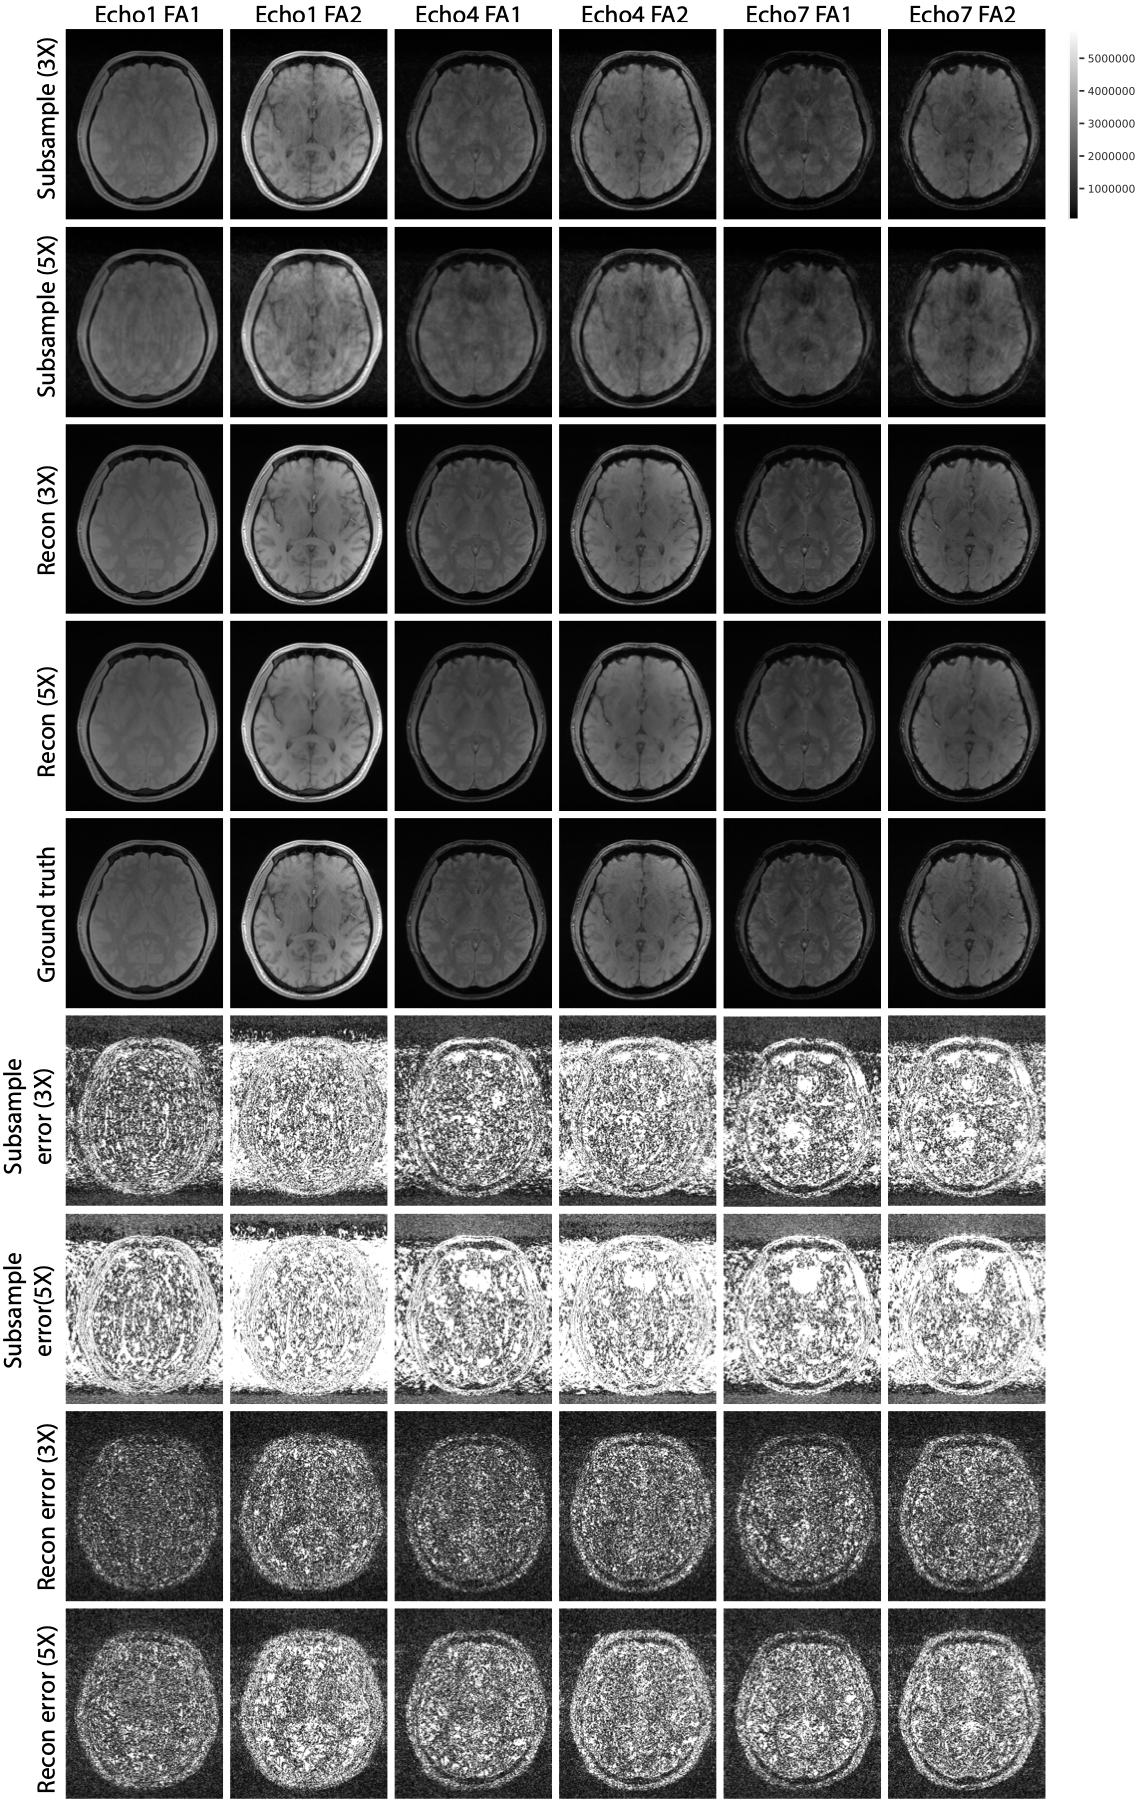
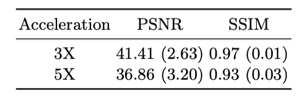
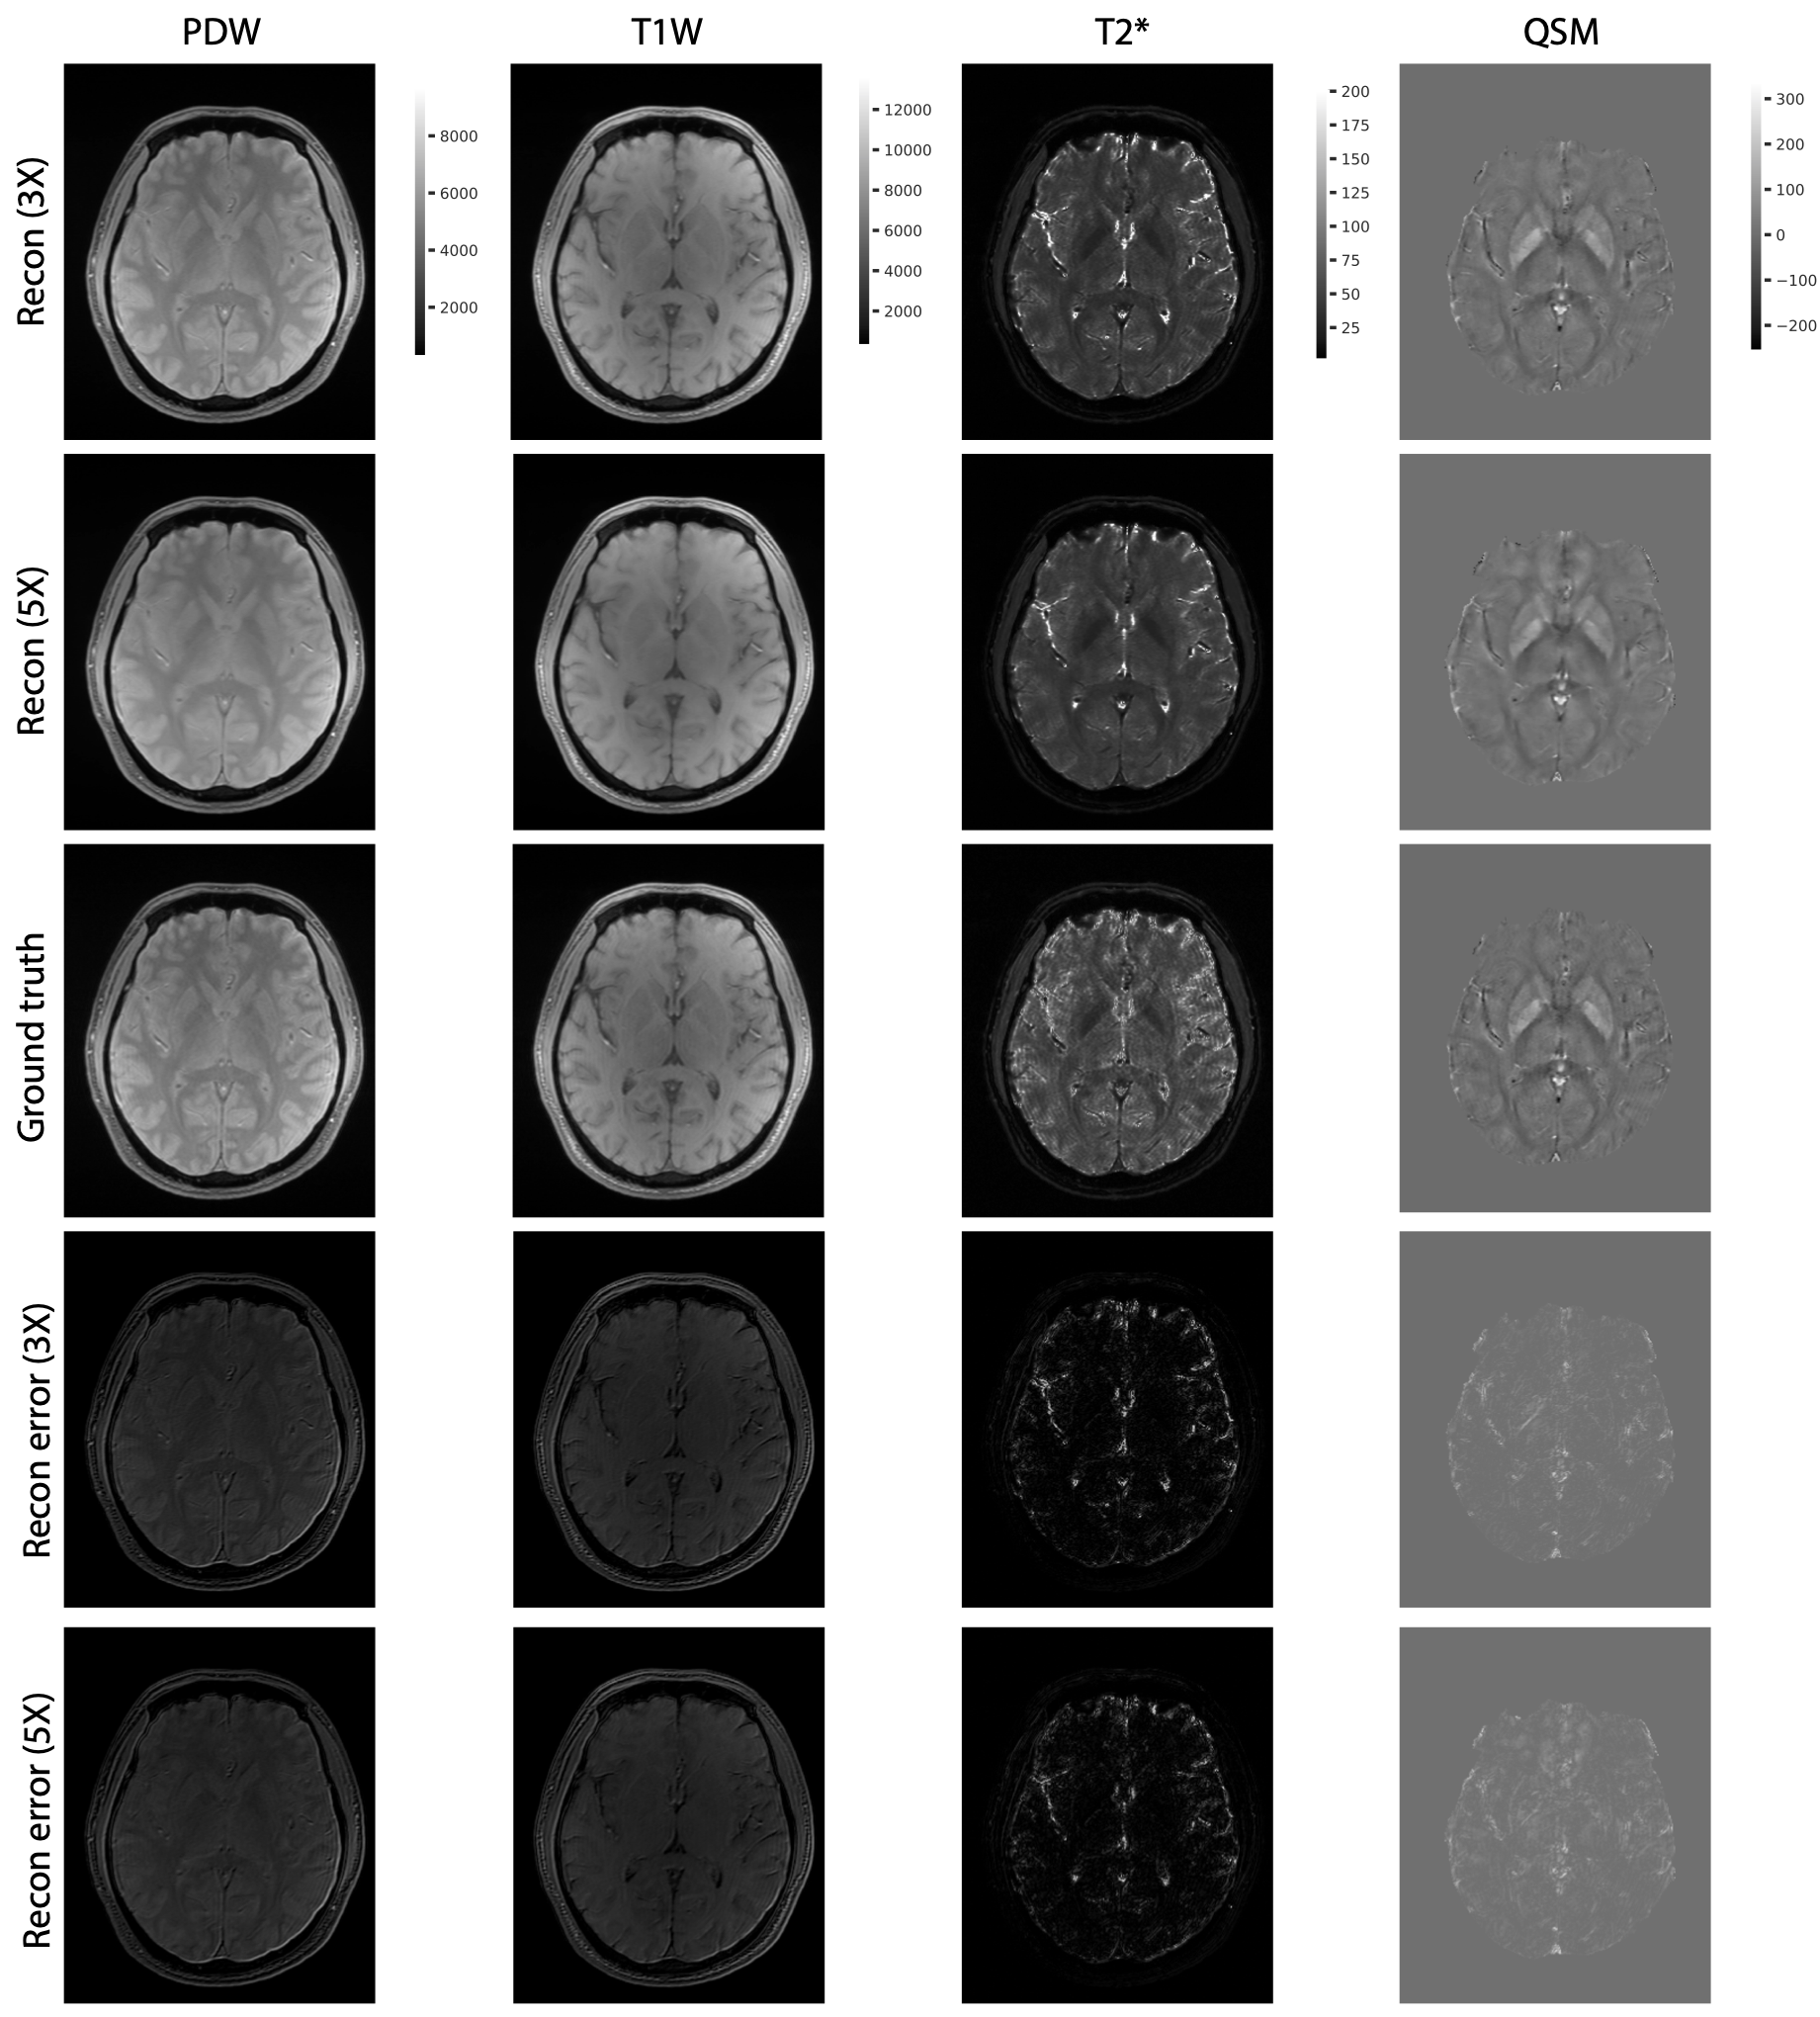
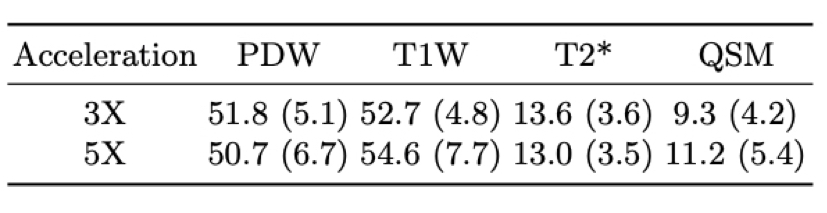
Figure 2 shows the examples of reconstructed MULTIPLEX echo images from the test dataset. The reconstruction results at 3X acceleration are quite similar to the ground truth, while the results at 5X acceleration show relatively worse reconstruction quality. Compared to the ground truth, the DL reconstructions have less ringing artifacts and noise. Figure 3 shows the quantitative results for the reconstructed echo images at 3X and 5X accelerations, which are consistent with the visual examples in Figure 2. Based on the reconstructed echo images, we also calculated the parametric images such as PDW, T1W, T2* and QSM (Figure 4 and 5), which are also similar to the ground truth results.For one 3D MULTIPLEX echo image, the DL model took 66 seconds to reconstruct all coil images with 15G GPU memory usage. We attempted to run a CS-based 3D reconstruction algorithm on the same data. However, it either ran out of memory using the GPU or took more than one hour to run using the CPU.
Discussion and Conclusion
It is challenging to reconstruct the images from the large 3D MULTIPLEX data in a reasonably fast time. In this paper, we proposed to take advantage of the fast reconstruction speed of the DL model and reconstruct each echo image independently. The strategy leads to good reconstruction results and fast reconstruction time. Other DL model architectures for mobile devices such as MobileNet can be further explored to alleviate the computational burden, especially the GPU memory usage. With less GPU memory consumption, the multiple echo images can be fed into the model and the correlation between them can be learned by the model, which can potentially improve the reconstruction quality.Acknowledgements
References
1. Yongsheng Chen, Saifeng Liu, Yu Wang, Yan Kang, and E Mark Haacke. Strategically acquired gradient echo (stage) imaging, part i: Creating enhanced T1 contrast and standardized susceptibility weighted imaging and quantitative susceptibility mapping. Magnetic resonance imaging, 46:130–139, 2018.
2. Yongquan Ye, Jinguang Zong, Jingyuan Lyu, and Weiguo Zhang. SWI+: A robust artifact-free SWI procedure with improved contrast. ISMRM, 2019.
3. Yongquan Ye and Jingyuan Lyu. MR relaxivity mapping using multi-dimensional integrated (MDI) complex signal ratio. ISMRM, 2019.
4. Yongquan Ye, Fei Zhou, Jinguang Zong, Jingyuan Lyu, Yanling Chen,Shuheng Zhang, Weiguo Zhang, Qiang He, Xueping Li, Ming Li, et al. Seed prioritized unwrapping (spun) for MR phase imaging. Journal of Magnetic Resonance Imaging, 50(1):62–70, 2019.
5. Yongquan Ye, Xueping Li, Fei Zhou, Ming Li, Zhao Qing, Bing Zhang, Shuheng Zhang, Yanling Chen, and Jinguang Zong. Dynamic streaking artifact regularization for QSM. ISMRM, 2019.
6. Jo Schlemper, Jose Caballero, Joseph V Hajnal, Anthony N Price, and Daniel Rueckert. A deep cascade of convolutional neural networks for dynamic MRI image reconstruction. IEEE transactions on Medical Imaging, 37(2):491–503,2017.
Figures