2175
Deep Learning Enhanced T1 Mapping and Reconstruction Framework with Spatial-temporal and Physical Constraint1Center for Biomedical Imaging Research, Medical School, Tsinghua University, Beijing, China, 2School of Biomedical Engineering and Imaging Sciences, King’s College London, London, United Kingdom, 3GE Healthcare, Beijing, China, 4Vascular Imaging Lab and BioMolecular Imaging Center, Department of Radiology, University of Washington, Seattle, Seattle, WA, United States, 5Department of Neurology, Peking University Third Hospital, Beijing, China
Synopsis
A Deep learning enhAnced T1 parameter mappIng and recoNstruction framework using spatial-Temporal and phYsical constraint (DAINTY) was proposed. DAINTY explicitly imposed low rank and sparsity constraints on the multi-frame T1 weighted images to exploit the spatial-temporal correlation. A deep neural network was used to efficiently perform T1 mapping as well as denoise and reduce under-sampling artifacts. More importantly, smooth and accurate T1 maps generated from the neural network were transformed to T1 weighted images using the physical model, which the transformed T1 weighted images were also refined. Combining refined images and intermediate reconstructed images, the image quality was greatly improved.
Synopsis
A Deep learning enhAnced T1 parameter mappIng and recoNstruction framework using spatial-Temporal and phYsical constraint (DAINTY) was proposed. DAINTY explicitly imposed low rank and sparsity constraints on the multi-frame T1 weighted images to exploit the spatial-temporal correlation. A deep neural network was used to efficiently perform T1 mapping as well as denoise and reduce under-sampling artifacts. More importantly, smooth and accurate T1 maps generated from the neural network were transformed to T1 weighted images using the physical model, which the transformed T1 weighted images were also refined. Combining refined images and intermediate reconstructed images, the image quality was greatly improved. Results of simulation and in-vivo datasets showed DAINTY can achieve higher performance than compared methods.Introduction
Recently, a T1 mapping technique called GOAL-SNAP [1] was proposed, which used an inversion recovery (IR) preparation pulse and a turbo gradient echo (TFE) acquisition with 3D golden angle radial sampling trajectory. However, the image reconstruction method used in the GOAL-SNAP sequence is NK-CS, which is a view-sharing technique and may reduce the accuracy of the T1 quantification because of the contrast mixture generated in the reconstruction. Additionally, traditional reconstruction and fitting methods adopt a two-step workflow, i.e. reconstructing the weighted images first, and then performing the parameter fitting pixel-by-pixel. The potential limitations of these methods are that there is no spatial constraint applied in the parameter domain as well as the pixel-wise fitting is slow, especially applied in 3D MR data. To address these limitations, a Deep learning enhAnced parameter T1 mappIng and recoNstruction framework using spatial-Temporal and phYsical constraint (DAINTY) was proposed in this study.Methods
TheoryExtended from the original low rank plus sparsity constraint method [2], the optimization problem in DAINTY can be defined as:
$$argmin_{M,L,S}\frac{1}{2}\parallel EGM(L+S)-d\parallel_2^2+\lambda_{1}\parallel L\parallel_{*}+\lambda_{2}\parallel TS\parallel_{1} [1]$$
Where E denoted the multi-coil sensitivity operator with NUFFT, G denoted the physical model using the Bloch equation which can transfer T1 map back to the corresponding multi-frame T1 weighted images, M denoted a mapping function which can generate T1 maps from multi-frame T1 weighted images, L denoted the low rank part, S denoted the sparsity part, T denoted the temporal Fourier transform and d denoted the acquired k-space data.
Introducing the auxiliary splitting variable u and Q, the Eq, [1] became:
$$argmin_{Q,L,S}\frac{1}{2}\parallel EGQ-d\parallel_2^2+\lambda_{1}\parallel L\parallel_{*}+\lambda_{2}\parallel TS\parallel_{1}$$
$$s.t. L+S=u,Mu=Q [2]$$
After some mathematical deductions, the iterative optimization of variables can be defined as:
$$L_{k+1}=SVT_{\lambda1}[S_{k}-t(L_{k}+S_{k}-u_{k})]$$
$$S_{k+1}=T^{-1}ST_{\lambda2}[T[L_{k}-t(L_{k}+S_{k}-u_{k})]]$$
$$M_{k+1}=R_{cnn}(Q,u)$$
$$Q_{k+1}=M_{k+1}u_{k}$$
$$u_{k+1/2}=\frac{GQ_{k+1}+\mu(L_{k+1}+S_{k+1})}{1+\mu}$$
$$u_{k+1}=u_{k+1/2}-E^{H}(Eu_{k+1/2}-d) [3]$$
Where SVT and ST denoted the singular value thresholding and the soft-thresholding operator, Rcnn denoted the network training process, λ1 , λ2 and µ denoted parameters and set to 0.01, 0.0.1 and 1.
Neural Network
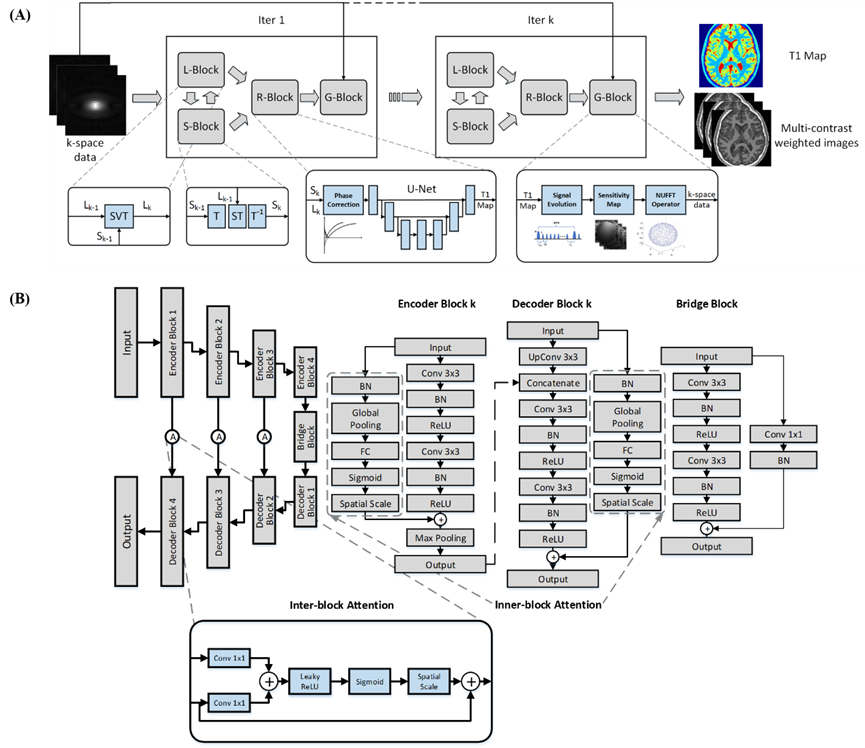
The whole workflow can be seen in Figure 1. In DAINTY, a DenseAttention U-Net [3] (Figure 1B) was proposed to perform the T1 mapping (R-Block in Figure 1A). The loss function was the combination of MSE and MAE which can simultaneously restore details and denoise images [4].
Dataset and Training
20 simulated digital brain phantoms[5] were used for network training. The outputs of the network were the predicted T1 maps, while the inputs were not only the simulated T1 weighted images, but also the intermediate reconstruction results (images generated from the inverse NUFFT, intermediate reconstructed images of first 6 iterations in L+S) and final reconstructed T1 weighted images in L+S. The neural network can learn the mapping from both under-sampled T1 weighted images and good quality images, providing the network with the denoising and deblurring capability.
Images were divided into training, validation and testing dataset which had 40000,10000 and 10000 image slices. The total epochs of the training were 300 and the training time was about 5 hours. After training, it only took 0.2s to perform T1 mapping per slice.
Experiments
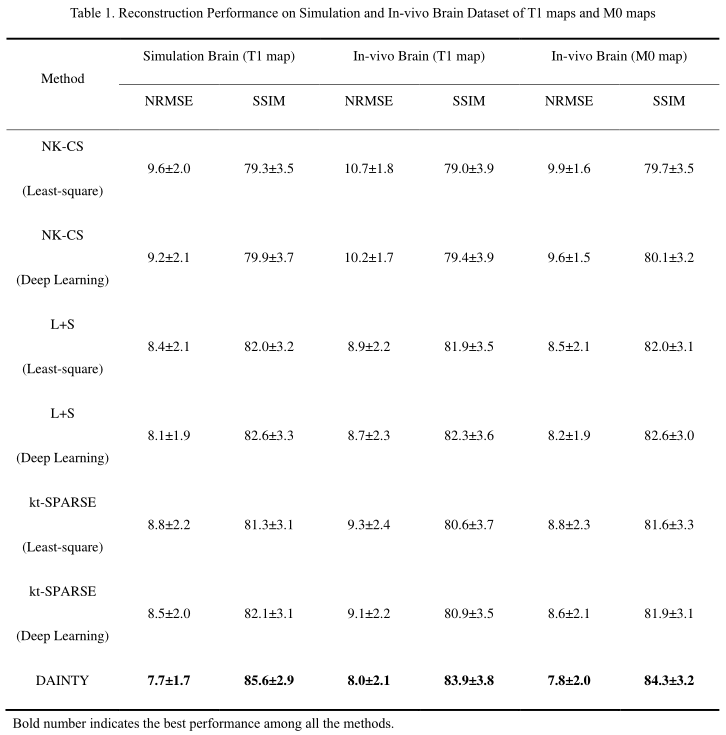
DAINTY was compared with NK-CS [1], kt-SS [6] and L+S [2] method on simulation brain, real acquired phantom, in-vivo brain of healthy volunteers and carotid of atherosclerosis patients. IR-SE or IR-TSE was acquired as the gold standard of the T1 mapping. PSNR and SSIM were used as evaluation matrices.
Results
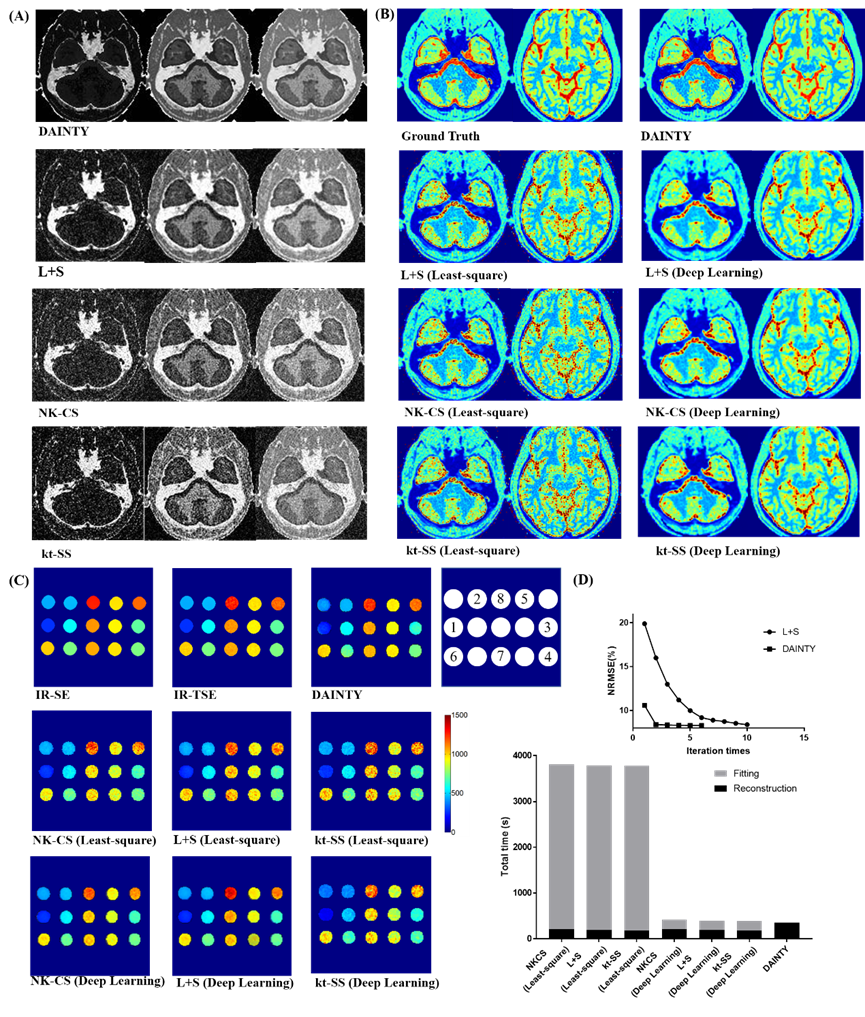
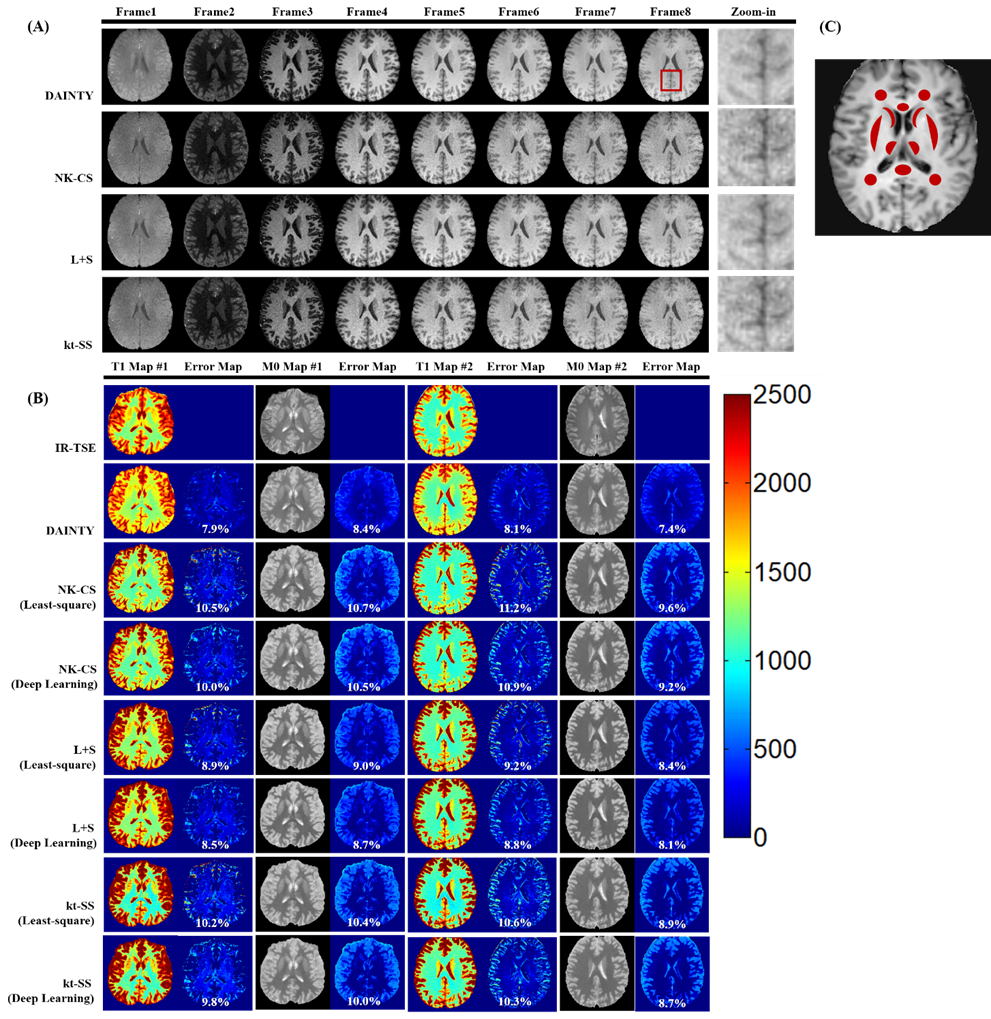
Figure 2 shows DAINTY can outperform other methods, which generated higher quality T1 weighted images and more accurate T1 maps. In addition, DAINTY can reduce the iteration times, which took only 2 iterations to converge. DAINTY was 10 times faster than traditional reconstruction methods with pixel-by-pixel T1 fitting (Figure 2D).Figure 3 shows the results on in-vivo brain. Compared to NK-CS, kt-SS and L+S method, DAINTY can generate smoother T1 weighted images, T1 and M0 maps with less error. Notably, details in brain sulci and gyri regions were clearly restored using DAINTY.
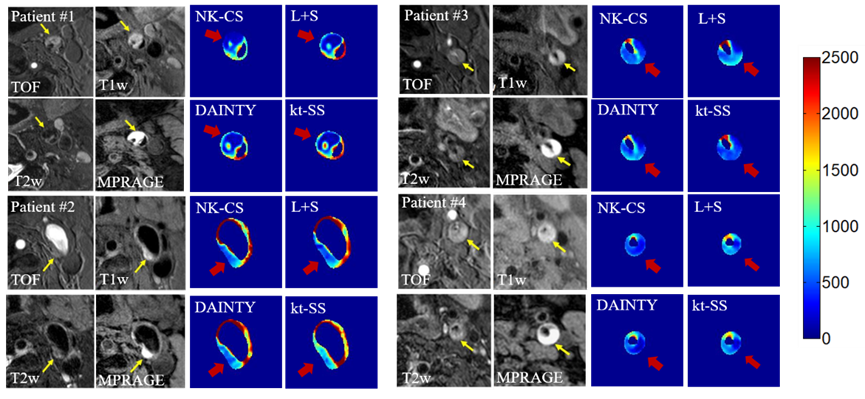
As shown in Figure 4, IPH regions of carotid atherosclerotic plaques can be detected in all T1 maps where T1 values were apparently lower than the normal vessel wall regions.
Quantitative results are shown in Table 1. DAINTY can achieve the highest SSIM and the lowest NRMSE in T1 and M0 mapping in different datasets.
Discussion and Conclusion
DAINTY utilized the deep learning, low-rank, sparsity and physical constraints to generate high-quality T1 weighted images and accurate T1 maps with high efficiency, which may pave the way for the clinical application of the fast T1 mapping technique.Acknowledgements
NoneReferences
1. Qi H , Sun J , Qiao H , et al. Carotid Intraplaque Hemorrhage Imaging with Quantitative Vessel Wall T1 Mapping: Technical Development and Initial Experience. Radiology, 2017:170526.
2. Otazo R, Candes E, Sodickson DK. Low-rank plus sparse matrix decomposition for accelerated dynamic MRI with separation of background and dynamic components. Magn Reson Med. 2015;73(3):1125-1136.
3. Ronneberger O, Fischer P, Brox T. U-Net: Convolutional Networks for Biomedical Image Segmentation. Lect Notes Comput Sc. 2015;9351:234-241.
4. Zhao H, Gallo O, Frosio I, Kautz J. Loss Functions for Image Restoration With Neural Networks. IEEE Transactions on Computational Imaging 2017;3(1):47-57.
5. BrainWeb: Simulated Brain Database. http://www.bic.mni.mcgill.ca/brainweb/. Accessed May 5, 2019.
6. Otazo R, Kim D, Axel L, Sodickson DK. Combination of compressed sensing and parallel imaging for highly accelerated first-pass cardiac perfusion MRI. 2010;64(3):767-776.
Figures