2174
Accurate quantitative parameter maps reconstruction method for tsDESPOT using Low Rank approximated Unet ADMM1Advanced Technology Reserch Dept. Reserch and Development Center, Canon Medical Systems Corporation, Kawasaki, Japan, 2Advanced Technology Reserch Dept. Reserch and Development Center, Canon Medical Systems Corporation, Otawara, Japan, 3Reserch and Development Center, Canon Medical Systems Corporation, Otawara, Japan
Synopsis
We examined the quantitative
multi parameter mapping method so called transient state DESPOT (tsDESPOT) which
based on conventional DESPOT sequence. From the acquired data,
low rank approximated (LRA) images which include transient state information were reconstructed, then T1, T2, B1 and PD maps were estimated by dense neural network. In
this study, we proposed fast estimation method of accurate full sampled LRA
images using approximate ADMM (alternating direction method of
multipliers) which optimize Unet estimation and data consistency.
Compared to simple Unet estimation method, the method improved quantitative
accuracy of maps and removed artifact that couldn’t be removed.
Introduction
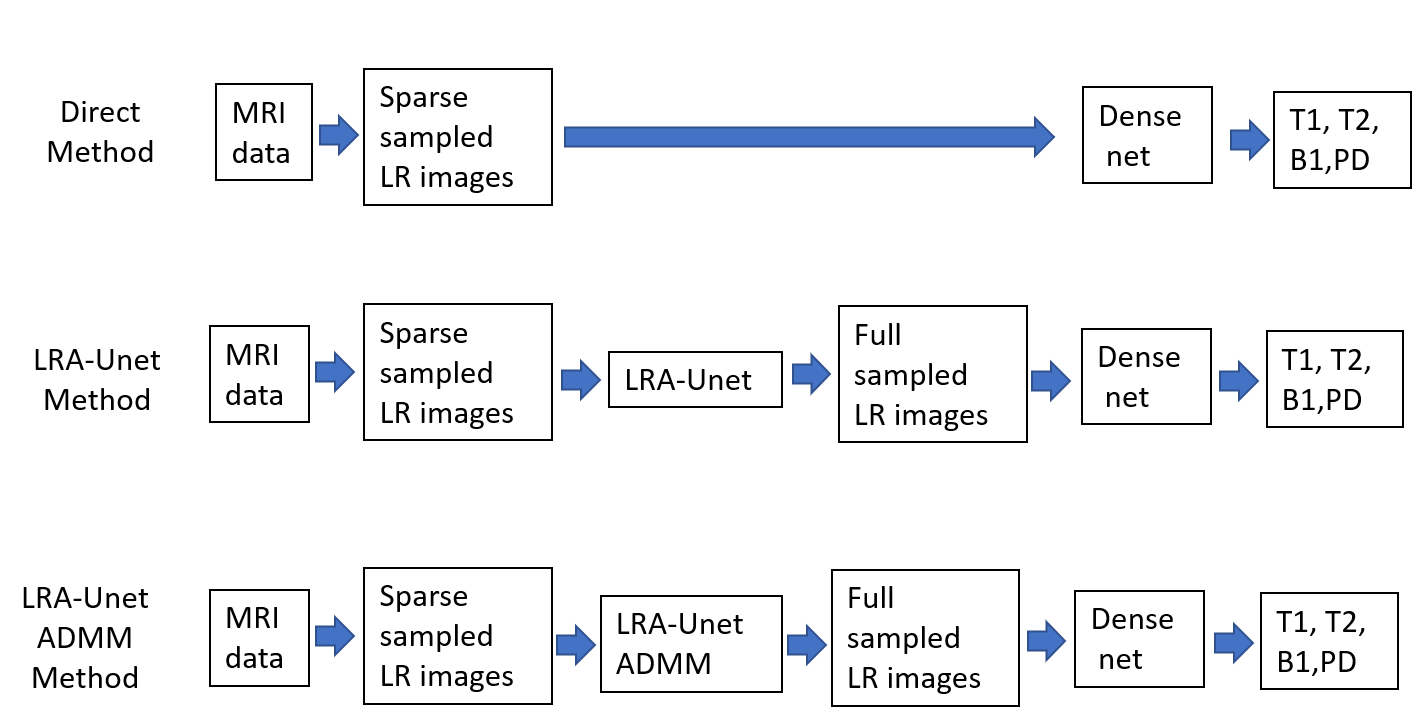
Recently, many quantitative multi parameter mapping methods1 were proposed and were attracting much attention. In this study, we examined the method so called transient state DESPOT (tsDESPOT) which based on conventional DESPOT sequence2. Some images with different flip angles were acquired continuously by tsDESPOT. From the data, low rank approximated (LRA) images were reconstructed by low rank approximation method used in MR fingerprinting3 , then T1, T2, B1 and PD maps were estimated using dense neural network4. However there LRA images are sparse sampled (SS) images, it was difficult to estimate quantitative maps accurately. Recently, the method which remove undersampling artifact from SS LRA images using Unet before feed to dense neural network has been proposed5. Also, the ADMM method which optimize dictionary match (DM) and data consistency (DC) has been reported6, and It was shown that utilize DC is important. We propose the method which estimate Full sampled (FS) LRA images by approximate ADMM method which optimize Unet estimation and DC iteratively. The proposed method aimed to improve accuracy by DC which is not guaranteed Unet. We compared three methods which shown in figure 1 from the point of view of accuracy.Methods
By prototype tsDESPOT which was consisted combination of 2D radial sequences, 5 images were acquired. First, The image from IR-SP-GRE with FA 5° , TI 14ms and the image from SP-GRE with FA 15° were acquired continuously, then FA 70° was applied for magnetization saturation, and then three images from FISP with FA 70°, 50°, 30° were acquired continuously. To reduce effect of slice profile, sinc44 waveform was used for RF excitation. Other parameters were, TR/TE=7.0ms/3.5ms, 411 spokes / image, matrix size = 256 x 256, total acquisition time was about 18 s. In experiment, NIST system phantom data was acquired on 3T MRI system (Canon, Vantage Centurian) using QD head coil. The evolution of magnetization by this sequence was calculated using extended phase graph method (EPG). Then 10 coefficient sets for calculate LRA images were determined by the singular values decomposition. 10 LRA images were calculated from (IR-)SP-GRE and FISP acquired data, and T1, T2, B1 and PD values were estimated using dense neural network.The dense neural network and LRA-Unet were trained using data set generated by simulation. The algorithm of LRA Unet ADMM method is shown here.$$
\begin{align}
\mathrm{for} \ j &\\
& x_{j+1}=\arg \min_{x}\parallel G\cdot F \cdot x-S \parallel_2^2+\mu\parallel x-X_j X_j^H x+\ y_j - X_j X_j^H y_j \parallel_2^2 \\[6pt]
& X_{j+1} = \mathrm{Unet} \left( F^H \cdot G_{dc}^H \cdot G \cdot F \cdot (x_{j+1}+y_j) \right) \\[6pt]
& y_{j+1} - X_{j+1} X_{j+1}^H y_{j+1} = y_j - X_j X_j^H y_j + x_{j+1} - X_{j+1} X_{j+1}^H x_{j+1} \\
\mathrm{end} \ \ & \\
\end{align}
$$
Where $$$x_j$$$ are LRA images, $$$X_j$$$ are Unet estimated FS LRA images which norm is normalized one, $$$S$$$ is data of acquired, $$$G$$$ is Gridding operator, $$$G_{dc}^H$$$ is density compensated regridding operator, $$$F$$$ is Fourier operator, and $$$y_j$$$ is Lagrange coefficient. The method approximate ADMM method, when $$$X_j X_j^H y_j << y_j$$$. First formula is approximate augmented Lagrangian which composed by DC (first term) and Unet estimation consistency (second term). It can be solved for by CG method. Second formula mean Unet estimation step. Third formula is update Lagrange coefficient. In this study left side and right side second term of third formula were ignored for simplicity. The loop was iterated 5 times. Total reconstruction time was about 2 min.
Results
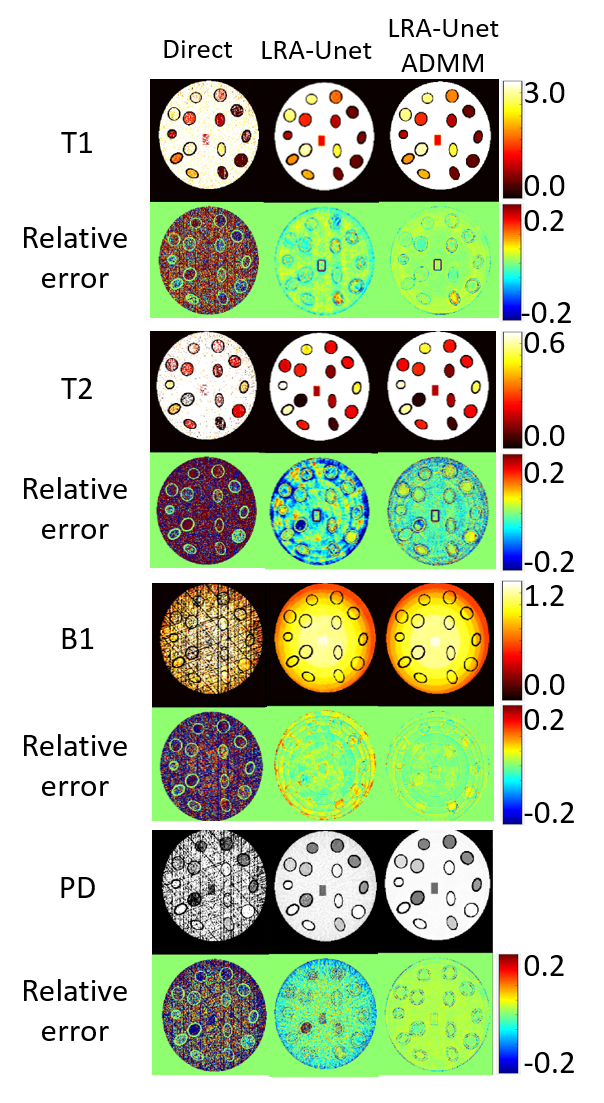
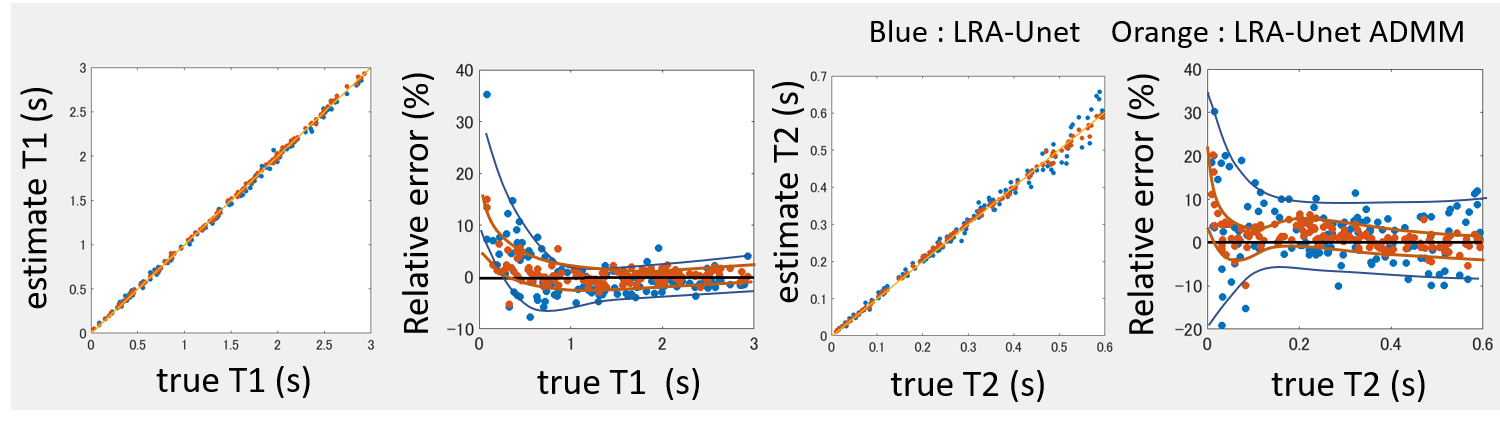
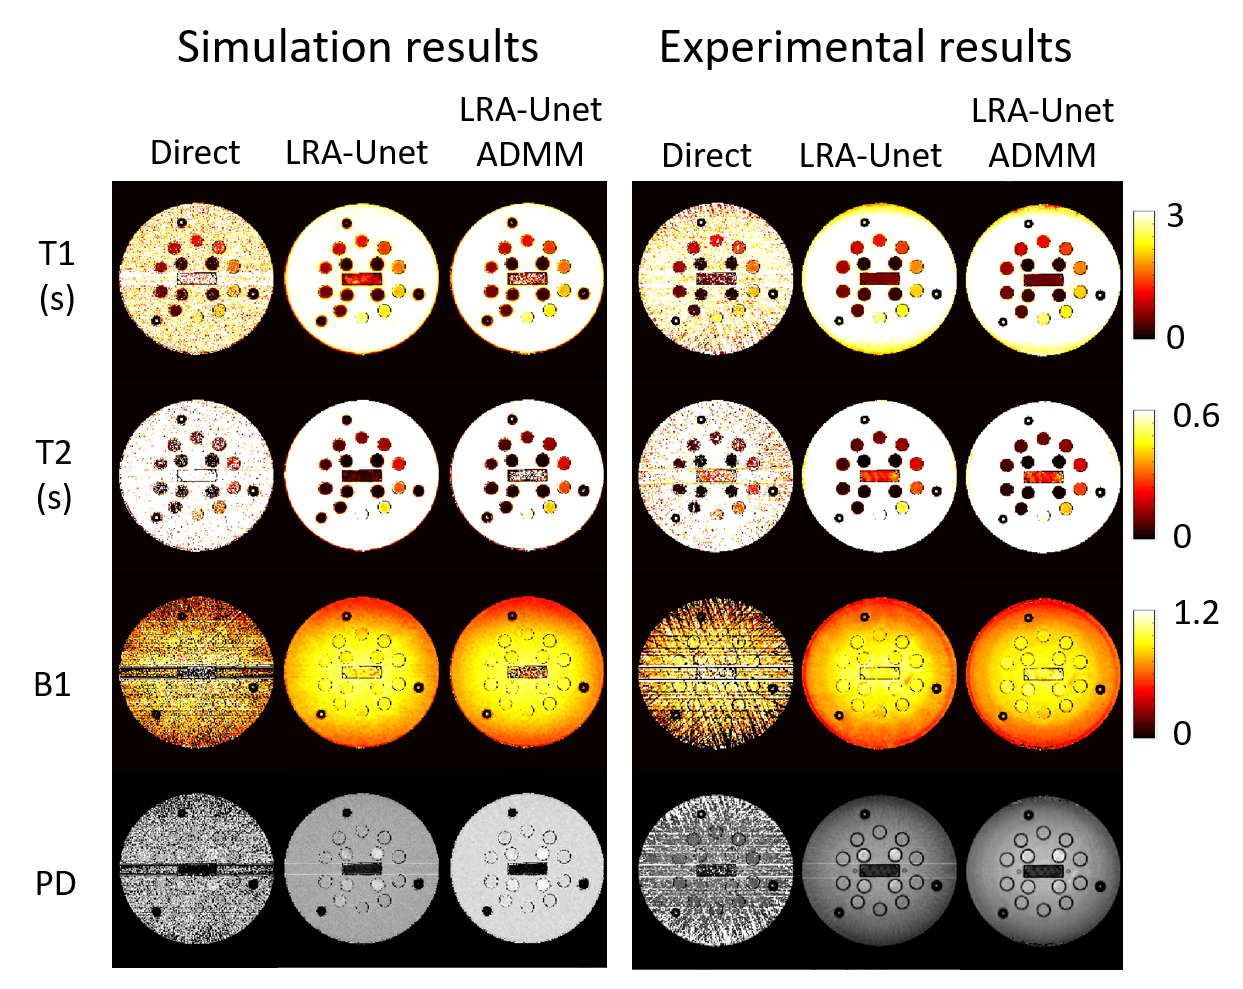
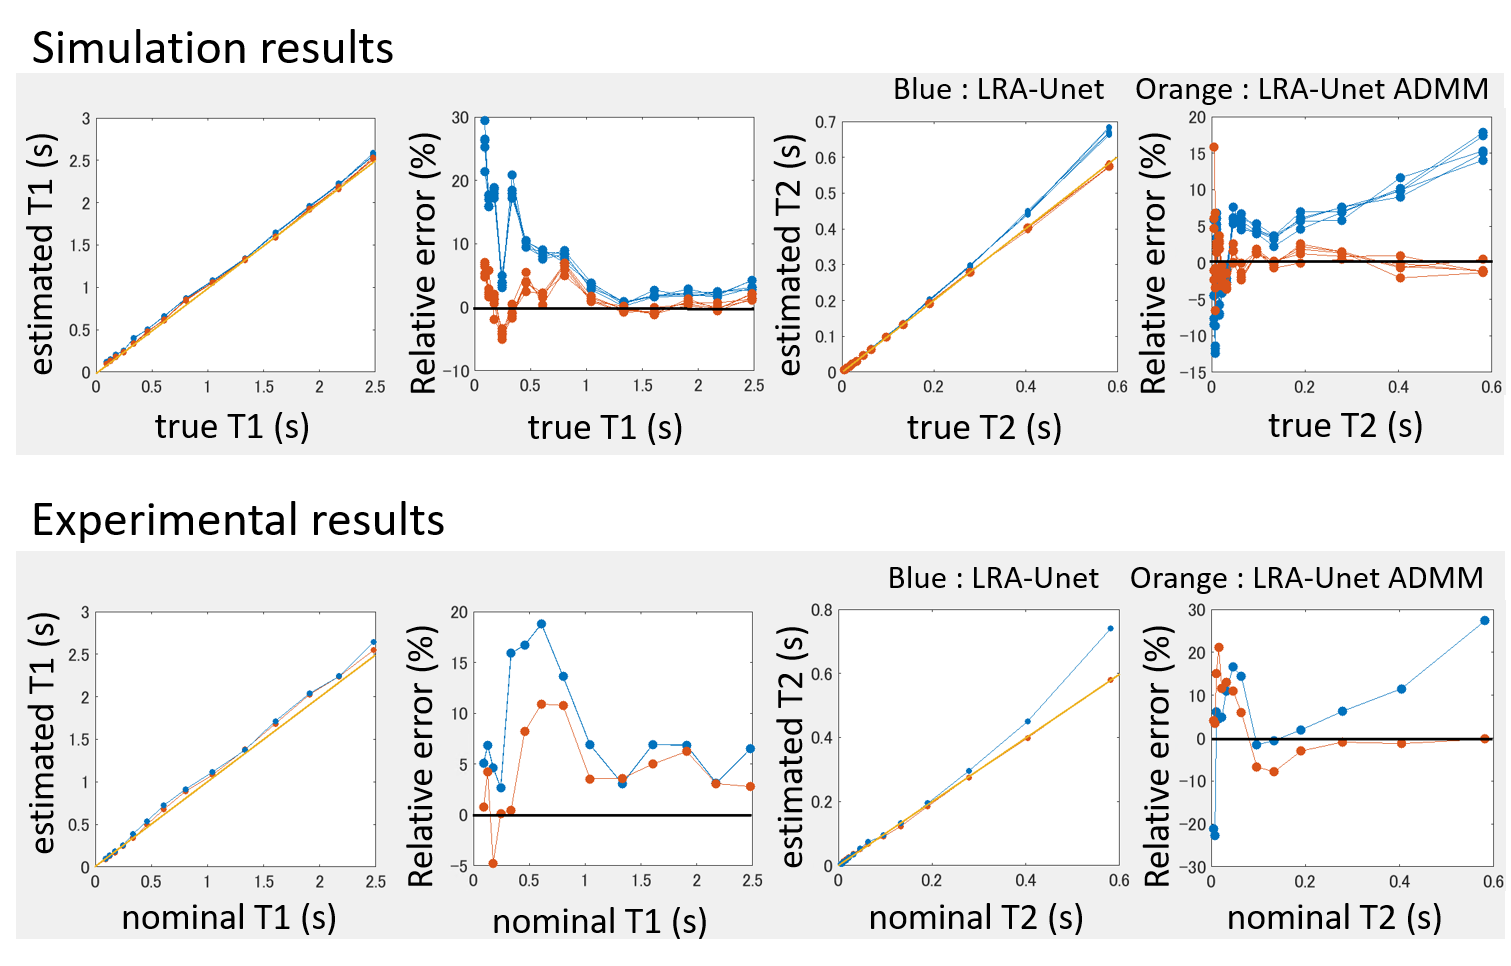
Figure 2 shows reconstructed images using 3 methods of random generated numerical system phantoms. The relative error of LRA-Unet ADMM method was smaller than other 2 method. Figure 3 shows mean estimated value of T1, T2 and their relative error in each region of randomly generated numerical system phantoms as function of their true value. It was confirmed that the relative error of T1 and T2 were reduced in LRA-Unet ADMM method. Figure 4 shows reconstructed maps using 3 methods of numerical and real NIST system phantom. Simulation results and experimental results were very similar. In LRA-Unet method, PD map had artifact stretched along the central rectangle. In LRA-Unet ADMM method, this artifact was removed. Figure 5 shows plot of quantitative values from reconstructed numerical and real NIST system phantom. At simulation, 5 calculation were examined with changing random noise component. Both T1 and T2 values were more accurate in LRA-Unet ADMM method than in LRA-Unet method.Discussion
In experimental results, the estimated T1 values were slightly larger than nominal values, it may be explained by the temperature effect which was not corrected in this study. And the relative errors of T2 were larger in the region of 200 ms or less than in the simulation, it may be explained by the imperfections in imaging. Also, in the PD map, the phantoms near the center, where T1 and T2 are small, tended to be high values. These errors will be fixed by optimizing the imaging parameters and correct the imperfections in imaging.Conclusion
From the data acquired by tsDESPOT, full sampled low rank approximated images were estimated using LRA-Unet ADMM method which optimize Unet estimation and data consistency, then accurate quantitative maps were reconstructed using dense neural network.Acknowledgements
No acknowledgement found.References
1. Dan Ma, Vikas Gulani, Nicole Seiberlich, Kecheng Liu, Jeffrey L. Sunshine, Jeffrey L. Duerk, and Mark A. Griswold. Magnetic resonance fingerprinting. Nature, 495(7440):187–192, 2013.
2. Sean C.L. Deoni, Quantitative Relaxometry of the Brain, Magn Reson Imaging. 2010, 21, 101-113.
3. Debra F. McGivney, Eric Pierre, Dan Ma, Yun Jiang, Haris Saybasili, Vikas Gulani, and Mark A. Griswold, SVD Compression for Magnetic Resonance Fingerprinting in the Time Domain. IEEE Trans Med Imaging. 2014 December; 33(12): 2311–2322.
4. Cohen O, Zhu B, Rosen MS. MR fingerprinting deep reconstruction network (DRONE). Magnetic resonance in medicine. 2018 Sep;80(3):885-94.
5. Yiling Xu, Elisabeth Hoppe, Peter Speier, Thomas Kluge, Mathias Nittka, Gregor Körzdörfer, and Andreas Maier. Learning how to Clean Fingerprints -- Deep Learning based Separated Artefact Reduction and Regression for MR Fingerprinting, Proc. Intl. Soc. Mag. Reson. Med. 28 (2020) 3764
6. Assländer J, Cloos MA, Knoll F,
Sodickson DK, Hennig J, Lattanzi R. Low rank alternating
direction method of multipliers reconstruction for MR fingerprinting. Magn.
Reson. Med. 2018;79:83–96 doi: 10.1002/mrm.26639.
Figures