2172
In-Vivo evaluation of high resolution T2 mapping using Bloch simulations and MP-PCA image denoising1Department of Biomedical Engineering, Tel Aviv University, Tel Aviv, Israel, 2Department of Orthopedics, Shamir Medical Center, Zerifin, Israel, 3Sackler Faculty of Medicine, Tel Aviv University, Tel Aviv, Israel, 4Sagol School of Neuroscience, Tel Aviv University, Tel Aviv, Israel, 5Center for Advanced Imaging Innovation and Research (CAI2R), New-York University, Langone Medical Center, NY, United States
Synopsis
This study evaluates the performance of Marchenko-Pastur Principle Component Analysis (MP-PCA) denoising algorithm for improving T2 mapping precision using the EMC algorithm. Denoising efficiency was successfully validated on in vivo brain and knee scans, showing an increase in T2 maps’ precision while preserving anatomical features. This enables precise mapping of T2 values at high-resolutions. The proposed method can benefit a wide range of clinical applications, and carries the potential to enhance the detection of abnormalities on both T2 weighted images and qualitative T2 maps.
Introduction
High resolution mapping of T2 relaxation times can benefit clinical applications by offering improved anatomic details, enhancing the ability to assess tissue architecture, and identify early pathology1. Moreover, some applications necessitate the use of high in-plane resolution and thin slices for accurate analysis, e.g., when scanning the pituitary gland, the internal auditory canal, the articular cartilage, the spine or the cortical layers of the brain2–5. Increasing the spatial resolution while leaving the rest of the scanning parameters unchanged, however, causes major decrease of signal-noise-ratio (SNR). This impairs the quality of the resulting images and the accuracy of the ensuing radiological interpretation, whether qualitative or quantitative. To address this, we utilized the Marchenko-Pastur Principle Component Analysis (MP-PCA) algorithm to denoise MSE (Multi Spin-Echo) relaxometry data, and incorporated it as an additional pre-processing step to the EMC T2 mapping algorithm6. Performance of the new denoising algorithm is presented on in vivo brain and knee data.Methods
Brain ScansAll in vivo scans were performed after obtaining an informed consent and under the approval of the local Helsinki and IRB committees. Brain imaging was done for two healthy volunteers. Data were acquired using the same standard MSE sequence. Scan parameters for the first volunteer were: slice thickness=3 mm, in-plane resolution=1x1 mm2 (matrix size=216x180), FOV=216x180 mm2, TE/TR=10/3000 ms, NEchoes=15, acquisition BW=210 Hz/Px. No undersampling was applied. Scan parameters for the second volunteer: slice thickness=1 mm, in-plane resolution=0.6x0.6 mm2 (matrix size=324x300), FOV=192x178 mm2, TE/TR=12/2500 ms, NEchoes=20, GRAPPA acceleration factor=2, acquisition BW=205 Hz/Px.
Knee Scan
Knee MSE scans were performed on a single healthy volunteer. Scan parameters were: slice thickness=1.5 mm, in-plane resolution=0.4x0.4 mm2 (matrix size=448x280), FOV=192x120 mm2, TE/TR=12.1/2500 ms, NEchoes=15, GRAPPA acceleration factor=2, BW=199 Hz/Px.
Data Analysis
Denoising was performed on a sliding window over a set of complex images reconstructed from the data of each receive channel separately. Window sizes were selected as follows: first brain scan – 5x5, second brain scan – 15x15, knee scan – 20x10. For each window, only a small number of principal components was kept, based on the distribution of the eigenvalues of the data covariance matrix. Detailed description of the MP-PCA algorithm used in this study can be found at Does et al7 and Veraart et al8. Magnitude images were later produced using the Sum of Squares method, and were then given as input for the Bloch-simulation based EMC algorithm in order to produce T2 maps6.
Results
Fig. 1 shows a PCA image-denoised T2 map (window size 5x5). Eight ROIs were extracted using the FreeSurfer software9 and marked on the image: (1) Genu of corpus callosum; (2) Left caudate; (3) Right caudate; (4) Left Putamen; (5) Right Putamen; (6) Left Thalamus; (7) Right Thalamus; (8) Splenium of corpus callosum. Table 1 presents the mean, standard deviation (SD) and coefficient of variation (CV) of T2 values in the eight selected ROIs. Shown are the T2 values generated from the original (pre-denoising) images, and T2 values generated from PCA-denoised images using a 5x5 and 7x7 window sizes. For both window sizes, the inclusion of denoising reduced the standard deviation and CV. A small decrease in T2 mean value is also apparent post-denoising owing to the removal of Rician noise which elevates the tail of the T2 decay curve.In order to get a visual illustration of the noise removed, relative [%] difference between an original image and its corresponding denoised counterpart was calculated per voxel, and shown in Fig. 2. Left and middle images correspond to pre- and post-denoising of the 8th echo image of an in vivo brain MESE scan (window size 5x5). On the right panel is the relative difference between the left and the middle images.
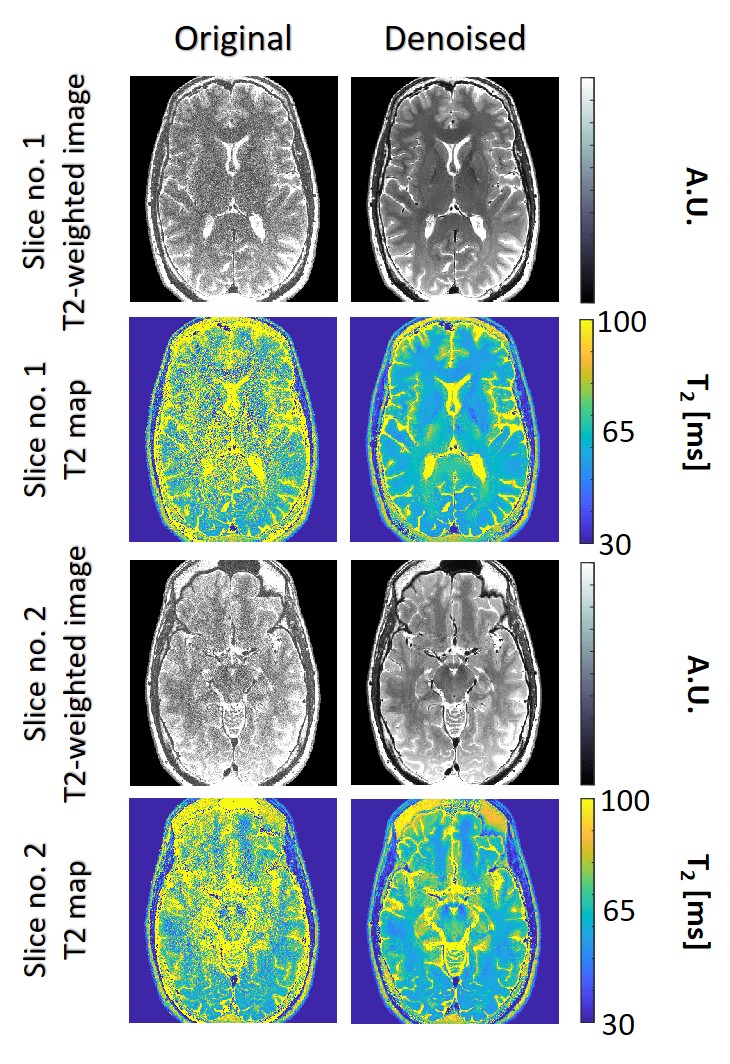
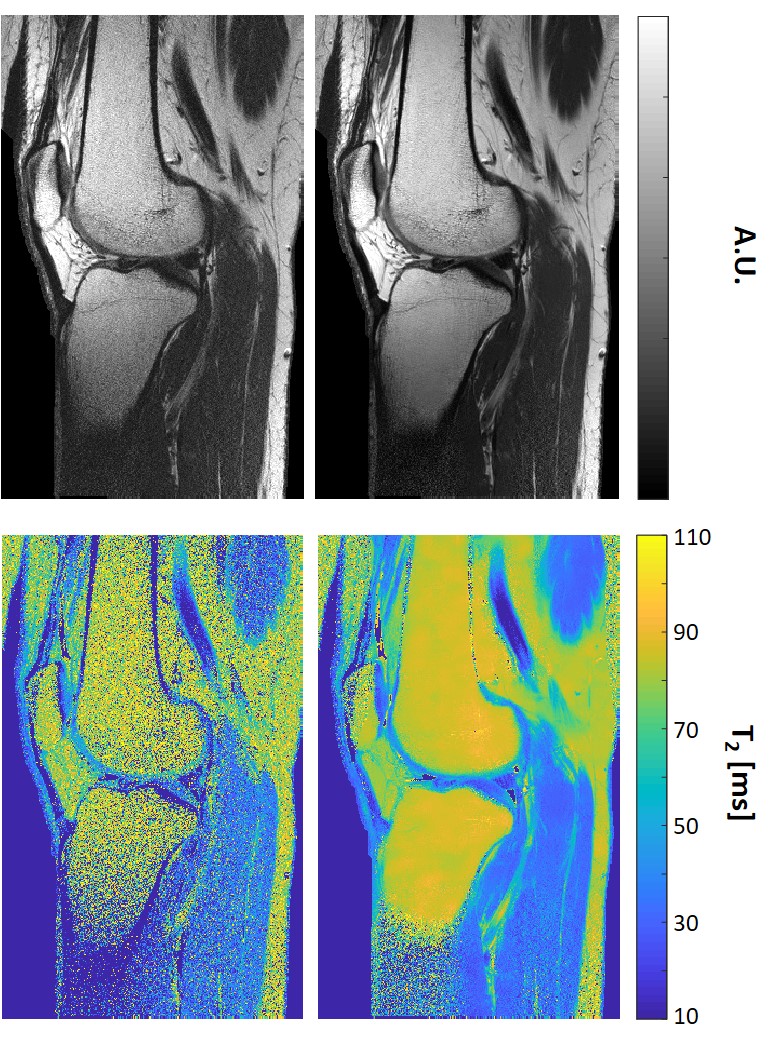
Fig. 3 shows T2 weighted images and T2 maps for two slices acquired using the second high-resolution in vivo brain scan. Left / right columns show the pre- / post-denoising images and T2-maps (window size 15x15). A clear decrease in noise level is apparent post MP-PCA denoising, while visual inspection did not reveal any loss of features or spatial resolution. Additional results for a knee scan are shown in Fig. 4, presenting pre- and post-denoising T2-weighted images and T2 maps of a single slice. Visual inspection of a representative slide from the knee scan shows consistent noise reduction and preservation of morphological features.
Discussion
The MP-PCA image denoising technique was successfully validated on in vivo T2 relaxation data showing an increase in the maximal achievable resolution without visible edge blurring. Quantitative analysis of the suggested technique included comparison of the SD and CV of the T2 values within selected ROIs. Our presumption that the decrease in SD and CV stem from the removal of noise rather than from anatomical differences is based on previous experiments done in phantoms, showing an SD and CV decrease in the T2 values of a uniform solution after the application of MP-PCA denoising (results not shown).Acknowledgements
ISF Grant 2009/17References
1. Rahbar H, Partridge SC, DeMartini WB, Thursten B, Lehman CD. Clinical and technical considerations for high quality breast MRI at 3 tesla. J Magn Reson Imaging. 2013;37(4):778-790. doi:10.1002/jmri.23834
2. Paunipagar B, Rasalkar D. Imaging of articular cartilage. Indian J Radiol Imaging. 2014;24(3):237. doi:10.4103/0971-3026.137028
3. Trampel R, Bazin PL, Pine K, Weiskopf N. In-vivo magnetic resonance imaging (MRI) of laminae in the human cortex. Neuroimage. 2019;197(April 2017):707-715. doi:10.1016/j.neuroimage.2017.09.037
4. Li Z, Chen YA, Chow D, Talbott J, Glastonbury C, Shah V. Practical applications of CISS MRI in spine imaging. Eur J Radiol Open. 2019;6(May):231-242. doi:10.1016/j.ejro.2019.06.001
5. Benson JC, Carlson ML, Lane JI. MRI of the internal auditory canal, labyrinth, and middle ear: How we do it. Radiology. 2020;297(2):252-265. doi:10.1148/RADIOL.2020201767
6. Ben-Eliezer N, Sodickson DK, Block KT. Rapid and accurate T2 mapping from multi-spin-echo data using bloch-simulation-based reconstruction. Magn Reson Med. 2015;73(2):809-817. doi:10.1002/mrm.25156
7. Does MD, Olesen JL, Harkins KD, et al. Evaluation of principal component analysis image denoising on multi-exponential MRI relaxometry. Magn Reson Med. 2019;81(6):3503-3514. doi:10.1002/mrm.27658
8. Veraart J, Novikov DS, Christiaens D, Ades-aron B, Sijbers J, Fieremans E. Denoising of diffusion MRI using random matrix theory. Neuroimage. 2016;142:394-406. doi:10.1016/j.neuroimage.2016.08.016
9. Fischl B. FreeSurfer. Neuroimage. 2012;62(2):774-781. doi:10.1016/j.neuroimage.2012.01.021
Figures
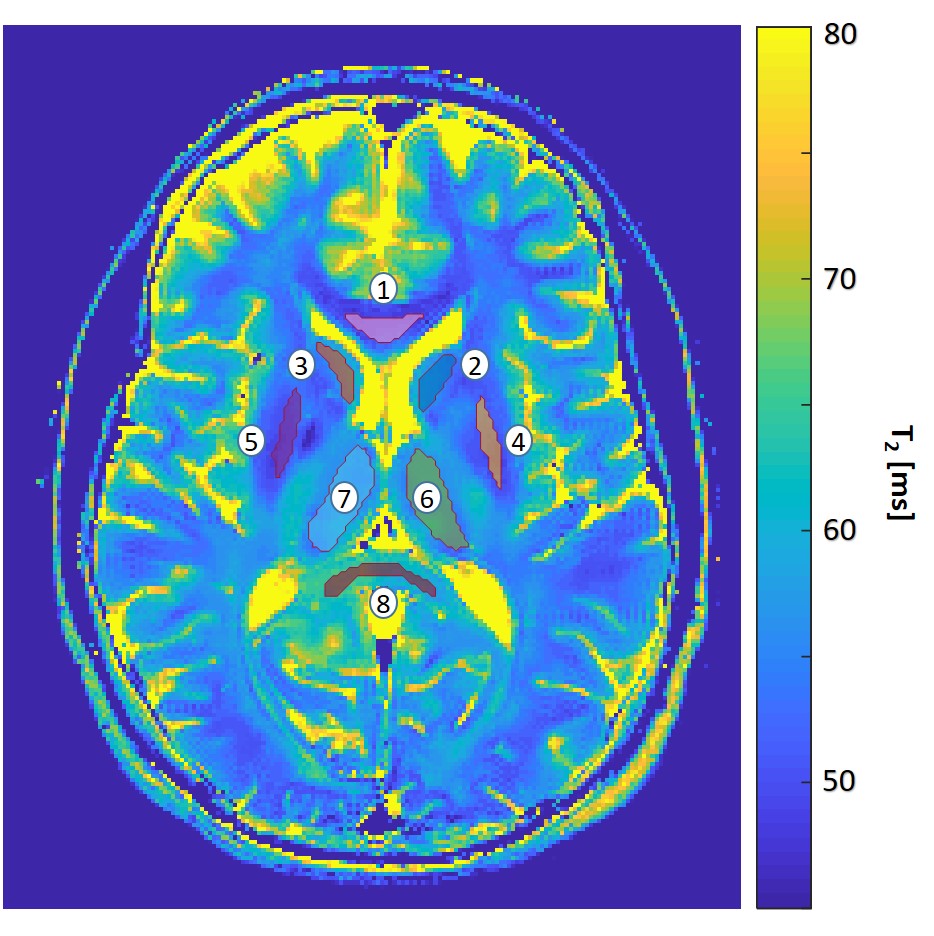
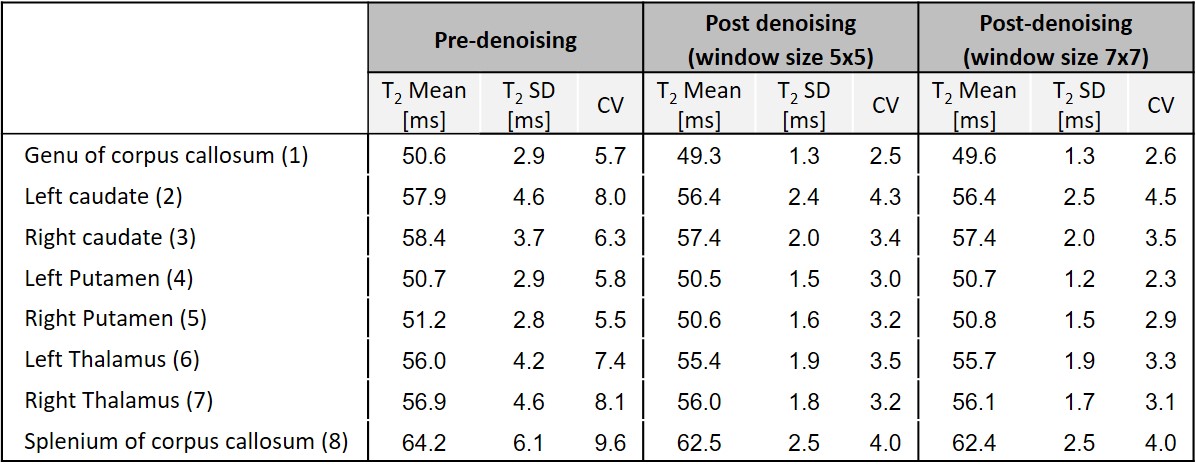
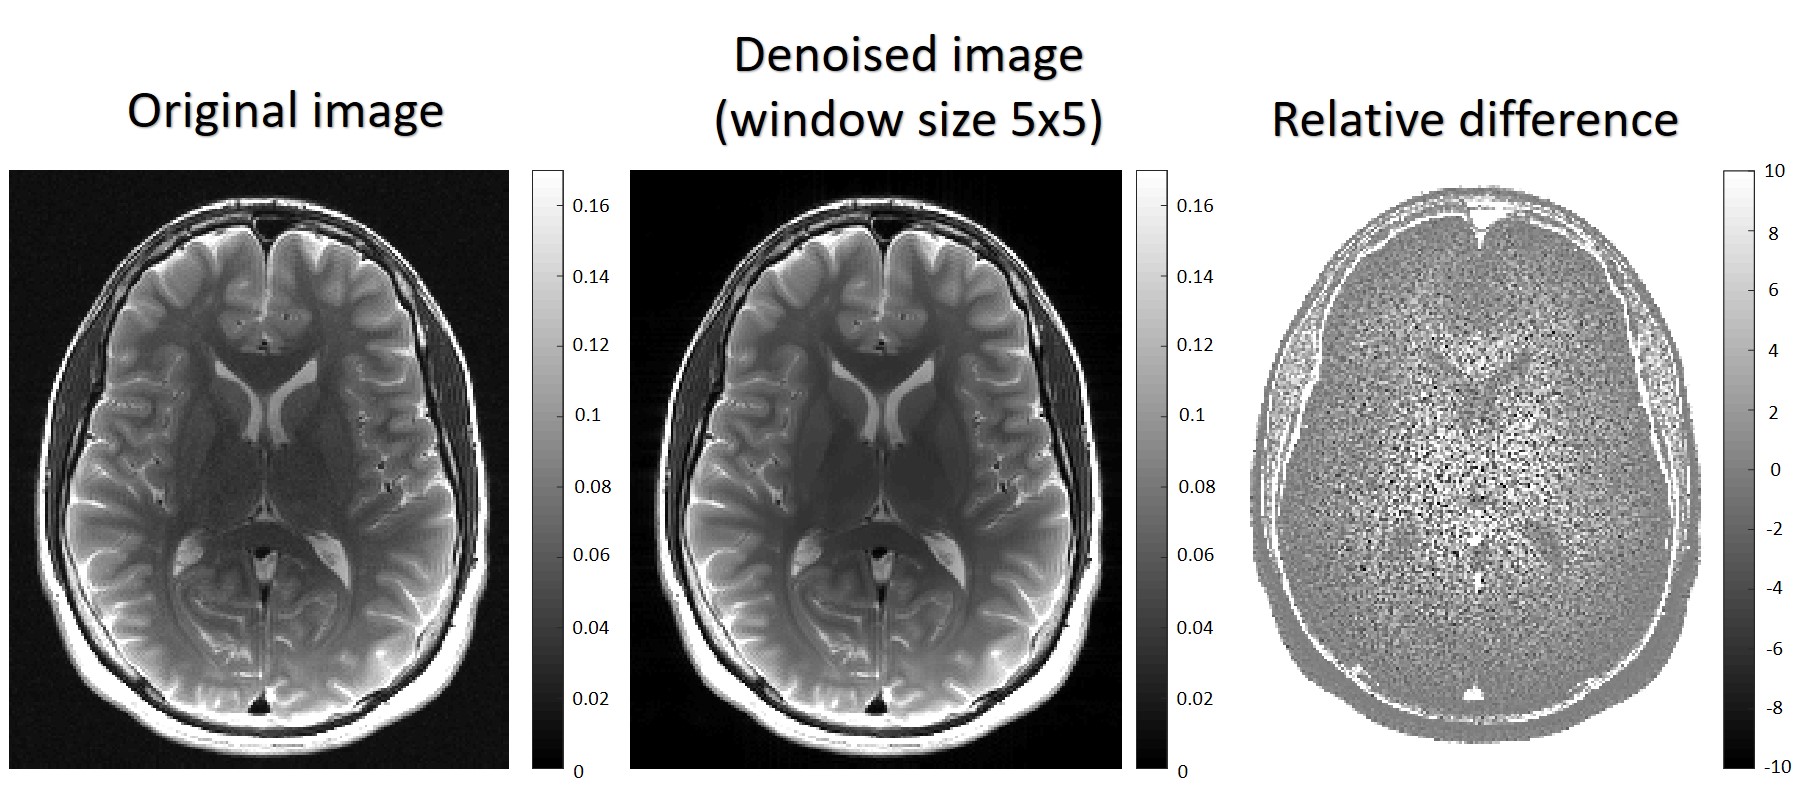
Figure 2: Left and middle images correspond to pre- and post-denoising of the 8th echo image of an in vivo brain MESE scan (window size 5x5). On the right panel is the relative difference between the left and the middle images.