2171
Myelin water fraction determination from relaxation times and proton density through deep learning neural network1Laboratory of Clinical Investigation, National Institute on Aging, Baltimore, MD, United States
Synopsis
MRI mapping of myelin water fraction (MWF), a surrogate of myelin content, has provided important insights into brain maturation and neurodegeneration, with promising potential use to quantify disease progression or therapeutic effect. Besides the complex modeling, MWF imaging, using either conventional or advanced methods such as the BMC-mcDESPOT approach, requires prolonged acquisition times, hampering their integration in clinical investigations. In this proof-of-concept work, we propose an artificial neural network model to derive MWF maps from conventional relaxation times and proton density maps. This work opens a way to further developments for practical and fast MWF imaging.
INTRODUCTION
Myelination changes are an important feature of brain development and the pathophysiology of several CNS diseases including multiple sclerosis and dementia (1-9). Advanced MR methods based on multicomponent relaxometry have been developed to probe myelin content through the measurement of myelin water fraction (MWF) (10-12). Among these methods, the BMC-mcDESPOT has been shown to provide accurate and precise MWF maps as compared to the original mcDESPOT approach (13-16), and has been used to provide quantitative evidence of myelin loss in dementia (5), to investigate myelination patterns with normative aging (4, 6, 7), and to demonstrate an association between myelin content and cerebral blood flow (17). However, MWF imaging methods, including BMC-mcDESPOT, require prolonged acquisition times, complex image processing, extensive computational time to generate a whole-brain MWF map, as well as the use of nonconventional MRI sequences, greatly limiting their applications in clinical investigation. Emerging evidence shows the feasibility of deep learning neural network (NN) algorithms to drastically shorten the computational time (18, 19), or to derive MWF maps from conventional anatomical and diffusion-weighted images (20). In this proof-of-concept work, we demonstrate that high-quality MWF maps can be derived from conventional relaxation times and proton density maps; this opens a way to further developments to reduce the acquisition time as well as the computational time and complexity needed in MWF imaging using BMC-mcDESPOT. This work is motivated by the high sensitivity of relaxation times and proton density to changes in myelin content (5, 21), and the assumption that a variation in myelin content will have a specific fingerprint on the variations in longitudinal and transverse relaxation times (T1 and T2) and proton density (PD) (22).METHODS
MRI27 participants have undergone our BMC-mcDESPOT protocol for MWF, PD, T1, and T2 mapping (7, 14, 15). Briefly, this protocol consisted of ten 3D SPGR images acquired with different flip angles (FAs), and ten 3D bSSFP images acquired with different FAs each acquired with RF excitation phase increments of 0° or 180° (7). B1 inhomogeneity correction was performed using the DAM (23) from two fast spin-echo images acquired with FAs of 45° and 90° (7).
For each participant, whole-brain PD and T1 maps were generated from the SPGR and DAM datasets using DESPOT1 (24), a whole-brain T2 map was generated from the bSSFP and DAM datasets using DESPOT2 (25), and a whole-brain MWF map was generated from the SPGR, bSSFP, and DAM datasets using BMC-mcDESPOT (7, 13-15).
NN structure, training, and testing
NN structure: The NN, containing 3 fully connected hidden layers, with 10, 20, and 10 neurons respectively, was constructed using Tensorflow (26) taking T1, T2, and PD as three inputs and predicting MWF as the output. The model was optimized by the adaptive moment estimation (ADAM) algorithm and each layer used a leaky rectified linear unit (ReLU) activation function to introduce the nonlinearity (19, 27). All weights were initialized by Xavier initializer and the loss function was the root-mean-squared-error (RMSE) function. The learning rate was initially set to 0.01 and gradually decreased through training. 50 epochs were iterated during training.
NN training: 25 participants’ derived MWF, PD, T1, and T2 maps were vectorized and used as training sets.
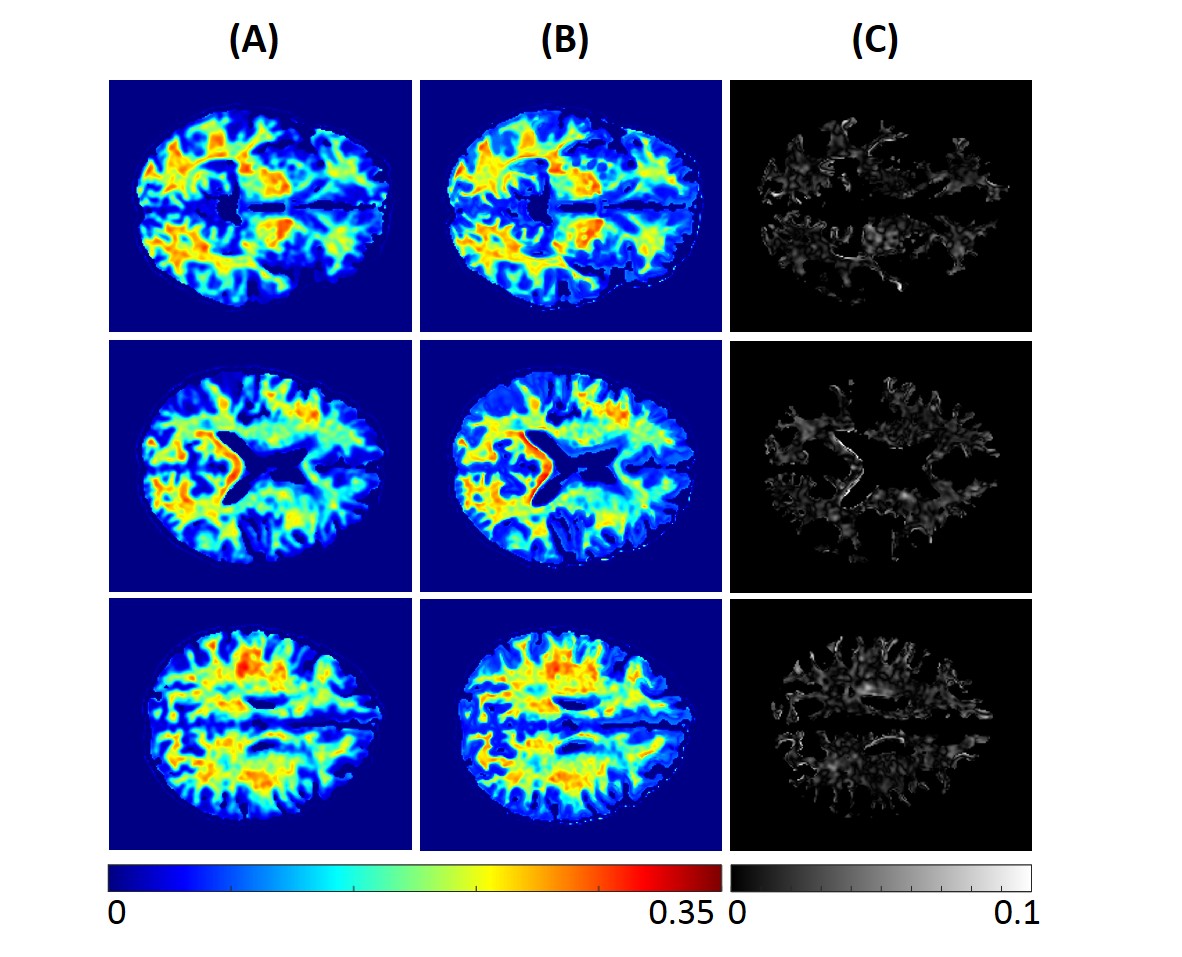
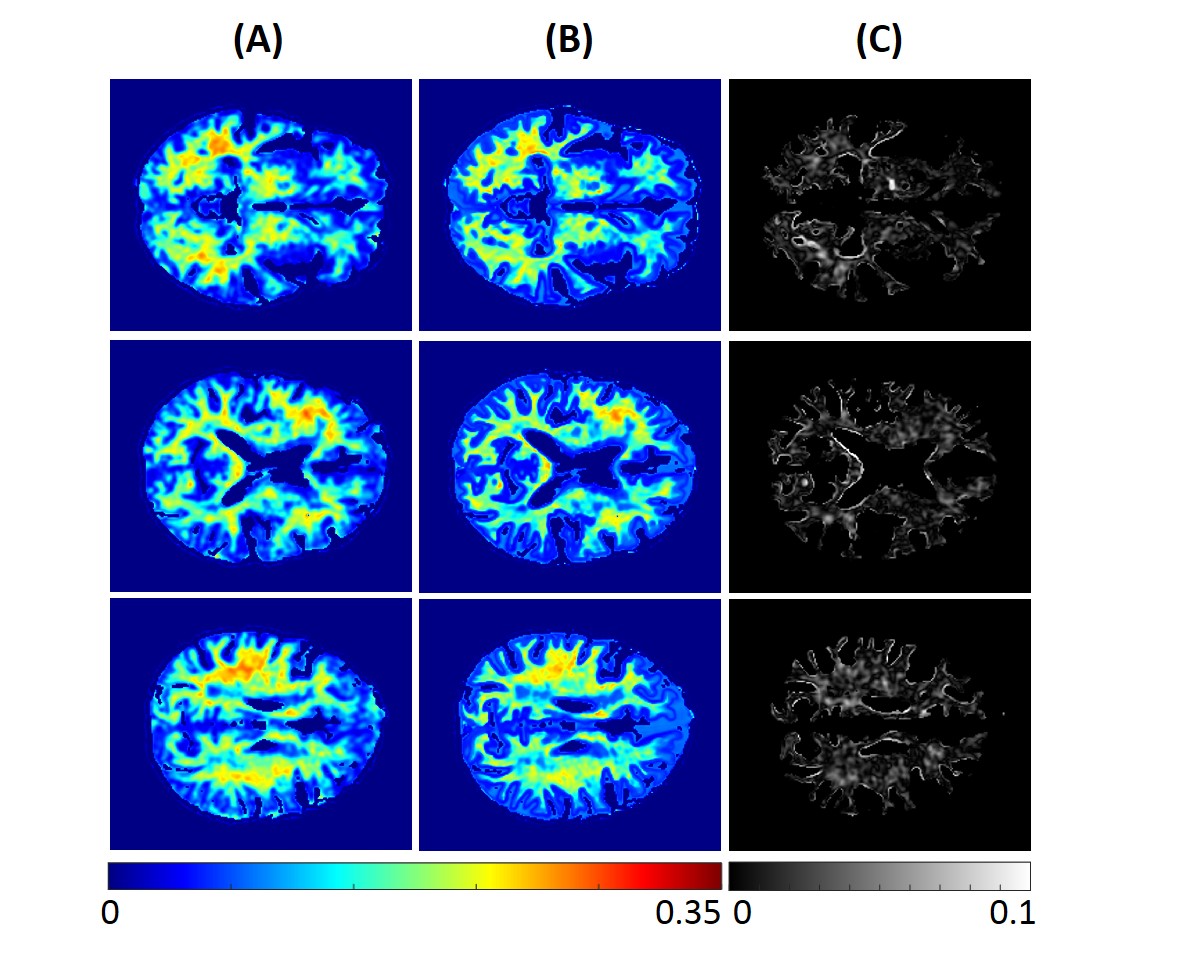
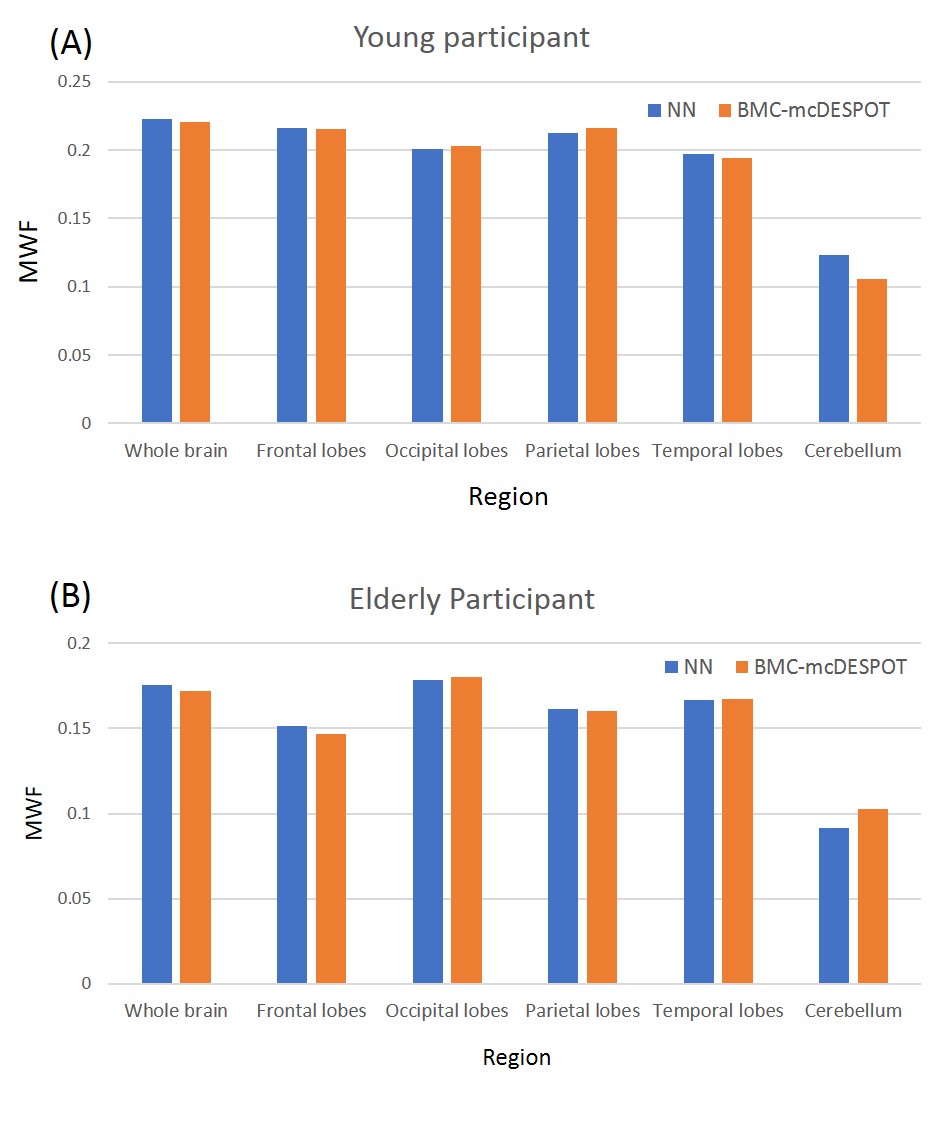
NN testing: Derived MWF, PD, T1, and T2 maps from two participants, corresponding to a young (21 yrs.) and an old (78 yrs.), were used for testing. To assess the performance of NN, for each participant, absolute difference maps were calculated from the BMC-mcDESPOT-MWF (i.e., the reference MWF map) and corresponding NN-MWF. Furthermore, whole-brain RMSE values as well as mean MWF values, calculated from different brain structures, were computed for further evaluation.
RESULTS & DISCUSSION
Using NN or BMC-mcDESPOT, whole-brain MWF maps, for each subject, were generated in ~2 s and ~30 hours, respectively. Figures 1 and 2 show three representative axial slices, covering different brain areas, of derived MWF maps using NN or BMC-mcDESPOT from the young or old subjects, respectively. Visual inspection of derived maps from NN or BMC-mcDESPOT indicates very similar regional MWF values and patterns. This is further highlighted in the corresponding absolute difference maps indicating marginal differences in most cerebral white matter regions. The RMSEs between the NN-MWF and the BMC-mcDESPOT MWF for the young and elderly participants were 0.006 and 0.0069, respectively. Finally, mean regional MWF values calculated within representative white matter brain regions show virtually identical values; this indicates that there are no obvious regional biases in derived MWF values between the NN and BMC-mcDESPOT approaches.In this work, as a proof-of-concept, relaxation times and PD maps were derived from all SPGR and bSSFP datasets obtained at different FAs. However, single component relaxation times and PD maps can be derived from datasets acquired with a limited number of FAs (24, 25); this will drastically reduce the total acquisition time for MWF imaging using NN. This is currently under investigation.
CONCLUSIONS
We demonstrated the feasibility of MWF mapping from conventional relaxation times and proton density maps. This work opens a way to further developments for rapid and practical MWF determination using conventional datasets.Acknowledgements
This work was supported by the Intramural Research Program of the National Institute on Aging of the National Institutes of Health. NK and ZG contributed equally to this work.References
1. Laule C, Leung E, Lis DK, Traboulsee AL, Paty DW, MacKay AL, et al. Myelin water imaging in multiple sclerosis: quantitative correlations with histopathology. Multiple sclerosis (Houndmills, Basingstoke, England). 2006;12(6):747-53.
2. MacKay AL, Laule C. Magnetic Resonance of Myelin Water: An in vivo Marker for Myelin. Brain Plasticity. 2016;2(1):71-91.
3. Arshad M, Stanley JA, Raz N. Adult age differences in subcortical myelin content are consistent with protracted myelination and unrelated to diffusion tensor imaging indices. NeuroImage. 2016;143:26-39.
4. Bouhrara M, Cortina LE, Rejimon AC, Khattar N, Bergeron C, Bergeron J, et al. Quantitative age-dependent differences in human brainstem myelination assessed using high-resolution magnetic resonance mapping. NeuroImage. 2020;206:116307.
5. Bouhrara M, Reiter D, Bergeron C, Zukley L, Ferrucci L, Resnick S, et al. Evidence of demyelination in mild cognitive impairment and dementia using a direct and specific magnetic resonance imaging measure of myelin content. Alzheimer's & Dementia. 2018;14(8):998-1004.
6. Bouhrara M, Rejimon AC, Cortina LE, Khattar N, Bergeron CM, Ferrucci L, et al. Adult brain aging investigated using BMC-mcDESPOT based myelin water fraction imaging. Neurobiology of aging. 2020;85:131-9.
7. Qian W, Khattar N, Cortina LE, Spencer RG, Bouhrara M. Nonlinear associations of neurite density and myelin content with age revealed using multicomponent diffusion and relaxometry magnetic resonance imaging. NeuroImage. 2020;223:117369.
8. Dean DC, Iii, Jerskey BA, Chen K, et al. Brain differences in infants at differential genetic risk for late-onset Alzheimer disease: A cross-sectional imaging study. JAMA Neurology. 2014;71(1):11-22.
9. Dean DC, 3rd, O'Muircheartaigh J, Dirks H, Travers BG, Adluru N, Alexander AL, et al. Mapping an index of the myelin g-ratio in infants using magnetic resonance imaging. NeuroImage. 2016;132:225-37.
10. MacKay A, Whittall K, Adler J, Li D, Paty D, Graeb D. In vivo visualization of myelin water in brain by magnetic resonance. Magnetic resonance in medicine. 1994;31(6):673-7.
11. Prasloski T, Rauscher A, MacKay AL, Hodgson M, Vavasour IM, Laule C, et al. Rapid whole cerebrum myelin water imaging using a 3D GRASE sequence. NeuroImage. 2012;63(1):533-9.
12. Whittall KP, MacKay AL, Graeb DA, Nugent RA, Li DK, Paty DW. In vivo measurement of T2 distributions and water contents in normal human brain. Magnetic resonance in medicine. 1997;37(1):34-43.
13. Bouhrara M, Spencer RG. Incorporation of nonzero echo times in the SPGR and bSSFP signal models used in mcDESPOT. Magnetic resonance in medicine. 2015;74(5):1227-35.
14. Bouhrara M, Spencer RG. Improved determination of the myelin water fraction in human brain using magnetic resonance imaging through Bayesian analysis of mcDESPOT. Neuroimage. 2016;127:456-71.
15. Bouhrara M, Spencer RG. Rapid simultaneous high-resolution mapping of myelin water fraction and relaxation times in human brain using BMC-mcDESPOT. Neuroimage. 2017;147:800-11.
16. Bouhrara M, Reiter DA, Celik H, Fishbein KW, Kijowski R, Spencer RG. Analysis of mcDESPOT- and CPMG-derived parameter estimates for two-component nonexchanging systems. Magnetic resonance in medicine. 2016;75(6):2406-20.
17. Bouhrara M, Alisch J, Nikkita N, Kim R, Rejimon A, Cortina L, et al. Association of cerebral blood flow with myelin content in cognitively unimpaired adults BMJ Neurology Open. 2020;2:e000053.
18. Liu H, Xiang Q-S, Tam R, Dvorak AV, MacKay AL, Kolind SH, et al. Myelin water imaging data analysis in less than one minute. NeuroImage. 2020;210:116551.
19. Lee J, Lee D, Choi JY, Shin D, Shin HG, Lee J. Artificial neural network for myelin water imaging. Magn Reson Med. 2020;83(5):1875-83.
20. Drenthen GS, Backes WH, Jansen JFA. Estimating myelin-water content from anatomical and diffusion images using spatially undersampled myelin-water imaging through machine learning. NeuroImage. 2021;226:117626.
21. Yeatman JD, Wandell BA, Mezer AA. Lifespan maturation and degeneration of human brain white matter. Nature communications. 2014;5:4932-.
22. Warntjes M, Engström M, Tisell A, Lundberg P. Modeling the Presence of Myelin and Edema in the Brain Based on Multi-Parametric Quantitative MRI. Frontiers in Neurology. 2016;7(16).
23. Deoni SC. Correction of main and transmit magnetic field (B0 and B1) inhomogeneity effects in multicomponent-driven equilibrium single-pulse observation of T1 and T2. Magn Reson Med. 2011;65(4):1021-35.
24. Deoni SC, Peters TM, Rutt BK. High-resolution T1 and T2 mapping of the brain in a clinically acceptable time with DESPOT1 and DESPOT2. Magnetic resonance in medicine. 2005;53(1):237-41.
25. Deoni SC. Transverse relaxation time (T2) mapping in the brain with off-resonance correction using phase-cycled steady-state free precession imaging. Journal of magnetic resonance imaging: JMRI. 2009;30(2):411-7.
26. Abadi M, Agarwal A, Barham P, Brevdo E, Chen Z, Citro C, et al. Tensorflow: Large-scale machine learning on heterogeneous distributed systems. . arXiv preprint 2016.
27. Jung S, Lee H, Ryu K, Song JE, Park M, Moon WJ, et al. Artificial neural network for multi-echo gradient echo-based myelin water fraction estimation. Magn Reson Med. 2021;85(1):380-9.
Figures