2170
Free-breathing Abdomen T2 mapping via Single-shot Multiple Overlapping-echo Acquisition and Deep Neural Network Reconstruction1Department of Electronic Science, Xiamen University, Xiamen, China, 2Department of Magnetic Resonance Imaging, The First Affiliated Hospital of Zhengzhou University, Zhengzhou University, Zhengzhou, China
Synopsis
Quantitative T2 mapping of abdomen has the potential for many clinical scenarios, such as for distinguishing cirrhosis and characterizing renal lesions. In this study, we applied overlapping echo acquisition together with deep learning-based reconstruction to achieving T2 mapping of abdomen in single shot for the first time. The resulting abdominal T2 values are in good agreement with the reported ones. This method makes high temporal resolution quantitative abdominal imaging possible, and has strong motion robustness.
Introduction
Quantitative MRI is of great significance for clinical diagnosis. The quantitative imaging of abdomen is often challenging due to the influence of physiological movements, such as breathing and gastrointestinal peristalsis. Acquisition of high-quality abdominal MR images usually takes long time and requires good cooperation of the patient. Here a rapid technique,multiple overlapping-echo detachment (MOLED) acquisition1, for quantitative abdominal T2 imaging in free-breathing was developed.Methods
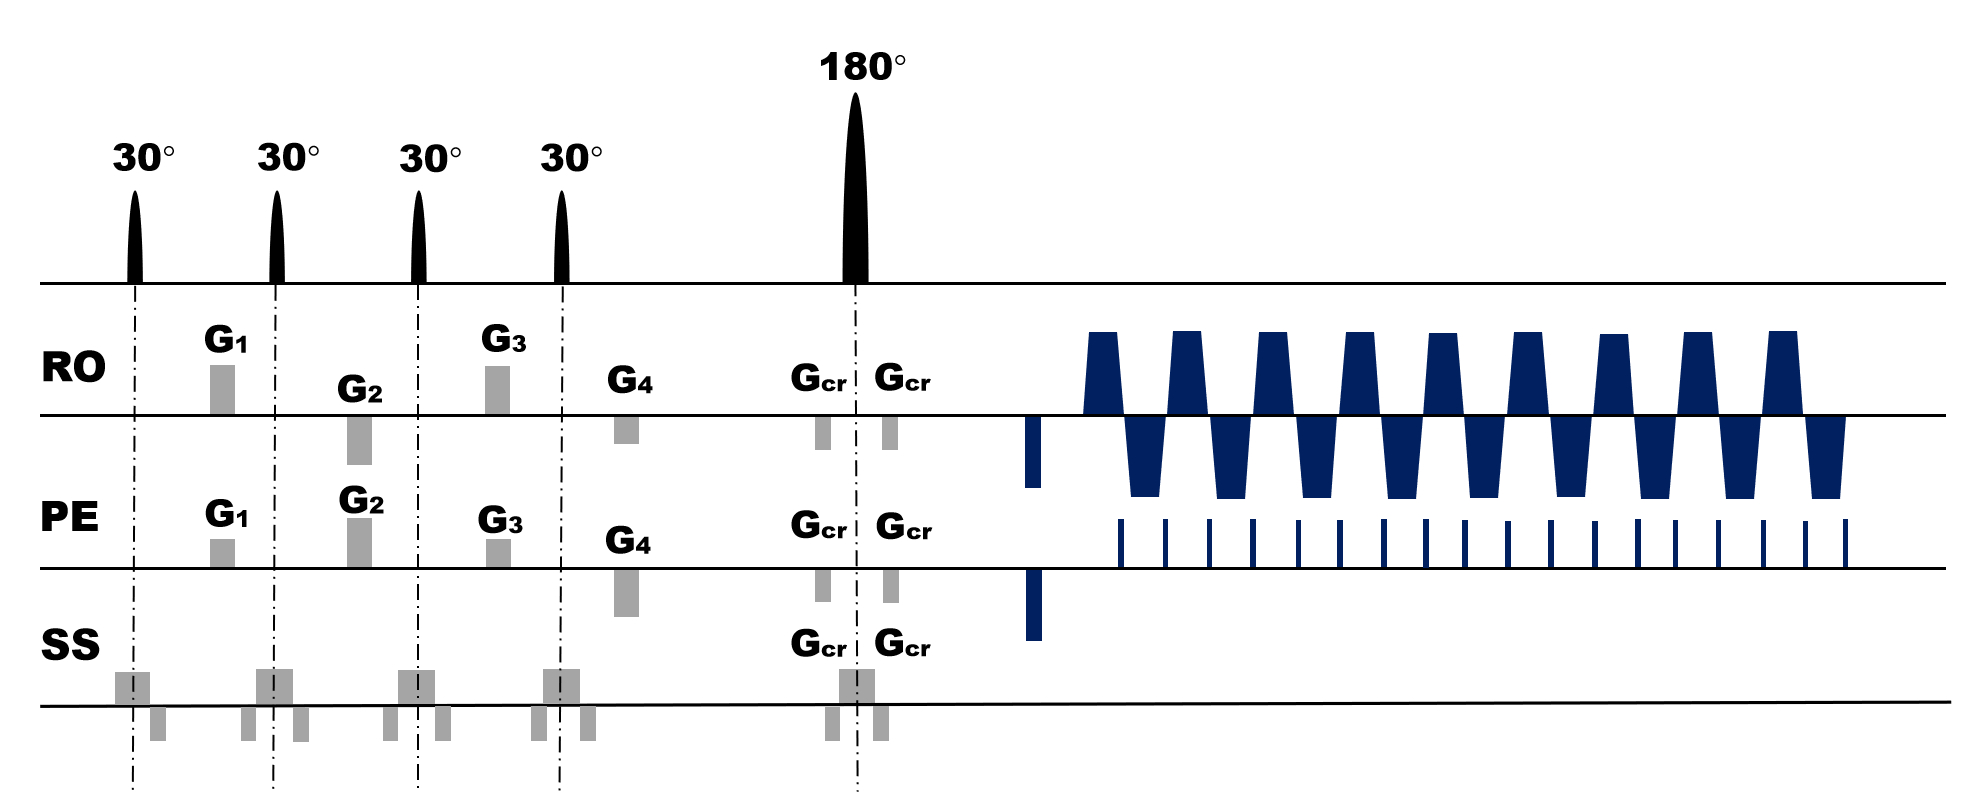
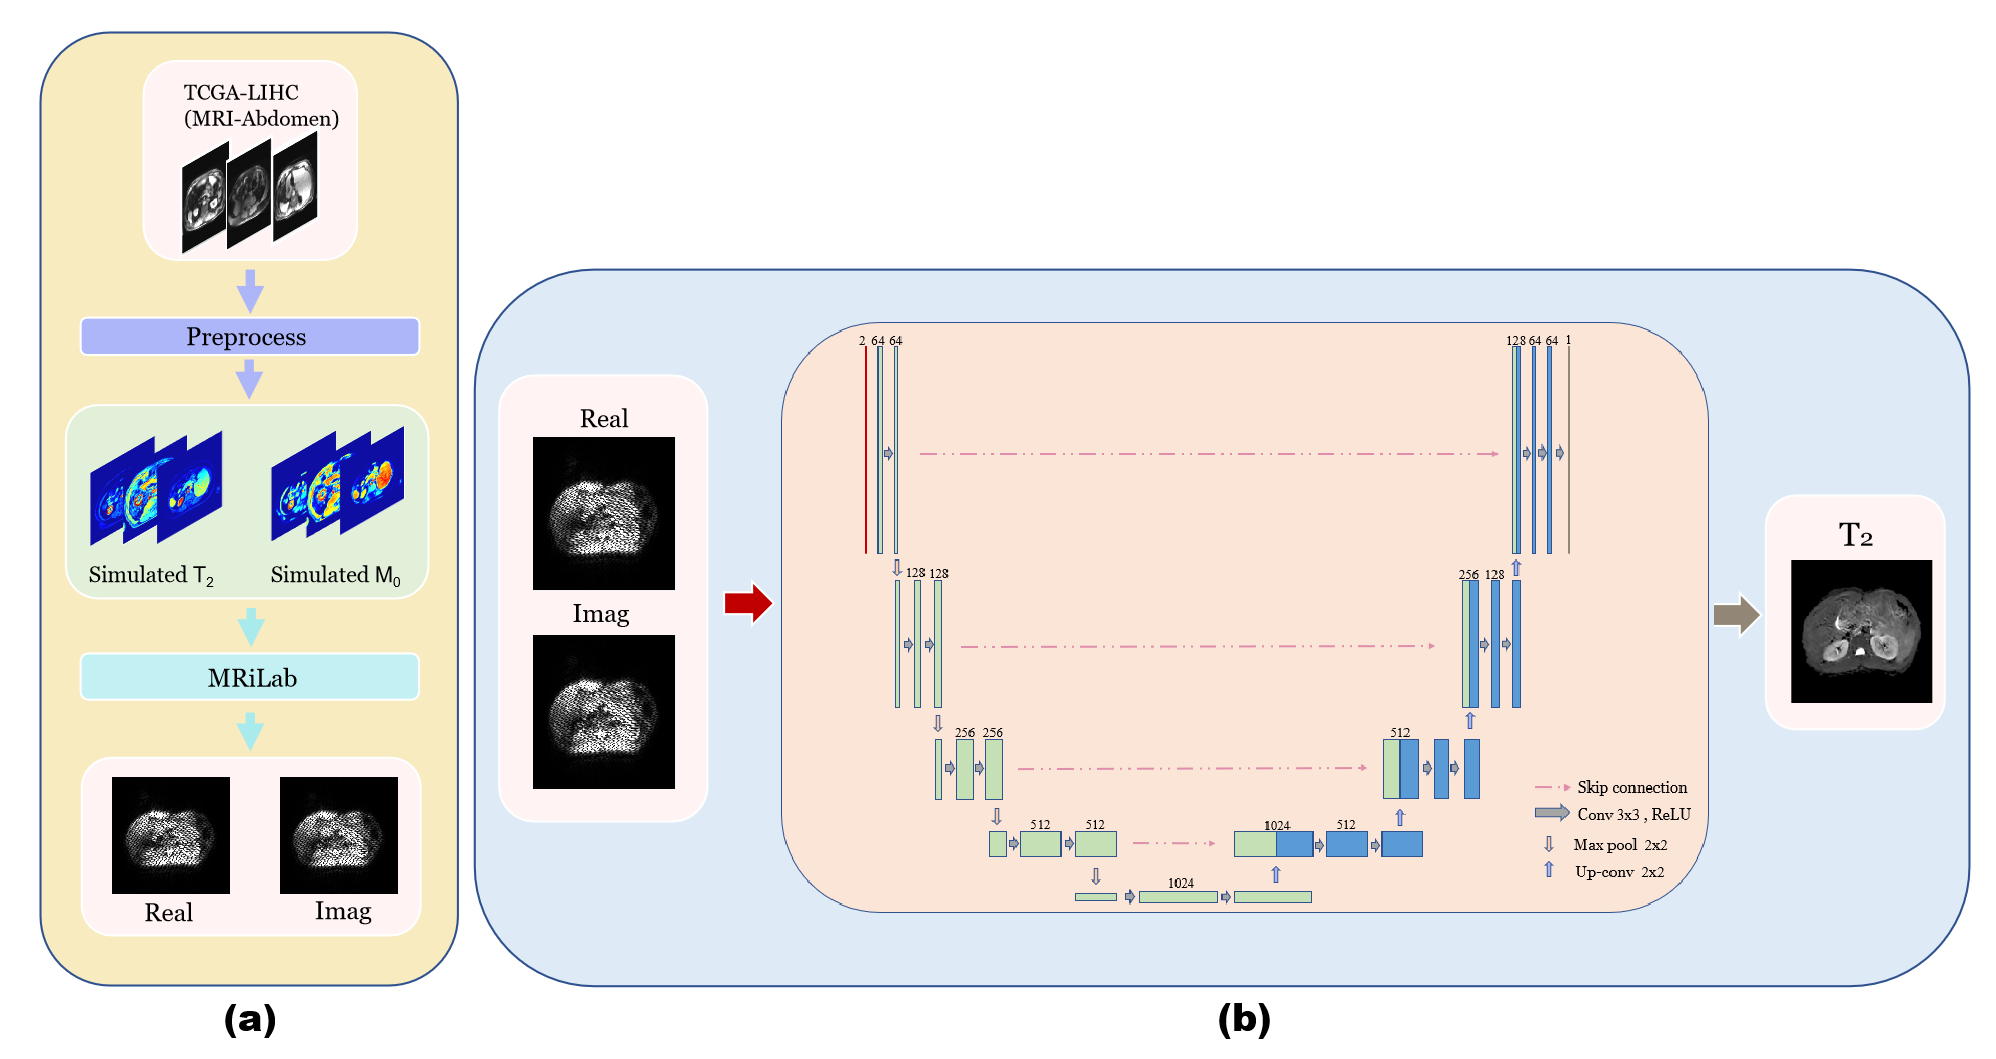
The single-shot MOLED sequence shown in Fig. 1 was implemented on a 3T clinical scanner. The abdominal MRI data were collected with following sequence parameters: TR = 2000 ms, TE = 66 ms, matrix = 128×128, FOV = 340×340 mm2, slice thickness = 5.0 mm. Acquisition was performed with an acceleration factor of 2. Fat suppression technology was used in the acquisition and respiratory trigger was not applied. To suppress the artifacts caused by odd-even phase difference, AC-LORAKS2 was adopted to complete the parallel reconstruction of images instead of traditional GRAPPA. The nonlinear mapping relationship between the acquired information and T2 value was captured by a U-Net. MRI simulation software (MRiLab)3 were used to generate training samples. Specially, T2 and M0 simulation templates are from the abdominal MRI images of TCGA-LIHC4. The whole simulation process and reconstruction process were shown in Fig. 2.Results
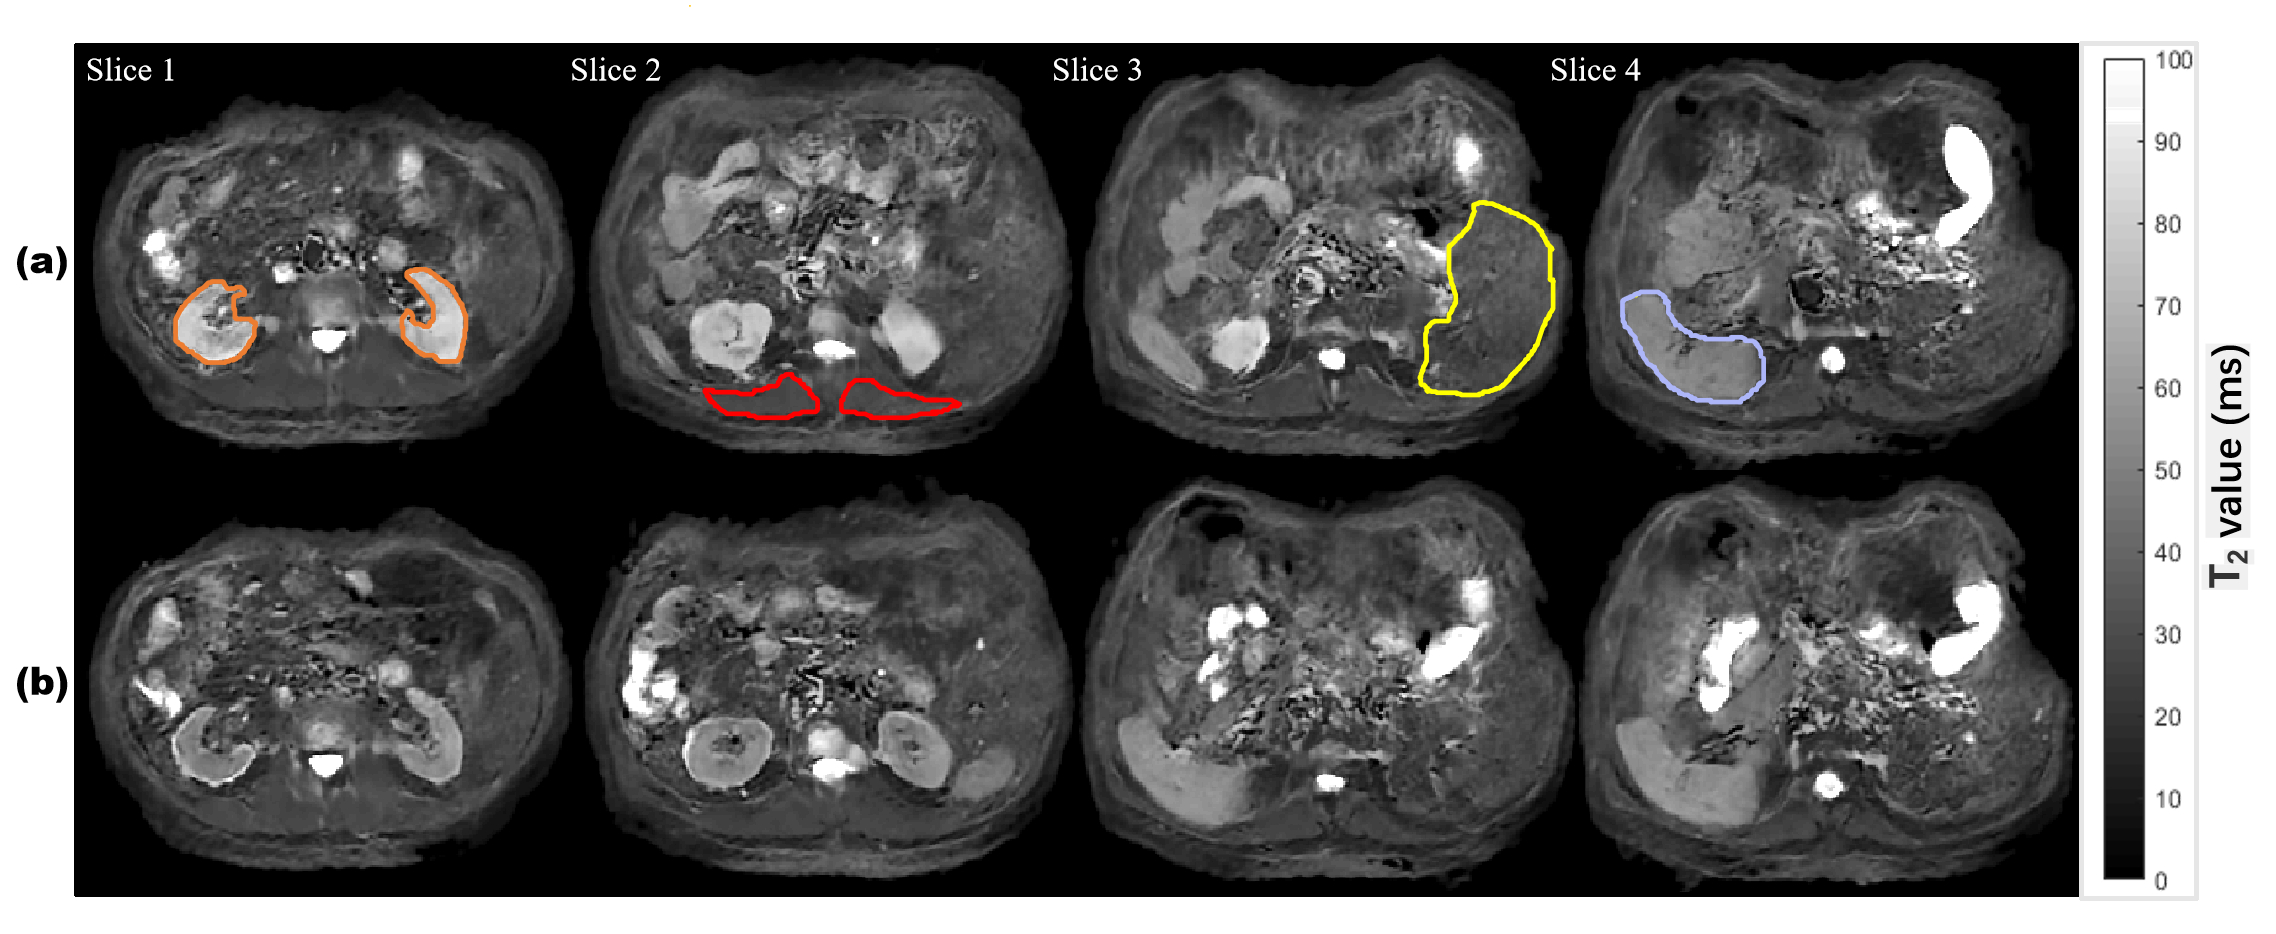
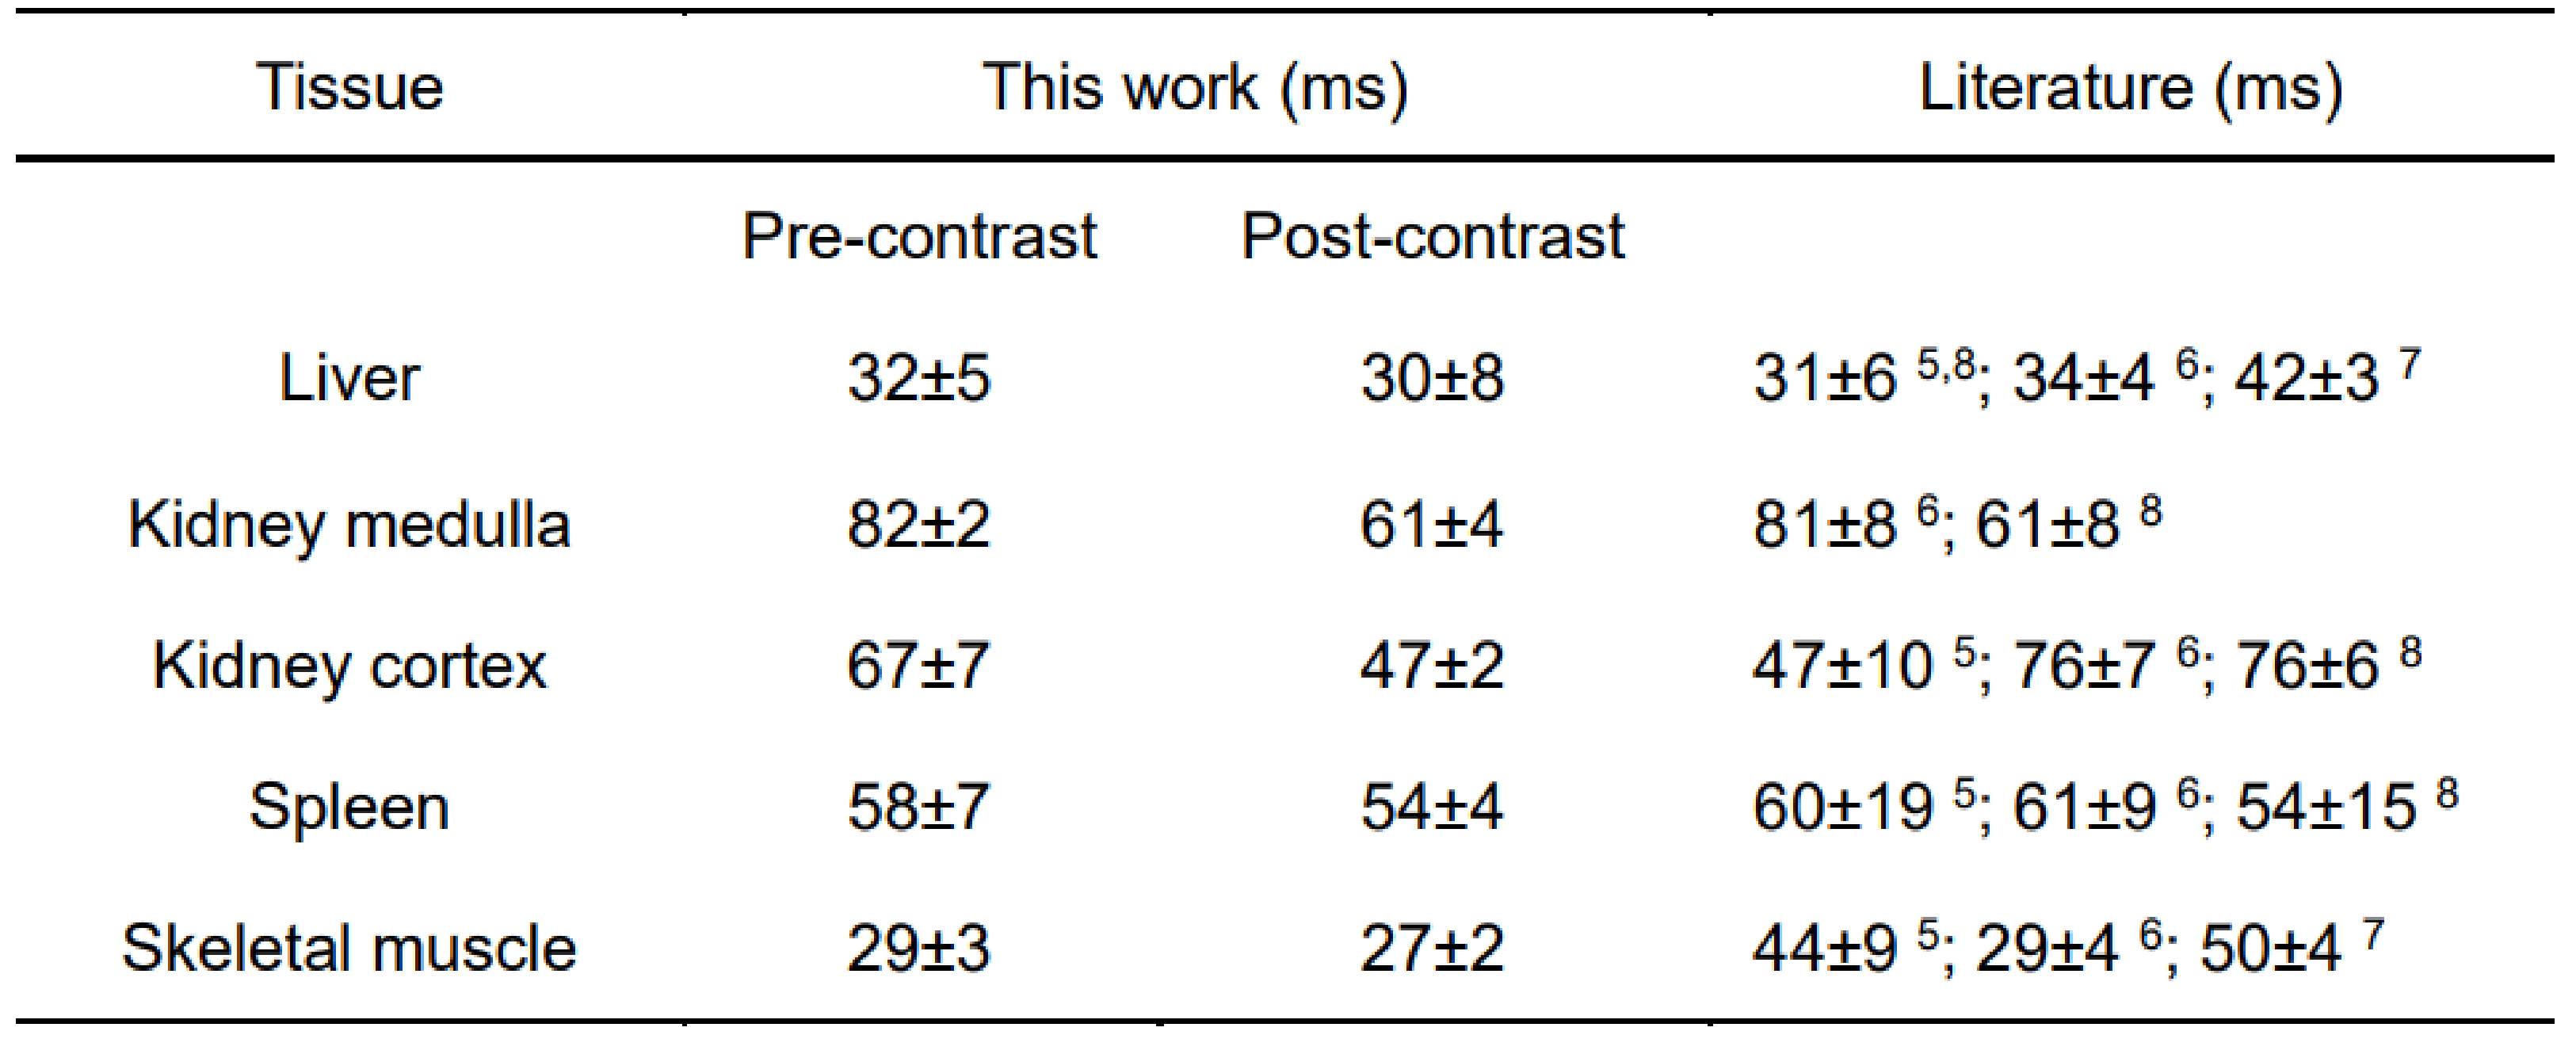
Fig. 3 shows the reconstructed abdominal T2 maps. The good quality of reconstructed T2 maps shows that MOLED imaging can perform well with high temporal resolution. The spleen, kidney, skeletal muscle and liver are circled and the mean T2 values inside them are given in Table 1. We can see that the T2 values of kidney are decreased obviously after contrast enhancement, whereas the T2 values of other tissues after contrast enhancement only show a slight decrease. For comparison, the T2 values reported previously are also provided in Table 1. It can be seen that the T2 values of pre-contrast in our study are within the reported ranges5-8, which demonstrates the reliability of our method.Conclusion
Single-shot quantitative abdominal T2 mapping based on MOLED and deep learning reconstruction has been shown to be effective in less than 150 ms acquisition time per slice. With the high temporal resolution of MOLED, we successfully achieved abdominal T2 mapping in completely free-breathing strategy, which has great potential in the clinical MR abdomen acquisition.Acknowledgements
This work was supported by the National Natural Science Foundation of China under grant numbers 11775184 and 81671674.References
1. Zhang J, Wu J, Chen SJ, et al. Robust single-shot T2 mapping via multiple overlapping-echo acquisition and deep neural network. IEEE Trans. Med. Imaging, 2019; 38: 1801-1811.
2. Haldar JP. Low-rank modeling of local k-space neighbor-hoods (LORAKS) for constrained MRI. IEEE Trans. Med. Imaging, 2014; 33: 668-681.
3. Liu F, Velikina JV, Block WF, et al. Fast realistic MRI simulations based on generalized multi-pool exchange tissue model. IEEE Trans. Med. Imaging, 2017; 36: 527-537.
4. Erickson BJ, Kirk S, Lee Y, et al. Radiology data from the cancer genome atlas liver hepatocellular carcinoma [TCGA-LIHC] collection. The Cancer Imaging Archive, 2016.
5. Ma D, Gulani V, Seiberlich N, et al. Magnetic resonance fingerprinting. Nature, 2013; 495: 187-192.
6. de Bazelaire CMJ, Duhamel GD, Rofsky NM, et al. MR imaging relaxation times of abdominal and pelvic tissues measured in vivo at 3.0 T: preliminary results. Radiology, 2004; 230: 652-659.
7. Stanisz GJ, Odrobina EE, Pun J, et al. T1, T2 relaxation and magnetization transfer in tissue at 3T. Magn. Reson. Med., 2005; 54: 507-512.
8. Hoad CL, Cox EF, Gowland PA. Quantification of T2 in the abdomen at 3.0 T using a T2-prepared balanced turbo field echo sequence. Magn. Reson. Med., 2010; 63: 356-364.
Figures