2168
Using an ANN to estimate Initial Values for Mapping of the Oxygen Extraction Fraction with combined QSM and qBOLD1Computer Assisted Clinical Medicine, Heidelberg University, Medical Faculty Mannheim, Mannheim, Germany
Synopsis
MRI-based mapping of oxygen extraction fraction with QSM and qBOLD is a non-invasive diagnostic tool with many possible applications. But current reconstruction methods based on quasi-Newton (QN) methods are very dependent on accurate parameter initialization. We compare the standard QN method with a clustering approach, and with a new initialization method in form of an ANN, which we previously developed to replace QN. This leads to reconstructed images with much less noise, compared to the direct output of the ANN and keeps the effect of reduced intersubject variability.
Introduction
The oxygen extraction fraction is an important indicator for the state of tissue in many pathologies, for example cancer1 or stroke2. Various MRI based OEF mapping methods have been developed in recent years, one of them uses a combination of Quantitative Susceptibility Mapping (QSM) and quantitative BOLD (qBOLD)3. An advantage of this method is, that it does not require to subject the patient to a hypercapnic or hyperoxic gas challenge4. But the results of the iterative reconstruction with a quasi-Newton (QN) method strongly depend on the parameter values used for initialization. One recent approach to find precise initial values is to combine voxels with similar signal development into clusters for an initial fit with higher signal to noise ratio (SNR)5. This leads to less noisy and more uniform OEF in healthy subjects. Another approach is to replace the QN fit with an artificial neural network (ANN)6. This leads to lower intersubject variation, but relatively noisy images. Now we propose to use the output of this ANN to initialize the QN method (ANN + QN).Methods
For seven healthy subjects brain data was acquired with a multi gradient echo (mGRE) sequence3, which we continue to use. The mGRE magnitude and phase signals are used for QSM reconstruction with MEDI+07 and the magnitude signal is corrected for macroscopic field inhomogeneity contributions8, before the qBOLD fit3. An additional arterial spin labeling (ASL) sequence was acquired3, which is used to provide starting values of the deoxygenated blood volume (dBV) for reconstruction with QN and Clustering. The ANN does not require any starting values for individual reconstructions. It was trained with the Neural Network toolbox of Matlab 2017a (MathWorks, Natick, MA, USA) using simulated mGRE signals, following the qBOLD model, and corresponding simulated QSM values. Random combinations of parameters, following Gaussian distributions around the expected values in gray matter and white matter, were used to simulate the signal6. Gaussian noise was added to the simulated signal for training with realistic SNR6. Before using the results of the ANN reconstruction to initialize the QN method, 3D Gaussian smoothing was performed with a standard deviation of 0.5 times the voxel diagonal, similar to the clustering method5.Results
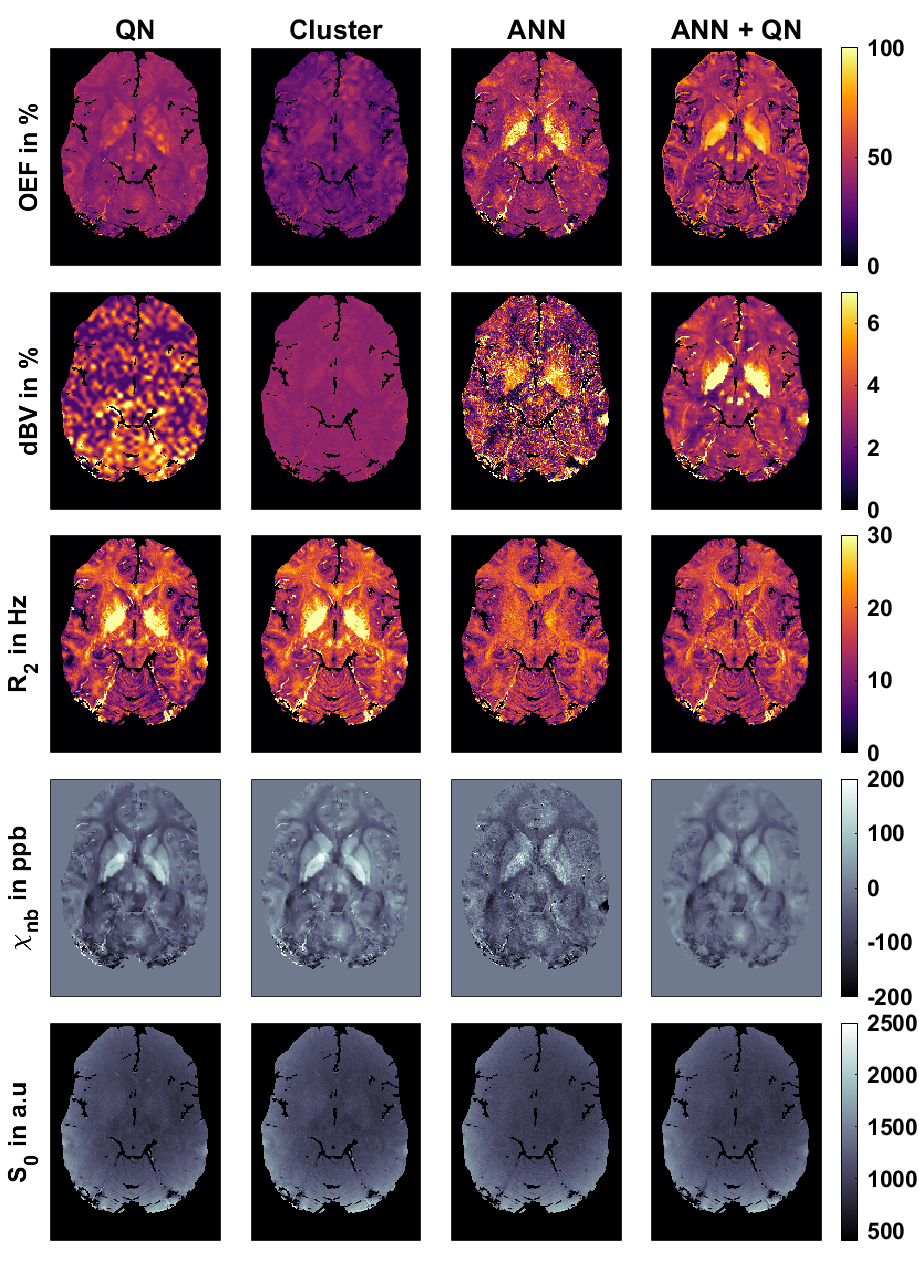
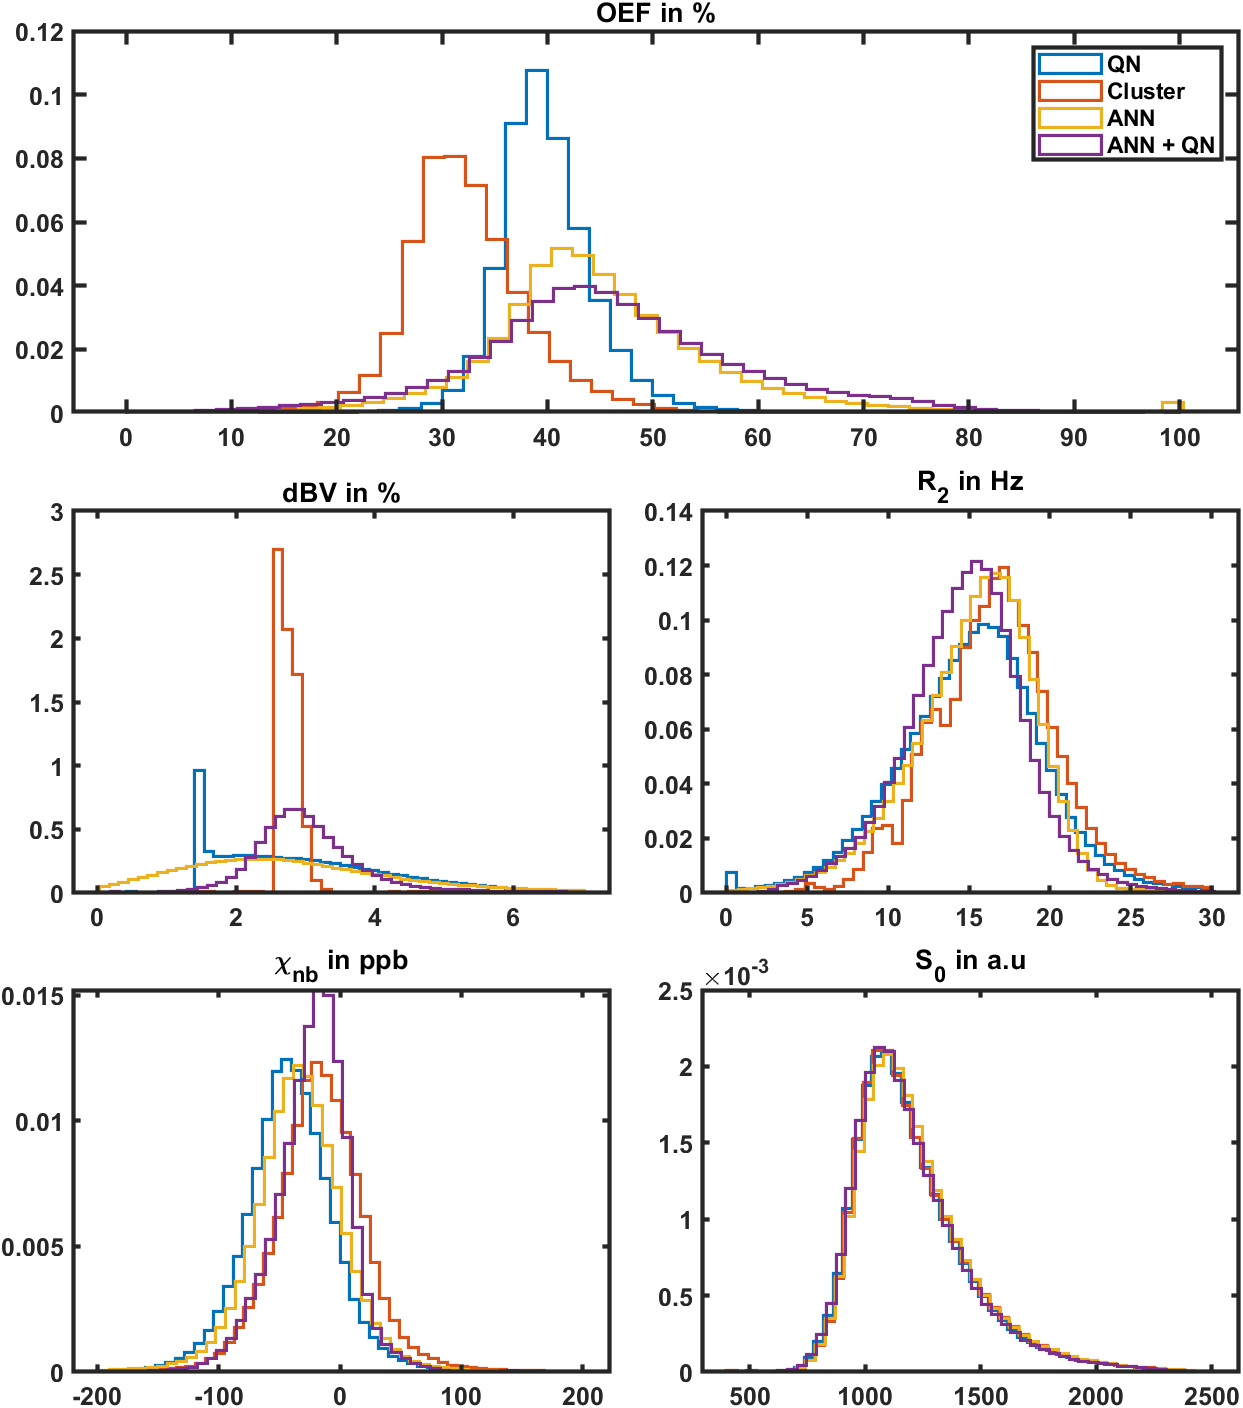
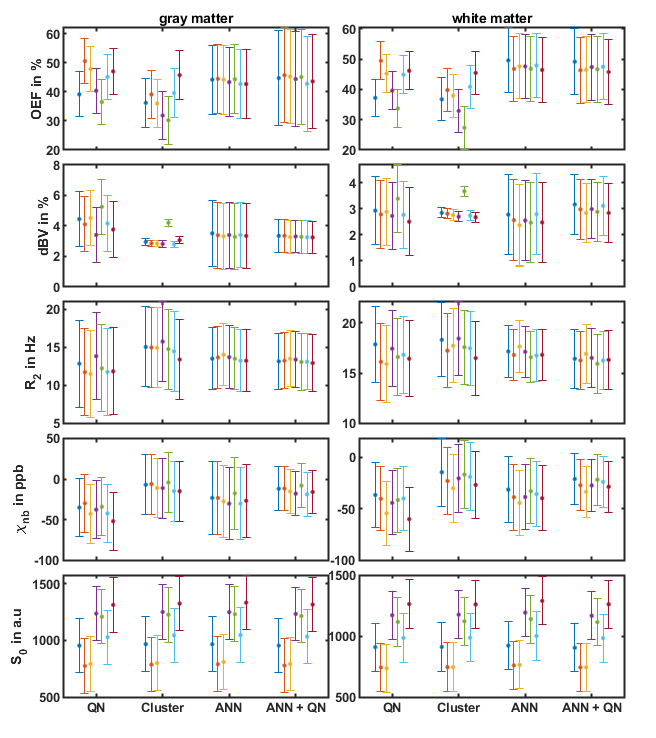
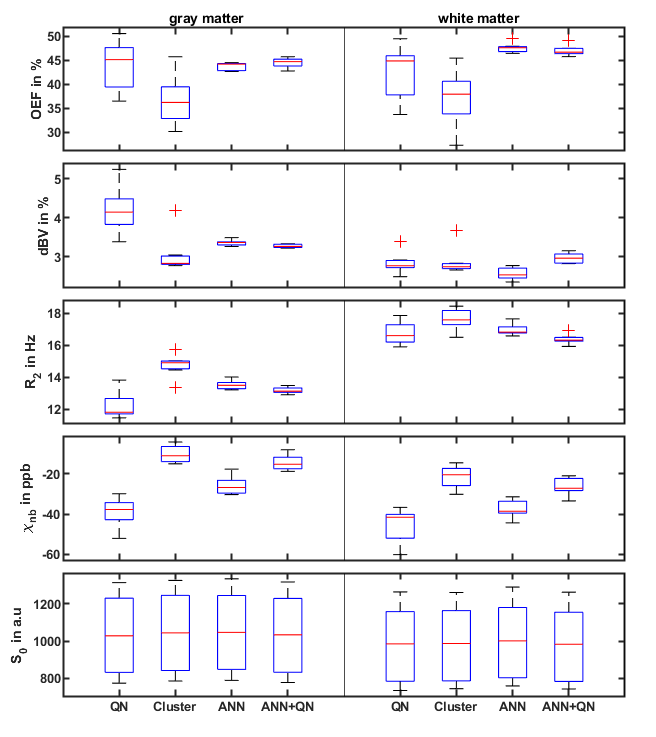
Figure 1 shows the reconstructed parameters in a representative slice for QN, Clustering, ANN, and ANN + QN. Figure 2 shows the parameter distributions for the same test subject with normalized histograms. The plot with error bars in figure 3 allows to compare the intrasubject standard deviation to the intersubject scattering of the mean values for each parameter, test subject and reconstruction method. And figure 4 is a boxplot that shows the median and scattering of the test subject means.QSM mapping and magnitude correction take the same time for all four methods, with approximately 5 minutes each. OEF reconstruction takes one second with only the ANN. Creating clusters and the clustered fit takes 5 to 10 minutes altogether. A voxel wise QN fit takes also 5 to 10 minutes, depending on the number of iterations until a minimum is found.
Discussion
The resulting images show varying degrees of contrast and noise depending on the method. OEF and dBV are strongly coupled and show large differences between methods. dBV for QN is nearly identical to the initial values determined with ASL. Clustering leads to much less variations, lower OEF and shows physiological structures in dBV. The ANN results look noisy. The additional fit in ANN+QN results in an image with much less noise.The biggest visible difference is in the globus pallidus and putamen. QN and Clustering have higher transverse relaxation rate R2 and non-blood susceptibility χnb there and the ANN methods higher OEF and dBV. This indicates that, the ANN methods reconstruct more of the iron in this area as deoxy haemoglobin while the other two methods attribute more of it to iron depositions. Some iron deposition is to be expected in the basal ganglia9, but which method is closer to the physiological values still needs to be investigated.
Clustering is still visible in the distributions of dBV and R2 even after the second, voxelwise fit. R2 is not one wide distribution but consist of multiple overlapping peaks. For this test subject dBV is only one slim peak. For two other test subjects, it is accompanied by a second much smaller peak near 4 percent dBV. Cluster and ANN + QN independently arrive at the same mean value for dBV for 6 out of 7 test subjects.
Conclusion
ANNs allow very fast initial reconstruction with low intersubject variability and an additional QN fit produces much less noisy results, than the ANN alone. It still needs to be investigated further, which reconstruction method is closer to the true values. But it is currently already under investigation, if any method can be used to discriminate different kinds of cancer.Acknowledgements
No acknowledgement found.References
1. Vaupel P, Mayer A. Hypoxia in cancer: significance and impact on clinical outcome. Cancer Metastasis Rev 2007;26(2):225-239.
2. Ibaraki M, Shimosegawa E, Miura S, Takahashi K, Ito H, Kanno I, Hatazawa J. PET measurements of CBF, OEF, and CMRO2 without arterial sampling in hyperacute ischemic stroke: method and error analysis. Ann Nucl Med 2004;18(1):35-44.
3. Hubertus, S, Thomas, S, Cho, J, Zhang, S, Wang, Y, Schad, LR. Comparison of gradient echo and gradient echo sampling of spin echo sequence for the quantification of the oxygen extraction fraction from a combined quantitative susceptibility mapping and quantitative BOLD (QSM+qBOLD) approach. Magn Reson Med 2019;82:1491-1503.
4. Cho, J, Ma, Y, Spincemaille, P, Pike, GB, Wang, Y. Cerebral oxygen extraction fraction: Comparison of dual‐gas challenge calibrated BOLD with CBF and challenge‐free gradient echo QSM+qBOLD. Magn Reson Med. 2020; 85: 953– 961.
5. Cho, J, Zhang, S, Kee, Y, et al. Cluster analysis of time evolution (CAT) for quantitative susceptibility mapping (QSM) and quantitative blood oxygen level‐dependent magnitude (qBOLD)‐based oxygen extraction fraction (OEF) and cerebral metabolic rate of oxygen (CMRO2) mapping. Magn Reson Med. 2020; 83: 844– 857.
6. Hubertus, S, Thomas, S, Cho, J, Zhang, S, Wang, Y, Schad, LR. Using an artificial neural network for fast mapping of the oxygen extraction fraction with combined QSM and quantitative BOLD. Magn Reson Med. 2019; 82: 2199– 2211.
7. Liu Z, Spincemaille P, Yao Y, Zhang Y, Wang Y. MEDI+0: Morphology enabled dipole inversion with automatic uniform cerebrospinal fluid zero reference for quantitative susceptibility mapping. Magn Reson Med. 2018 May;79(5):2795-2803.
8. Hernando D, Vigen KK, Shimakawa A, Reeder SB. R*(2) mapping in the presence of macroscopic B₀ field variations. Magn Reson Med. 2012;68(3):830-840.
9. Aquino D, Bizzi A, Grisoli M, Garavaglia B, Bruzzone MG, Nardocci N, Savoiardo M, Chiapparini L, Age-related Iron Deposition in the Basal Ganglia: Quantitative Analysis in Healthy Subjects, Radiology 2009 252:1, 165-172
Figures