2166
Deep unrolled network with optimal sampling pattern to accelerate multi-echo GRE acquisition for quantitative susceptibility mapping
Jinwei Zhang1, Hang Zhang1, Pascal Spincemaille2, Mert Sabuncu3, Thanh Nguyen2, Ilhami Kovanlikaya2, and Yi Wang2
1Cornell University, New York, NY, United States, 2Weill Cornell Medical College, New York, NY, United States, 3Cornell University, Ithaca, NY, United States
1Cornell University, New York, NY, United States, 2Weill Cornell Medical College, New York, NY, United States, 3Cornell University, Ithaca, NY, United States
Synopsis
To accelerate the acquisition time of quantitative susceptibility mapping (QSM) using a 3D multi-echo gradient echo (mGRE) sequence, an unrolled multi-channel deep ADMM reconstruction network with a LOUPE-ST based 2D variable density sampling pattern optimization module is trained to optimize both the k-space under-sampling pattern and the reconstruction. Prospectively under-sampled k-space data are acquired using a modified mGRE sequence and reconstructed by the trained unrolled network. Prospective study shows the learned sampling pattern achieves better image quality in QSM compared to a manually designed pattern.
Introduction
Quantitative susceptibility mapping (QSM) (1) is an image contrast that quantifies the tissue magnetic susceptibility with specific biomarkers such as iron, calcium, and gadolinium. 3D Multi-echo gradient echo (mGRE) sequence is used to acquire the multi-echo signals which measure the phase evolution of each voxel due to the tissue-induced field inhomogeneity. However, the relative long TR required to adequately map all susceptibility contrast in the brain leads to the long scan time, even with parallel imaging acceleration. Here, we propose to accelerate QSM acquisition by 1) using a deep unrolled Alternating Direction Method of Multipliers (ADMM) reconstruction network for the under-sampled k-space reconstruction and 2) learning the optimal 2D variable density sampling pattern using Learning-based Optimization of the Under-sampling Pattern with Straight-through estimator (LOUPE-ST) (2,3). Prospective under-sampling and reconstruction experiments demonstrate that the multi-echo images reconstructed by the trained unrolled network generate better QSM using the learned optimal sampling pattern than a manually designed pattern.Data acquisition and preprocessing
For network training and validation, fully sampled k-space data of multi-echo images were acquired in 4 subjects using a 3D mGRE sequence with 10 echoes on a 3T GE scanner and a 32-channel head coil. For network testing, under-sampled k-space data with 13% and 23% under-sampling along two phase encoding directions were prospectively acquired in 3 subjects different from training using both learned and manually designed sampling patterns. Imaging parameters were: $$$256\times206\times80$$$ matrix size, $$$1\times1\times2 mm^3$$$ resolution, 10 echoes with $$$1.972 ms$$$ first TE and $$$3.384 ms$$$ echo spacing. 32-coil k-space data of each echo were compressed into 8 virtual coils using coil compression (4). Coil sensitivity maps of the first echo were calculated with ESPIRiT (5) using a centric $$$24\times24\times24 $$$ auto-calibration region and were used for the remaining echoes. From the fully sampled data, coil combined multi-echo images were obtained to provide the ground truth labels for both network training and validation. The central 200 slices with 10 echoes of each fully sampled subject were extracted for the training (600 slices) and validation (200 slices) datasets. Under-sampled kspace data of the remaining 3 subjects were used for testing.Network architecture
The reconstruction network is extended from plug-and-play ADMM (6). For a multi-echo image $$$x$$$ to be reconstructed from the under-sampled multi-echo multi-coil k-space data $$$b$$$, the reconstruction network uses a 5-layer convolutional neural network (CNN) $$$D$$$ as the denoiser to regularize $$$x$$$. The update strategy for the $$$k$$$th iteration is shown in Fig. 1a, where $$$u^{k+1}$$$ is the dual variable, $$$v^{k+1}$$$ is the auxiliary variable and $$$\rho$$$ is the penalty parameter. The proposed unrolled ADMM reconstruction network replicates the above update rule 10 times, where both $$$\rho$$$ and weights in $$$D$$$ are learnable during training.The sampling pattern optimization network shown in Fig. 1b is from the recently proposed LOUPE-ST (3) , which extends LOUPE (2) by adding a straight through estimator in the sampling pattern generation layer to improve gradient back-propagation.
Experimental details
Two under-sampling ratios, 13% and 23%, were used in the experiment. Both the under-sampling network and the unrolled reconstruction network were trained simultaneously from scratch by minimizing $$$L_1$$$ loss: $$\Sigma_{k=1}^{K} \| x_j^{(k)} - t_j\|_1$$ where subscript $$$j$$$ denotes the $$$j$$$th data in the training dataset, $$$t_j$$$ denotes the ground truth label and $$$x_j^{(k)}$$$ denotes the $$$k$$$th intermediate reconstruction (Figure 1a). After convergence, a specific binary mask was generated from the learned probabilistic under-sampling mask and this fixed binary mask was used to further train the reconstruction network alone. We implemented in PyTorch with Python version 3.7.3 using the Adam optimizer (7), batch size $$$1$$$, number of epochs $$$100$$$ and initial learning rate $$$1\times10^{-3}$$$. After training, the prospectively under-sampled k-space data acquired using the learned and manually designed sampling patterns with 13% and 23% ratios were fed into the reconstruction network for inference. QSMs were generated from the reconstructed multi-echo images through nonlinear field estimation, graph cut based phase unwrapping, projection onto the dipole field (PDF) for the background field removal and morphology-enabled dipole inversion (MEDI) (1,8,9). MEDIs from all the reconstructed multi-echo images were compared.Results
The learned optimal sampling patterns with 13% and 23% sampling ratios are shown in Fig. 2. The central $$$24\times24$$$ kspace regions are fully sampled for auto-calibrated coil sensitivity maps estimation. Manually designed patterns are generated from a multi-level sampling scheme based on two tunable parameters (10). Compared to the manually designed ones, the optimal patterns sample more peripheral kspace regions.QSMs from different prospectively under-sampled kspace data are shown in Fig. 3, 4 and 5. Fully sampled QSM is used as the reference. With 23% under-sampling ratio, QSM sampled by the optimal pattern captures more details in the image such as veins (red arrow) compared to the manual pattern. With 13% under-sampling ratio, both QSMs by the optimal and manual patterns lose some detailed structures (red arrow).
Conclusion
In this work, we propose to utilize an unrolled ADMM network to reconstruct the under-sampled multi-echo kspace data for QSM and LOUPE-ST to learn the optimal sampling pattern with 13% and 23% ratios. The learned 23% optimal sampling pattern shows better image quality on QSM than the manually designed one. 13% under-sampling ratio is too aggressive to contain enough information for QSM.Acknowledgements
This research was supported in part by National Institute of Health (R01NS090464, R01NS095562, R01NS105144, R01DK116126, R01CA181566, S10OD021782, 1R21AG050122, R01LM012719 and R01AG053949), National Science Foundation (1748377 and 1707312) and National Multiple Sclerosis Society (RR-1602-07671).References
- Wang Y, Liu T. Quantitative susceptibility mapping (QSM): decoding MRI data for a tissue magnetic biomarker. Magnetic resonance in medicine 2015;73(1):82-101.2.
- Bahadir CD, Wang AQ, Dalca AV, Sabuncu MR. Deep-learning-based optimization of the under-sampling pattern in MRI. IEEE Transactions on Computational Imaging 2020;6:1139-1152.3.
- Zhang J, Zhang H, Wang A, Zhang Q, Sabuncu M, Spincemaille P, Nguyen TD, Wang Y. Extending LOUPE for K-space Under-sampling Pattern Optimization in Multi-coil MRI. 2020. Springer. p 91-101.4.
- Zhang T, Pauly JM, Vasanawala SS, Lustig M. Coil compression for accelerated imaging with Cartesian sampling. Magnetic resonance in medicine 2013;69(2):571-582.5.
- Uecker M, Lai P, Murphy MJ, Virtue P, Elad M, Pauly JM, Vasanawala SS, Lustig M. ESPIRiT—an eigenvalue approach to autocalibrating parallel MRI: where SENSE meets GRAPPA. Magnetic resonance in medicine 2014;71(3):990-1001.6.
- Chan SH, Wang X, Elgendy OA. Plug-and-play ADMM for image restoration: Fixed-point convergence and applications. IEEE Transactions on Computational Imaging 2016;3(1):84-98.7.
- Kingma DP, Ba J. Adam: A method for stochastic optimization. arXiv preprint arXiv:14126980 2014.8.
- Liu J, Liu T, de Rochefort L, Ledoux J, Khalidov I, Chen W, Tsiouris AJ, Wisnieff C, Spincemaille P, Prince MR. Morphology enabled dipole inversion for quantitative susceptibility mapping using structural consistency between the magnitude image and the susceptibility map. Neuroimage 2012;59(3):2560-2568.9.
- Liu T, Wisnieff C, Lou M, Chen W, Spincemaille P, Wang Y. Nonlinear formulation of the magnetic field to source relationship for robust quantitative susceptibility mapping. Magnetic resonance in medicine 2013;69(2):467-476.10.
- Roman B, Hansen A, Adcock B. On asymptotic structure in compressed sensing. arXiv preprint arXiv:14064178 2014.
Figures
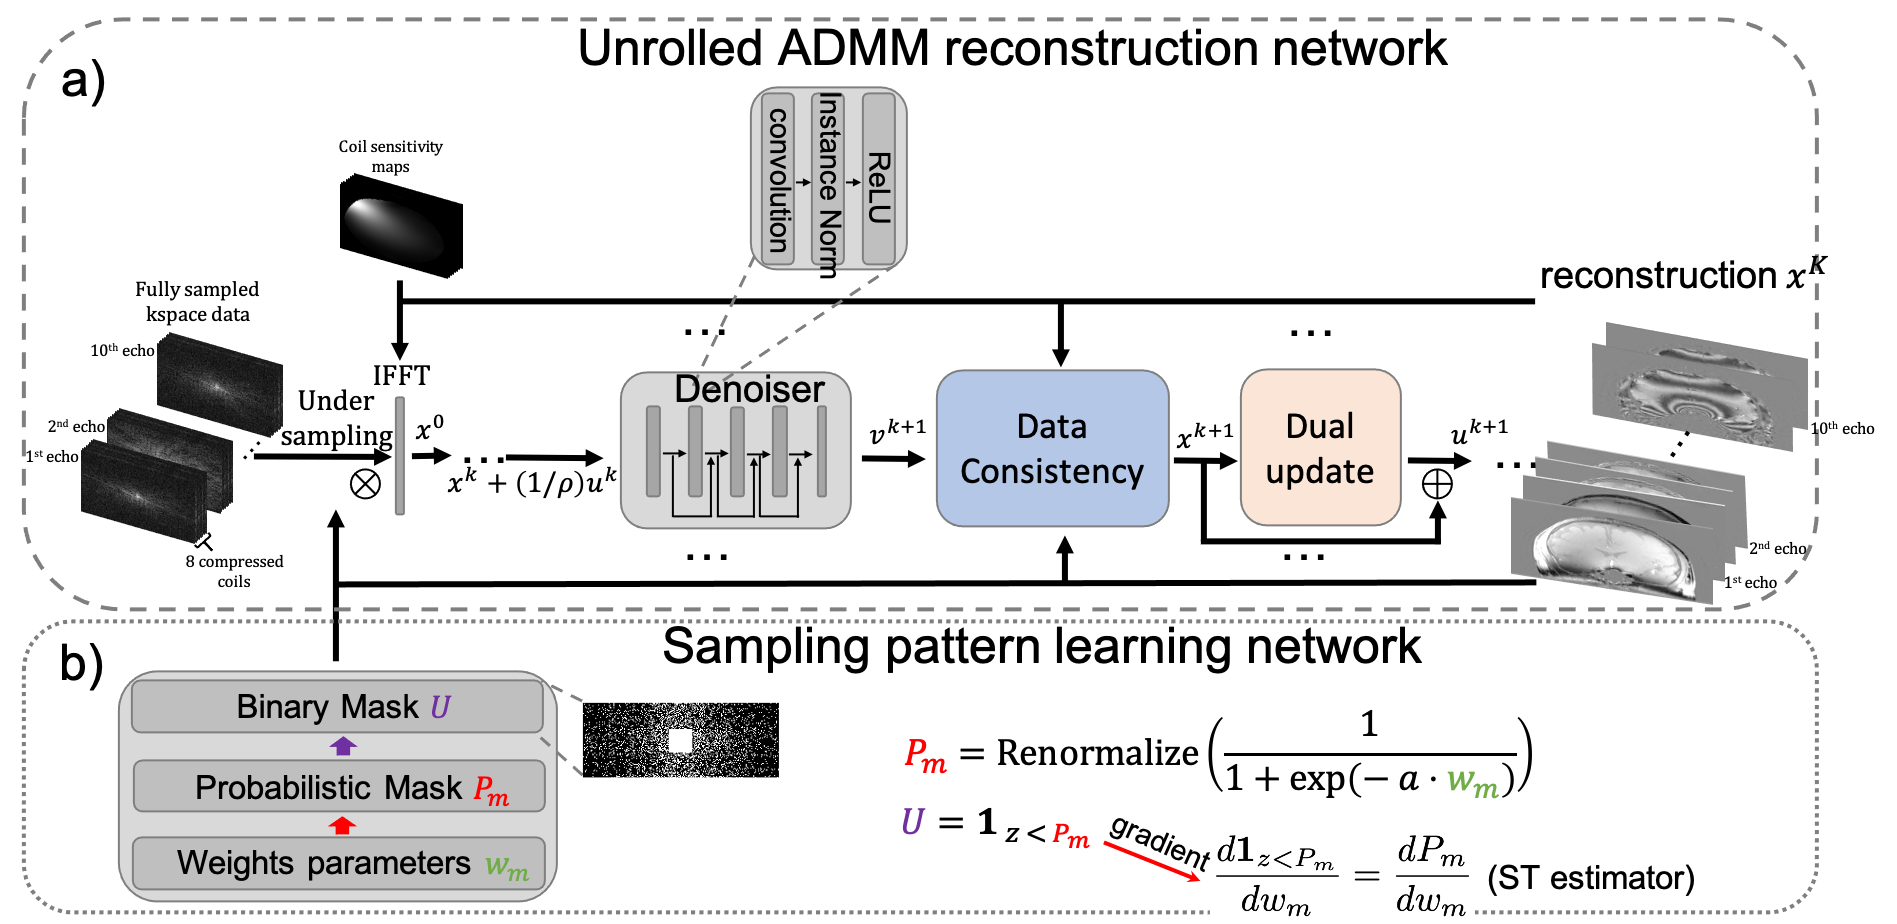
Figure 1. Proposed network architecture. Unrolled ADMM network (a) reconstructed multi-echo images from the under-sampled multi-coil multi-echo kspace data. Sampling pattern learning network (b) optimized the kspace undersampling pattern with a straight-through estimator to improve back-propagation.
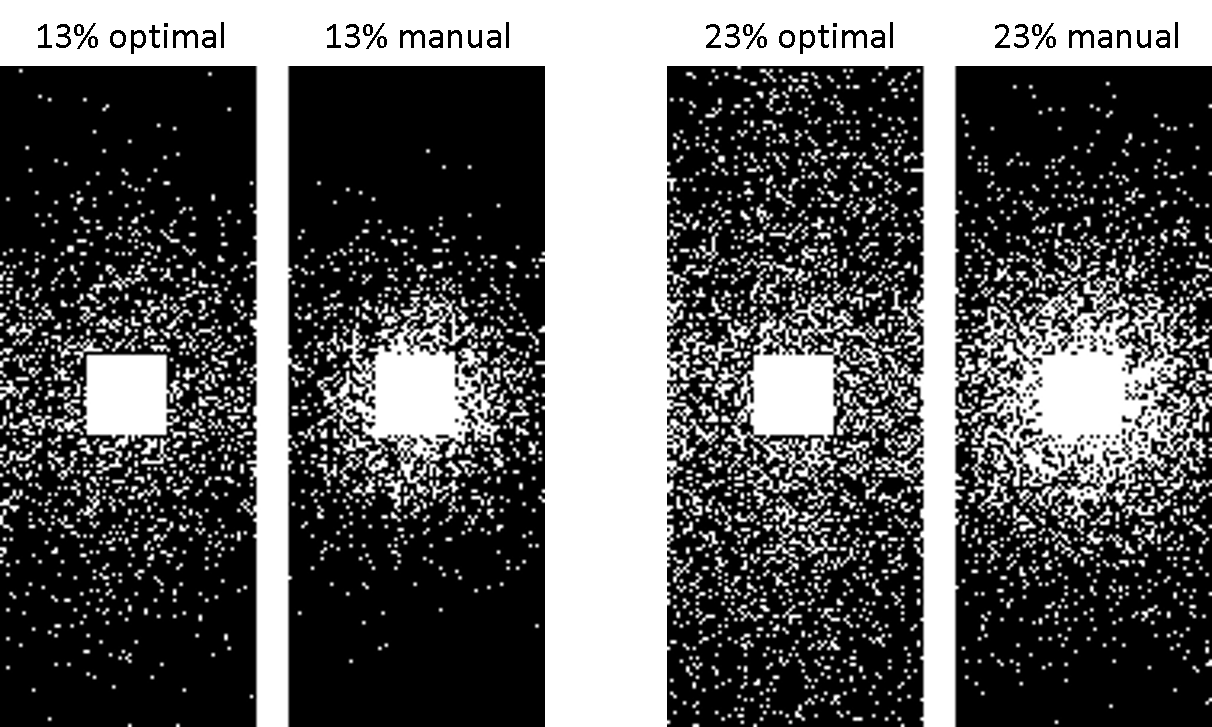
Figure 2. Optimal and manually designed sampling patterns with 13% and 23% ratios. Compared to the manually designed ones, the optimal patterns sample more peripheral kspace regions.
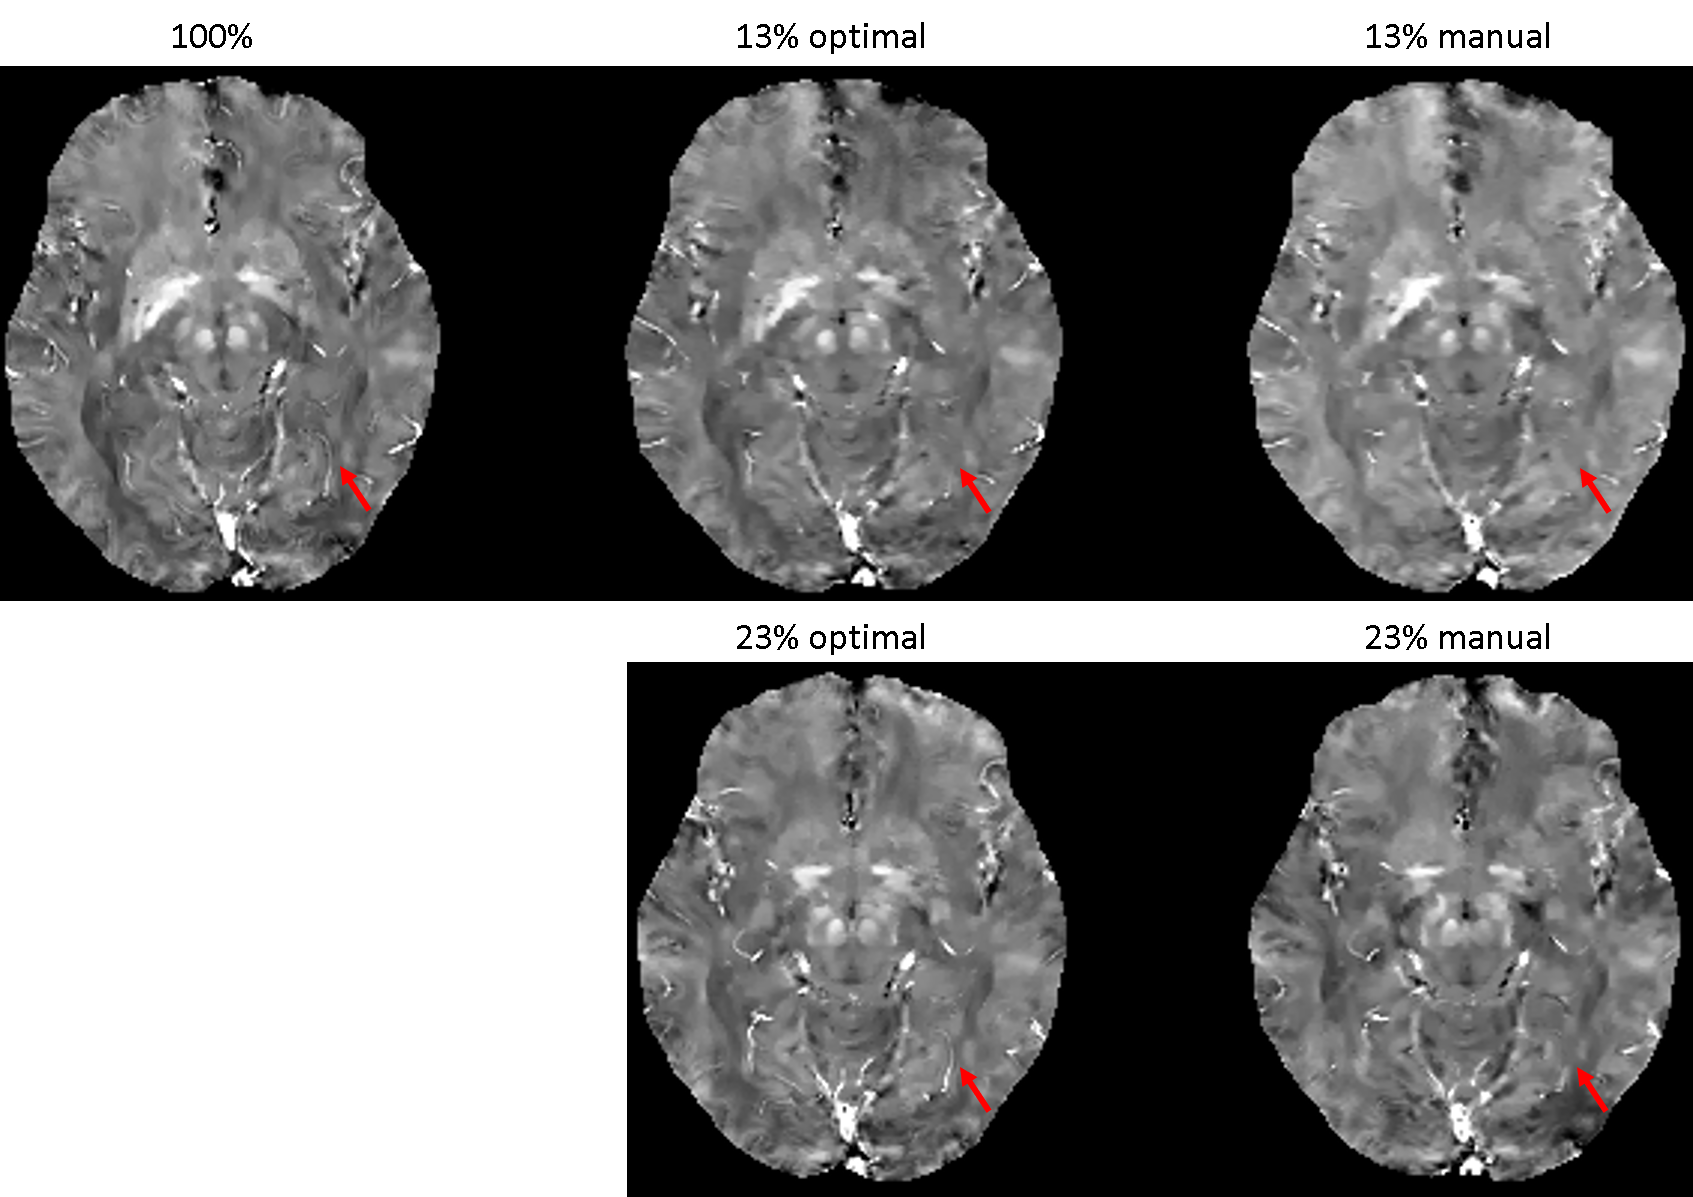
Figure 3. QSMs of optimal and manually designed sampling patterns with 13% and 23% sampling ratios, with fully sampled (100%) QSM as the reference. QSM sampled by the optimal pattern captures more details in the image such as veins (red arrow) compared to the manual pattern. With 13% under-sampling ratio, both QSMs by the optimal and manual patterns lose some detailed structures (red arrow).
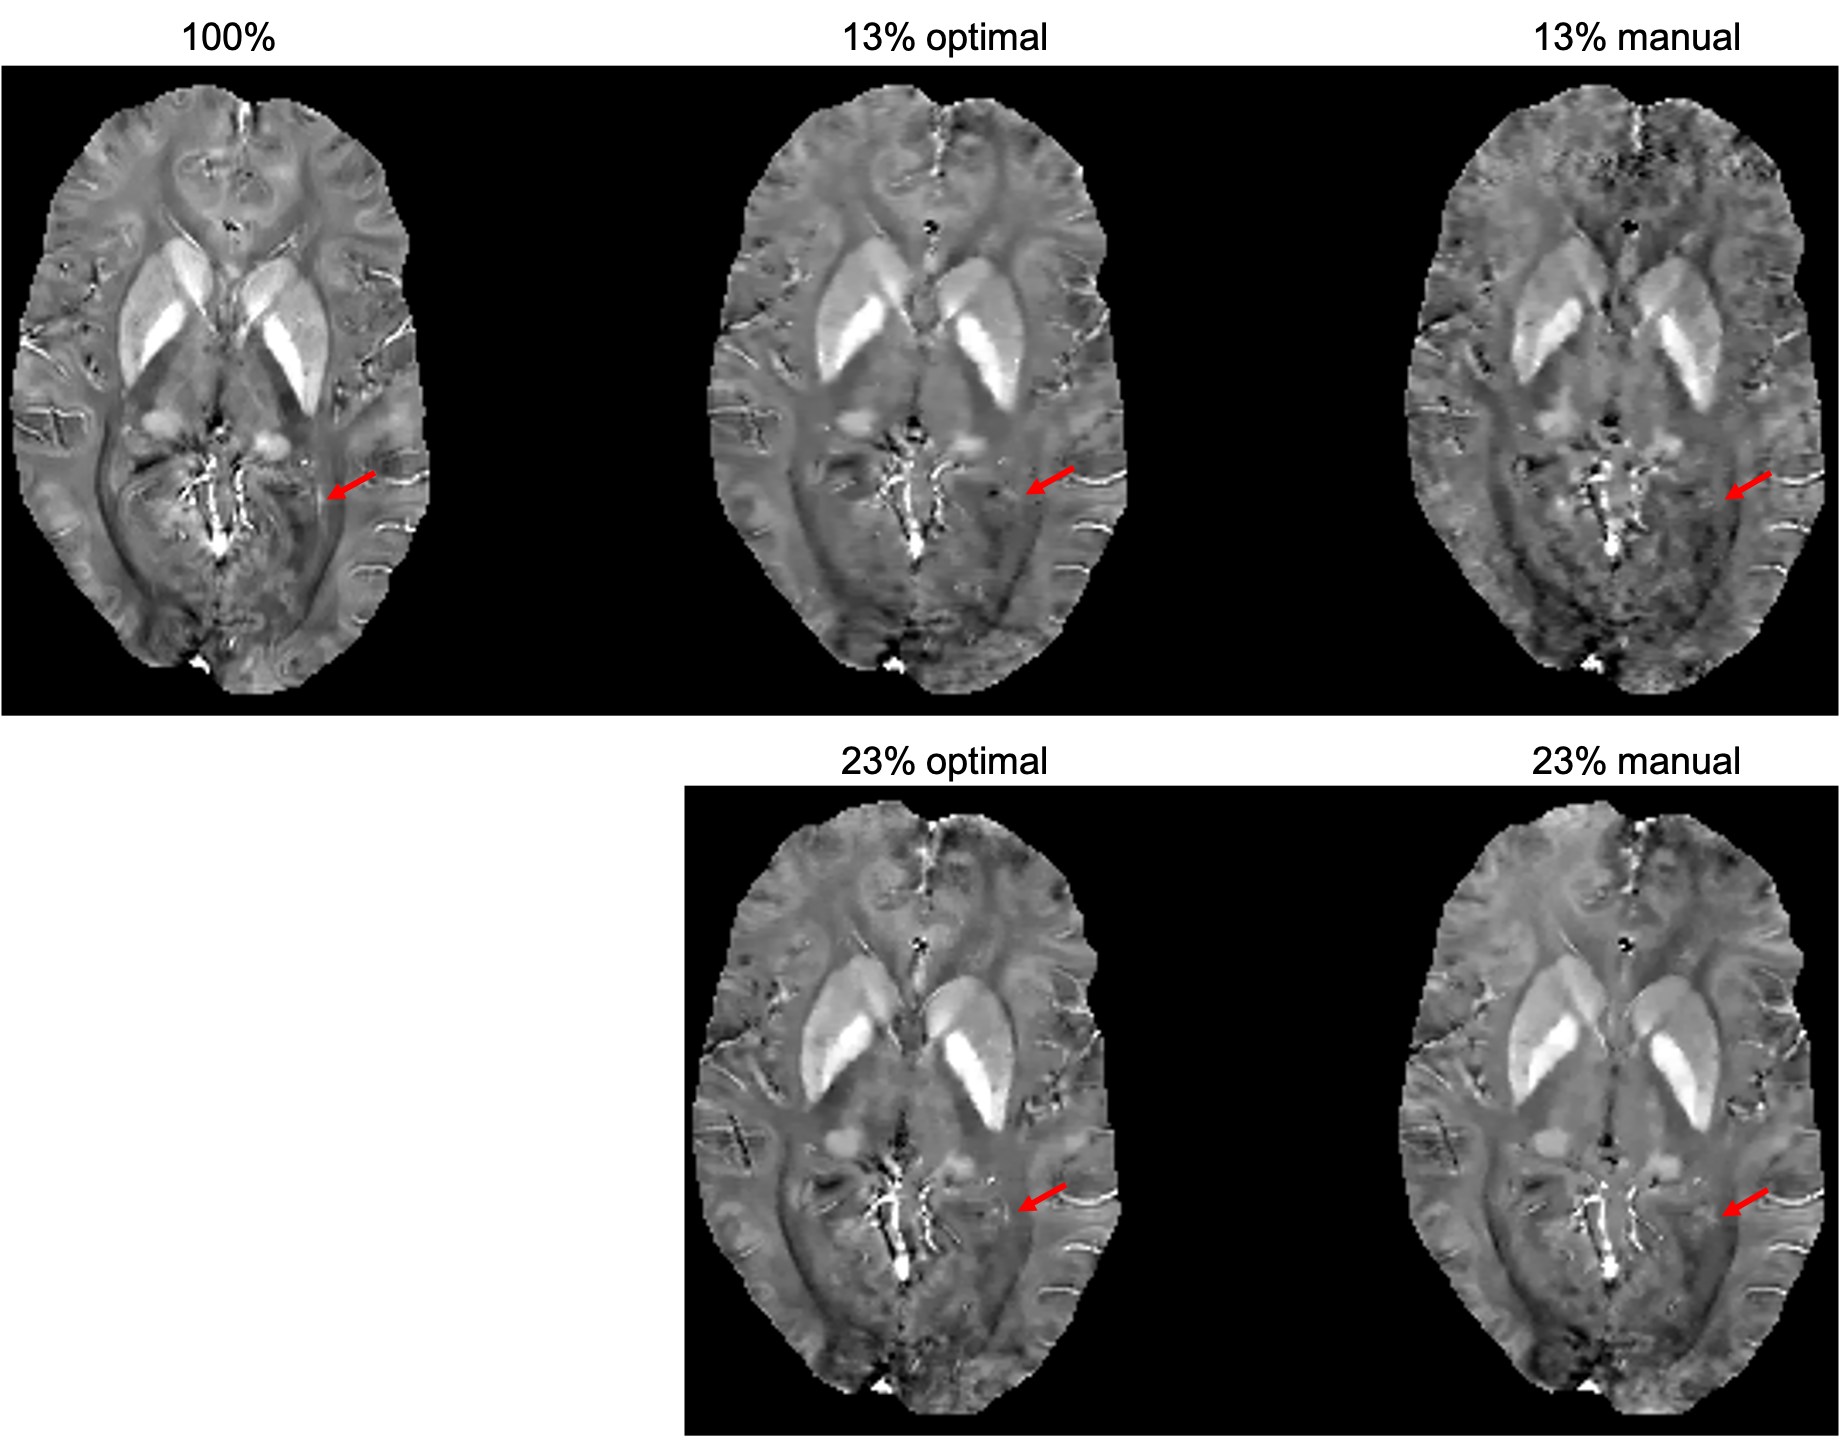
Figure 4. QSMs of optimal and manually designed sampling patterns with 13% and 23% sampling ratios, with fully sampled (100%) QSM as the reference. QSM sampled by the optimal pattern captures more details in the image such as veins (red arrow) compared to the manual pattern. With 13% under-sampling ratio, both QSMs by the optimal and manual patterns lose some detailed structures (red arrow).
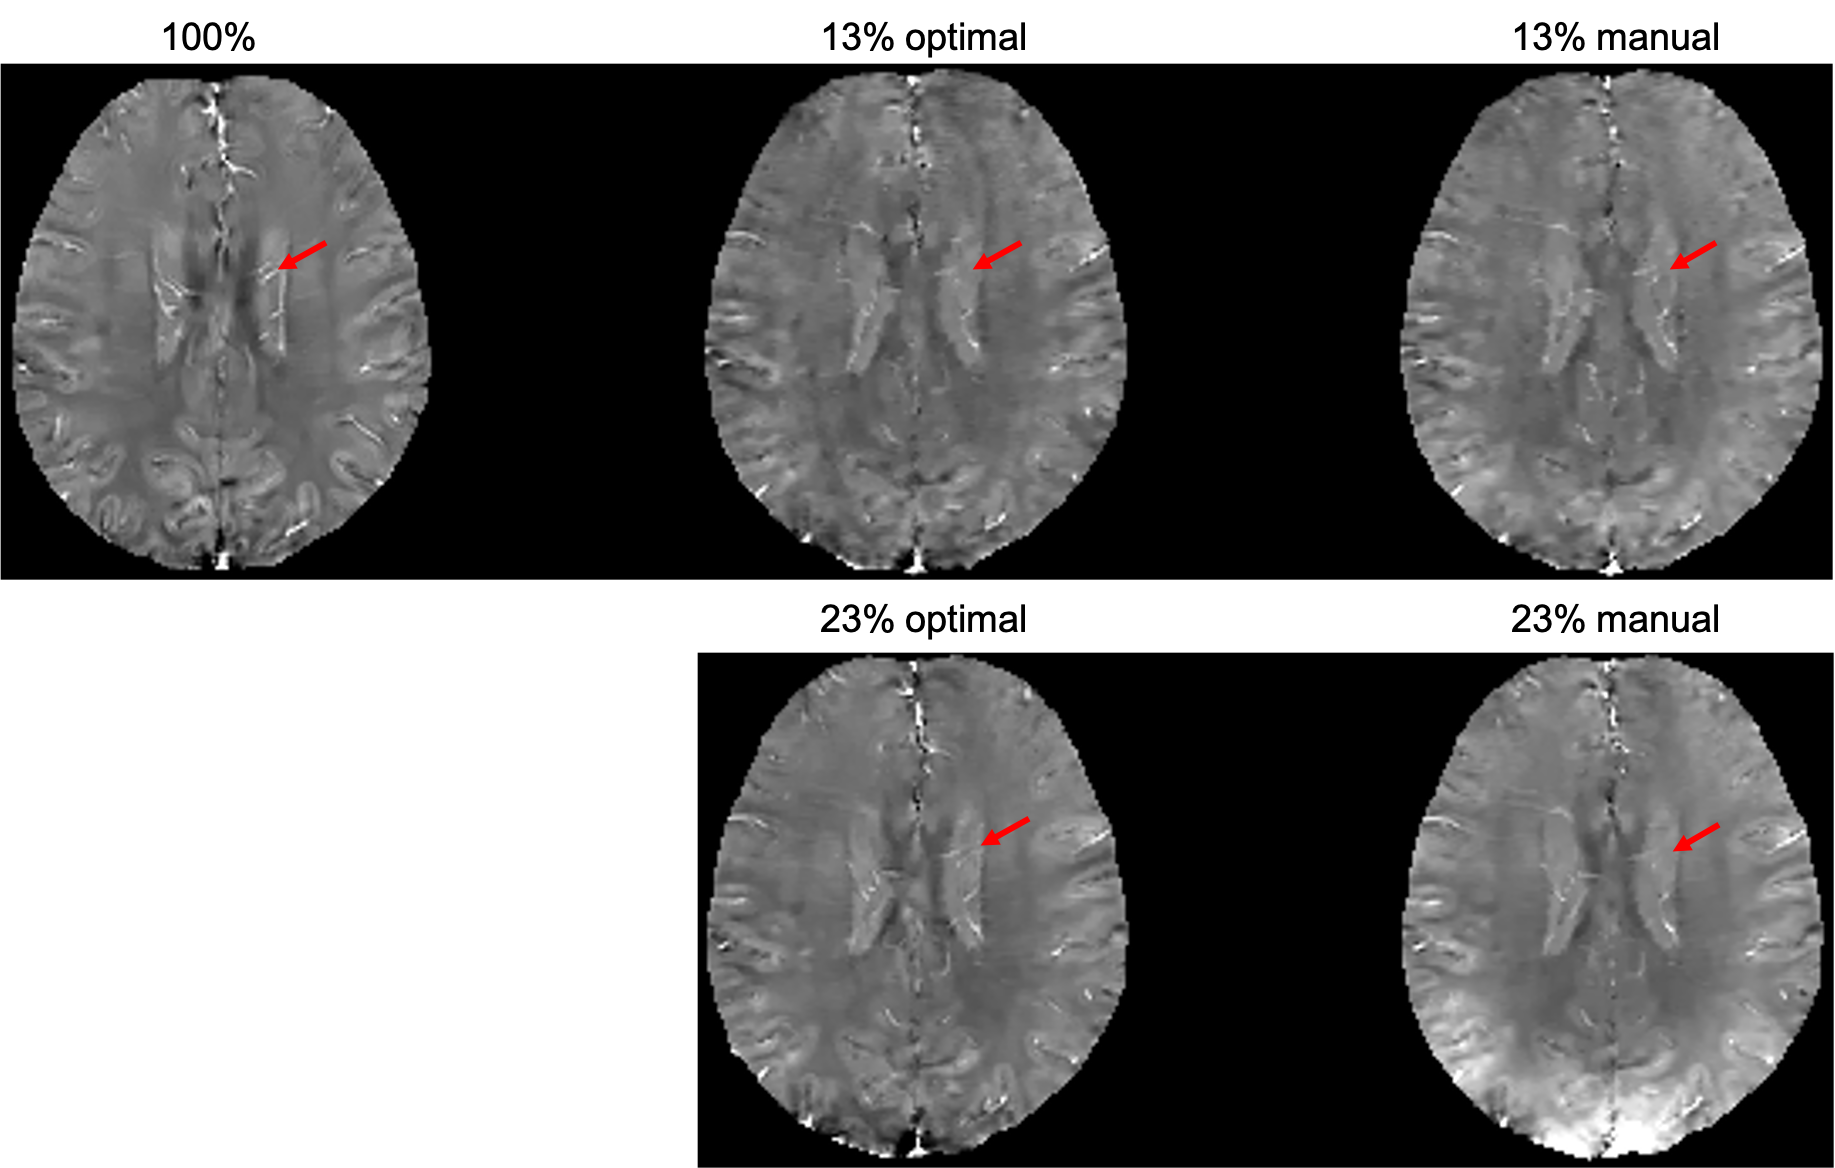
Figure 5. QSMs of optimal and manually designed sampling patterns with 13% and 23% sampling ratios, with fully sampled (100%) QSM as the reference. QSM sampled by the optimal pattern captures more details in the image such as veins (red arrow) compared to the manual pattern. With 13% under-sampling ratio, both QSMs by the optimal and manual patterns lose some detailed structures (red arrow).