2165
Synthesizing large scale datasets for training deep neural networks in quantitative mapping of myelin water fraction1Boston Children's Hospital, Boston, MA, United States, 2Harvard Medical School, Boston, MA, United States
Synopsis
Deep learning methods have the potential to improve quantitative MRI methods. However, performance of deep learning methods is highly sensitive to the amount of available training data. In this work, we propose generating a substantial amount of 3D synthetic data, and demonstrate its application to myelin water fraction mapping. A parameter sampling model is designed within a naturally occurring range of multi-component T2 distributions to generate a large set of varying synthetic signals. This model is combined with a spatially varying sampling model that generates a multitude of spatial deformations and signal perturbations.
Introduction
Multi-component T2 relaxometry is a promising tool in quantitative assessment of neurological disorders1. CPMG sequences that are typically used for T2 mapping require extensive scan time, which limits their wide spread application and consequently limits the availability of datasets that capture the natural range of variation in parameters. Performance of deep learning methods is highly sensitive to the amount of available training data. Conventional approaches to tackling data scarcity use spatial augmentations or adversarially trained latent probability distribution models, which may not capture a broad range of possible image variations when only a small initial dataset is available.We present a novel approach for tackling data scarcity that captures a large variation in quantitative parameters by generating substantial quantities of 3D synthetic data, and demonstrate its application to myelin water fraction (MWF) mapping. A parameter sampling model is designed within a naturally occurring range of multi-component T2 distributions. It is then combined with a spatially varying sampling model that generates a multitude of spatial deformations and signal perturbations.
Methods
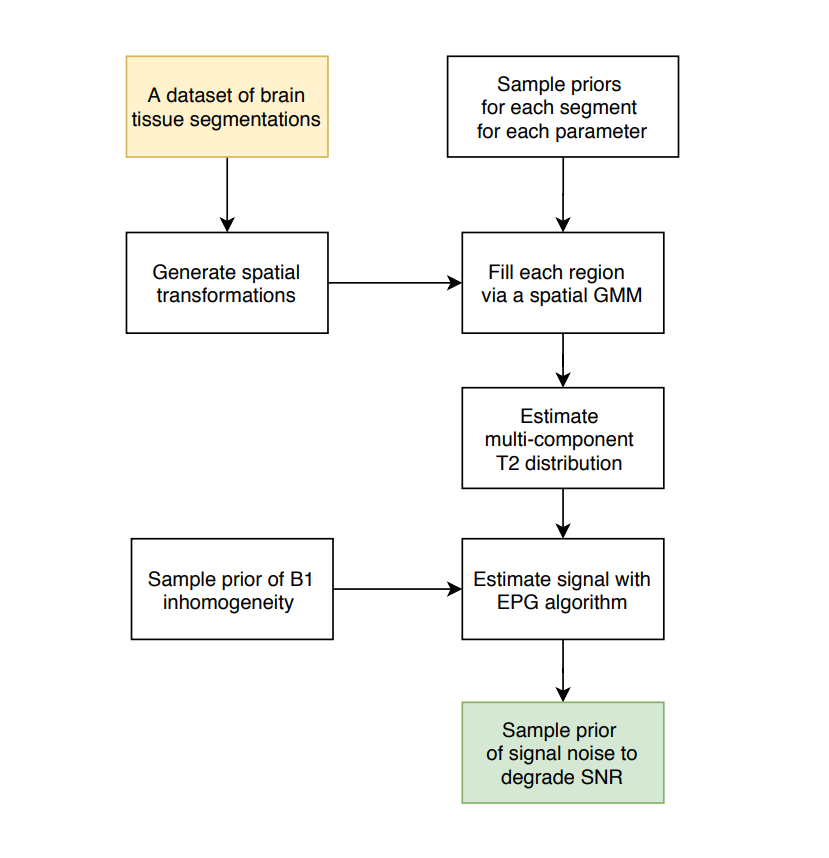
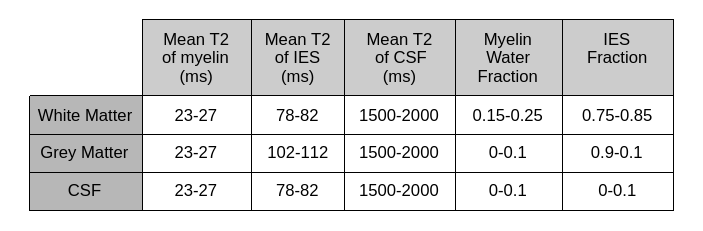
Synthetic data generation is initiated from a dataset of generic tissue segmentations of the adult brain. Each step in the pipeline uses a sampling strategy to capture the naturally occurring set of priors for a given parameter. The variations in parameters are combined together to form a multi-component T2 distribution for each voxel. A forward model that estimates the MR signal from the T2 distribution with the Extended Phase Graph algorithm is used to generate signal decay curves2. The full proposed framework is shown in Figure 1.Table 1 specifies the range of tissue specific multi-component T2 priors used in the sampling process. While the volume fraction and the mean of each of the three T2 components are varied, their relative standard deviations are fixed to 5ms for myelin, intra-/extra-axonal water and CSF. The 9 parameters of the three component gaussian mixture model (GMM) form the T2 distribution for each voxel. Similarly, a B1 transmit inhomogeneity is modelled by sampling from a smooth spatially varying GMM in 3 dimensions centered at the middle of the brain3. The B1 is modelled to converge between the angles of 120 to 240 degrees, with the larger values centered around the middle of the brain. The final step samples complex random gaussian noise to obtain a measure of varying SNR levels over each generated example, from 40 to 1004. The entire cycle is repeated, thereby leading to a large supply of 3D synthetic data points that captures large range of spatial and signal variation within the naturally occurring bounds.
Results
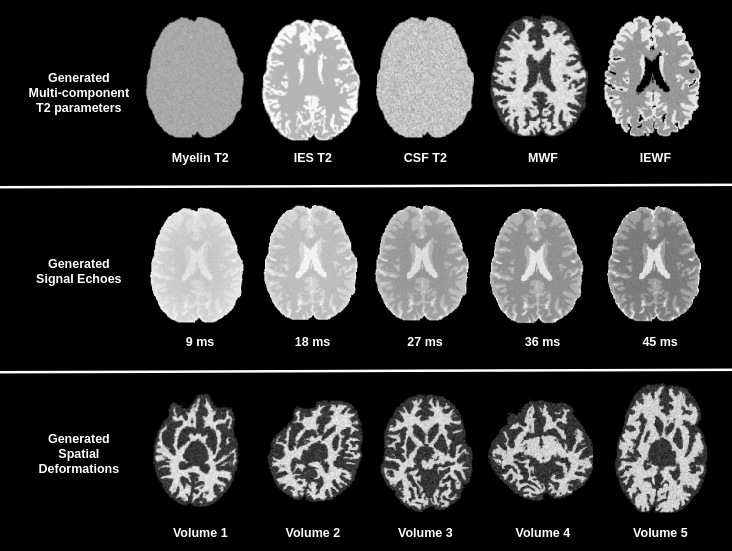
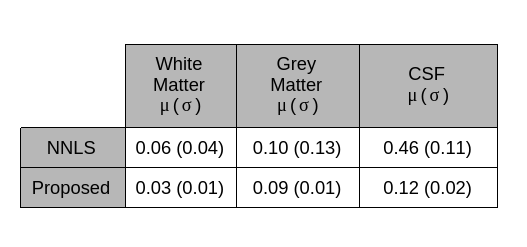
An example of generated synthetic data is shown in Figure 2. To evaluate the proposed framework we trained a U-net style architecture, motivated by its excellent performance and widespread use. The network is trained by feeding 2D images with 32 echoes in the channel dimension as input and is supervised by the corresponding myelin water fraction that was obtained in the simulations as the label. The training dataset of synthetic data consisted of 100 volumes with 192x160x64 dimensions. Spatially varying sampling model was implemented in Keras with a Tensorflow backbone5 and ran on NVIDIA Titan XP GPU. The EPG algorithm was implemented in python and took ~6hours of runtime executed in parallel across a cluster of 32 individual machines. Network training parameters were: 60 epochs, 0.01 dropout, 0.0008 learning rate, 3x3 kernel, 4 downsample/upsample blocks, 3 convolutions per block and a batch of 2.Synthetically trained U-net architecture was evaluated against the conventional non-linear least squares algorithm for multi-component T2 fitting2. The algorithms were quantitatively evaluated on a holdout test set of 10 generated volumes. The neural network achieved a substantial accuracy over the NLLS method in terms of RMSE, as shown in Table 2.
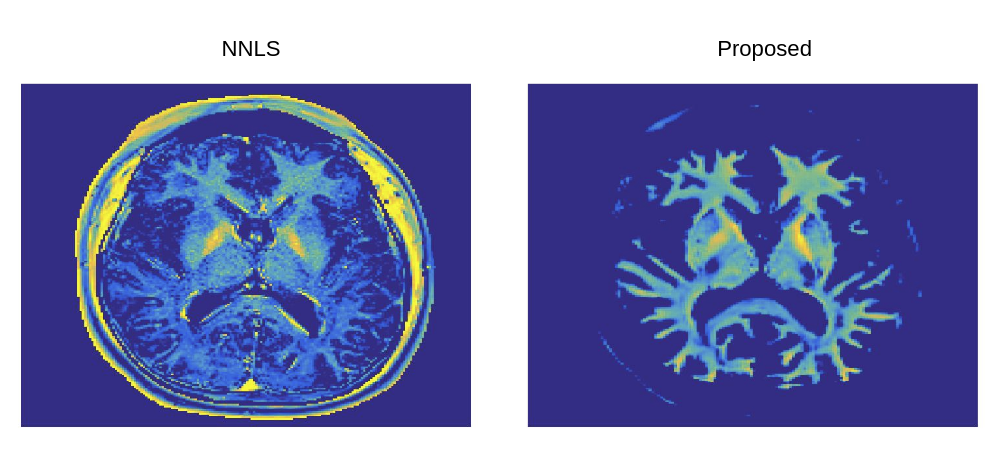
Finally, synthetically trained network was evaluated on a 2D CPMG dataset acquired on a volunteer. Figure 3 shows sample MWF maps generated by the network in comparison with the NNLS algorithm. The MWF maps generated by the network resulted in similar myelination patterns as the NNLS algorithm.
Discussion
The proposed method showed an excellent accuracy in the synthetic test dataset, and generated similar myelin water fraction maps as the NNLS algorithm. A more thorough analysis on real data is needed to evaluate the efficacy of method. A more realistic synthetic data can be generated by using a more complex parcellation to better characterize the T2 distribution variation between different regions in the brain.Acknowledgements
This work was supported partially by the grant No 2019056 from the United States-Israel Binational Science Foundation (BSF), a pilot grant from National Multiple Sclerosis Society under Award Number PP-1905-34002, the Boston Children's Hospital Translational Research Program Pilot Grant 2018, Society of Pediatric Radiology Multi-center Research Grant 2019, Crohn’s and Colitis Foundation of America’s (CCFA) Career Development Award and by the National Institutes of Health under award numbers R01EB019483, R21DK123569, R21EB029627.
References
1. Mackay A, Whittall K, Adler J, Li D, Paty D, Graeb D. In vivo visualization of myelin water in brain by magnetic resonance. Magn Reson Med. Published online 1994. doi:10.1002/mrm.1910310614
2. Prasloski, T., Mädler, B., Xiang, Q.S., MacKay, A. and Jones, C., 2012. Applications of stimulated echo correction to multicomponent T2 analysis. Magnetic resonance in medicine, 67(6), pp.1803-1814
3. Chatterjee, S., Commowick, O., Afacan, O., Warfield, S.K. and Barillot, C., 2018, April. Multi-compartment model of brain tissues from T2 relaxometry MRI using gamma distribution. In 2018 IEEE 15th International Symposium on Biomedical Imaging (ISBI 2018) (pp. 141-144). IEEE
4. Yu, T., Rodriguez, E.J.C., Pizzolato, M., Piredda, G.F., Hilbert, T., Fischi-Gomez, E., Weigel, M., Barakovic, M., Bach-Cuadra, M., Granziera, C. and Kober, T., 2020. Model-Informed Machine Learning for Multi-component T2 Relaxometry. arXiv preprint arXiv:2007.10225
5. Billot, B., Greve, D., Van Leemput, K., Fischl, B., Iglesias, J.E. and Dalca, A.V., 2020. A Learning Strategy for Contrast-agnostic MRI Segmentation. arXiv preprint arXiv:2003.01995
Figures