2162
qMTNet+: artificial neural network with residual connection for accelerated quantitative magnetization transfer imaging1Magnetic Resonance Imaging Laboratory, Department of Bio and Brain Engineering, Korea Advanced Institute of Science and Technology, Daejeon, Korea, Republic of, 2Department of Radiology, Seoul National University Hospital, Seoul, Korea, Republic of
Synopsis
Quantitative magnetization transfer (qMT) imaging provides quantitative measures of magnetization transfer properties, but the method itself suffers from long acquisition and processing time. Previous research has looked into the application of deep learning to accelerate qMT imaging. Specifically, a network called qMTNet was proposed to accelerate both data acquisition and fitting. In this study, we propose qMTNet+, an improved version of qMTNet, that accomplishes both acceleration tasks as well as generation of missing data with a single residual network. Results showed that qMTNet+ improves the quality of generated MT images and fitted qMT parameters compared to qMTNet.
Introduction
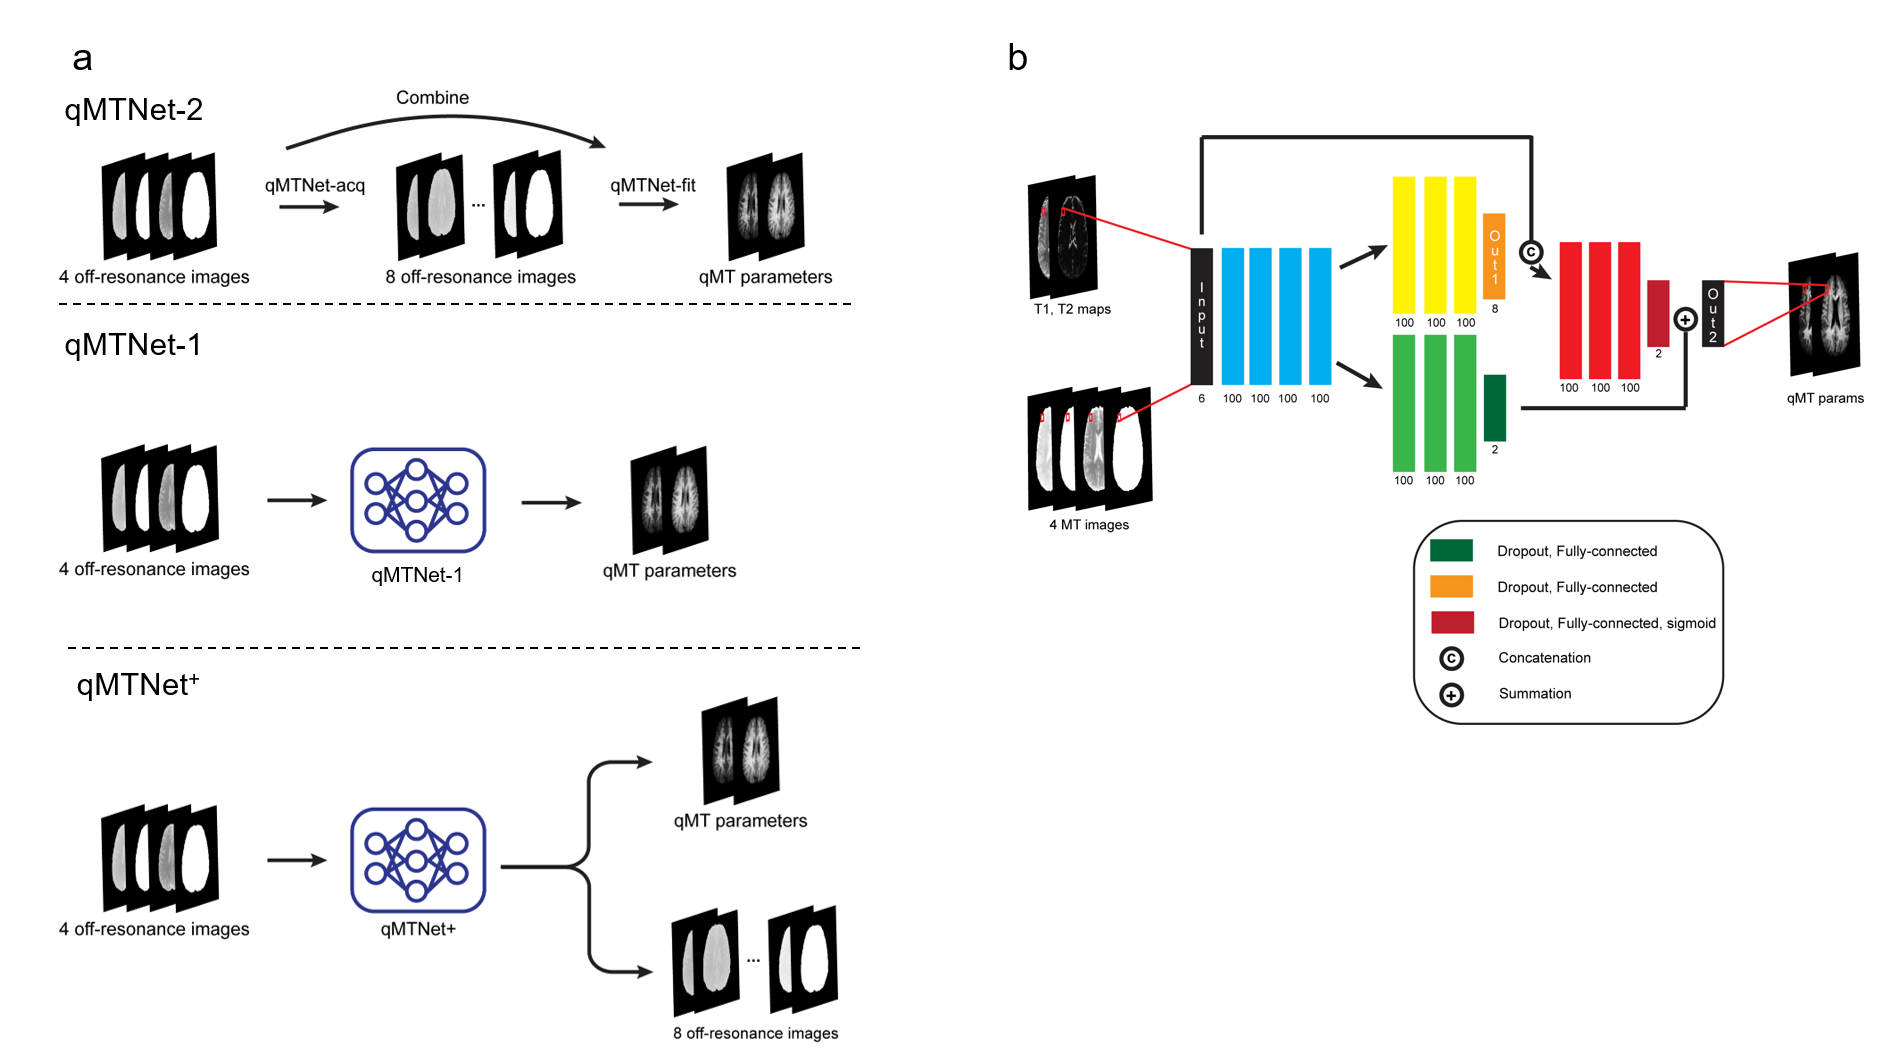
Quantitative magnetization transfer (qMT) imaging1 produces more consistent and quantitative estimates of magnetization transfer (MT) properties compared to conventional MT ratio imaging. Even though qMT imaging has been found to be useful in some clinical studies2-5, the method suffers from long acquisition time for sufficient data acquisition and long processing time for fitting the acquired data to the two-pool MT model. In several studies, methods have been proposed to reduce the acquisition time such as compressed sensing and parallel acquisition6, inversion recovery qMT7-10, or inter-slice qMT11-13. More recently, a deep learning-based method called qMTNet14 was proposed to accelerate both data acquisition and processing. qMTNet can accelerate data acquisition by a factor of 3 and data fitting by a factor of 5000 with no significant inaccuracy in quantitative values. There are two approaches for qMTNet. The first approach, called qMTNet-2, is the sequential application of two sub-networks, qMTNet-acq and qMTNet-fit, which accelerate data acquisition and data fitting, respectively. The second approach, called qMTNet-1, is an integrated network that predicts qMT parameters directly from the undersampled data. To build upon qMTNet in this study, we proposed qMTNet+, a network that can generate both unacquired data and qMT parameters from the limited acquisition with a single network, combining the functionality of qMTNet-1 and qMTNet-acq.Methods
All experiments were approved by the local institutional review board with written consent from the participants. To acquire the data for training the networks, 7 healthy subjects (5 males, 24-29 years) were scanned with a Siemens 3T Tim Trio scanner. Additional data for generalizability testing were acquired from 4 healthy young subjects (3 males, 25-27 years) and 4 healthy older subjects (3 males, 61-76 years) with a Siemens Verio 3T scanner. The scanning protocol follows the previous works11,14, which consist of presaturation MT1, inter-slice MT, T1, and T2 mapping. The reference qMT parameters were derived using dictionary-based fitting for both types of MT data.Figure 1a shows a comparison between qMTNet+ and qMTNet schemes. Unlike qMTNet-2 with two sub-networks or qMTNet-1 that can produce only qMT parameters, qMTNet+ has a single network with two outputs, which predict unacquired MT data and qMT parameters. The detailed structure of qMTNet+ is shown in Figure 1b. qMTNet+ was composed of fully-connected layers with a single shared path and two branches with residual connection. Unless specified in the figure, each fully-connected layer is followed by ReLU activation and batch normalization. The data were processed in a pixel-wise manner to predict the outputs from T1, T2, and 4 acquired MT data points (2 kHz and 25 kHz with 30º and 75º flip angle) in each pixel.
We trained qMTNet+ with 7-fold cross-validation, with the same training procedures and parameters as qMTNet. To verify the effectiveness of qMTNet+, we compared the synthesized MT images of qMTNet+ with those of qMTNet-acq and compared the fitted qMT parameters of qMTNet+ with those of qMTNet-1, the best performing fitting network on undersampled data. Quantitative comparison includes peak signal-to-noise ratio (PSNR), structural similarity index measure (SSIM) and normalized root mean square error (NRMSE). Generalization testing was performed by inspecting the performance on the unseen dataset.
Result
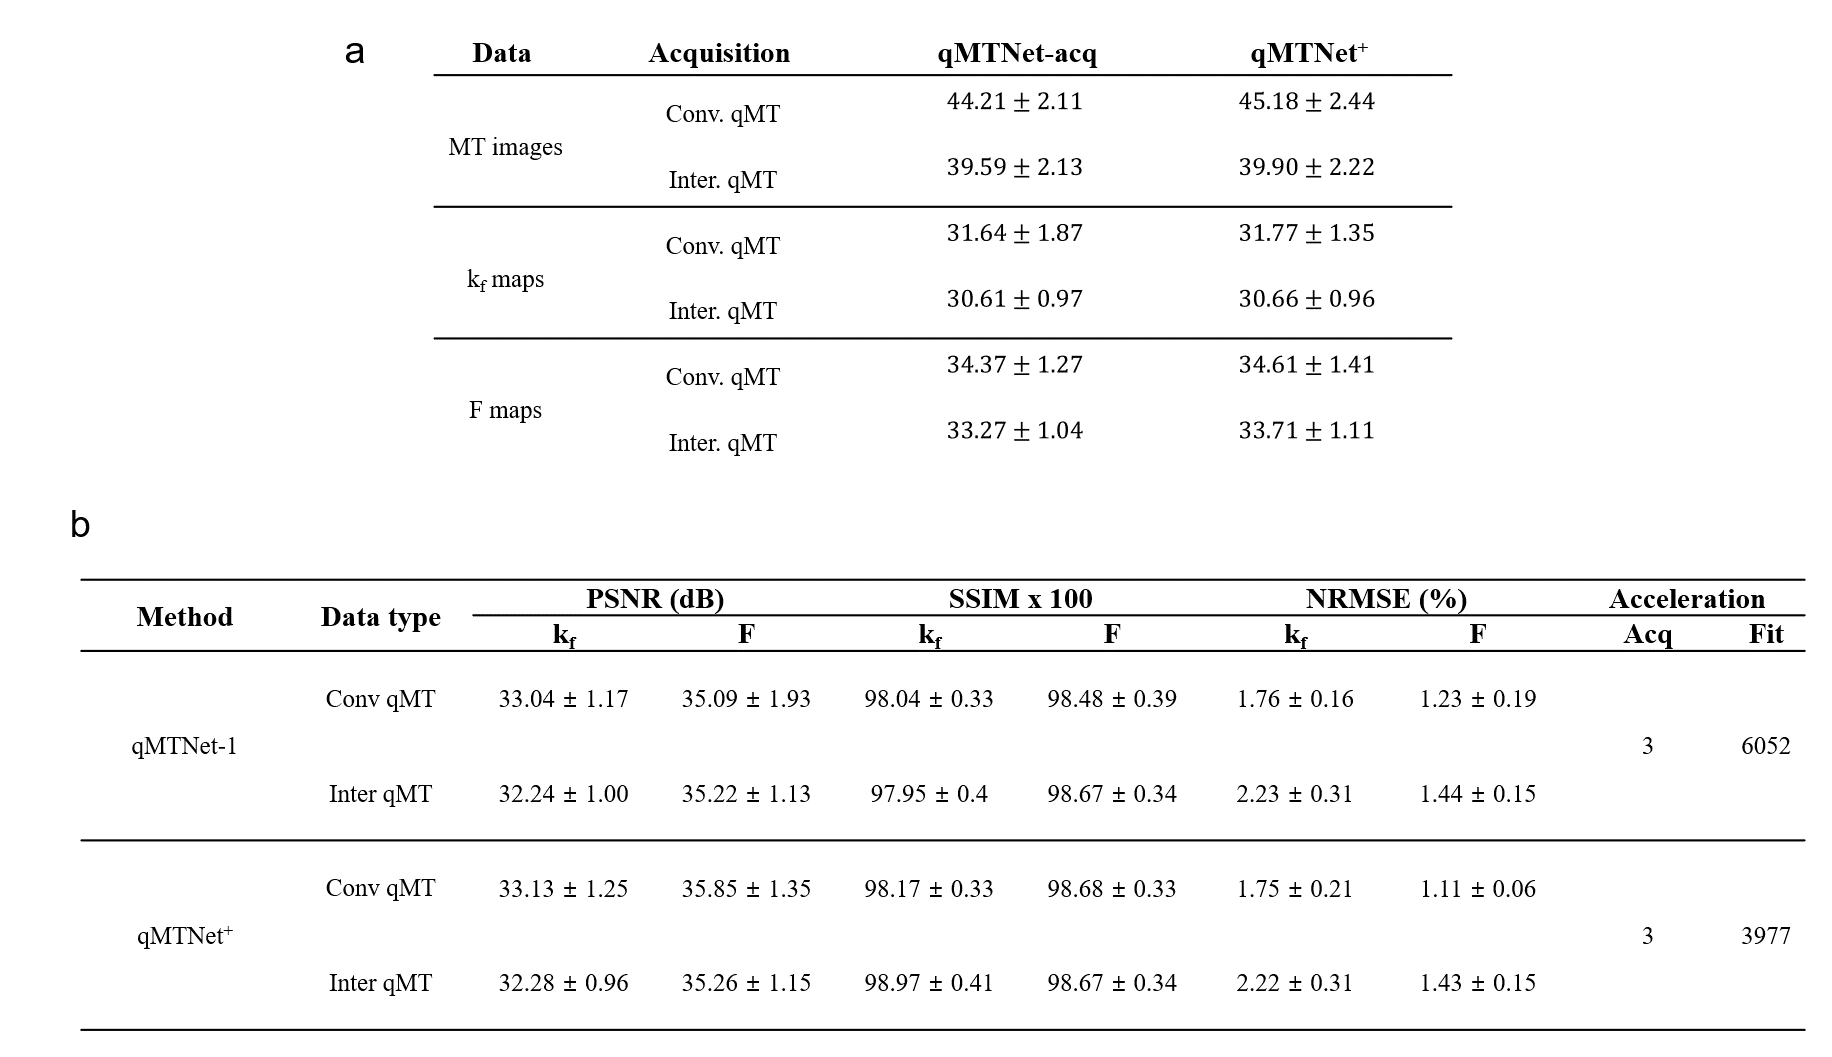
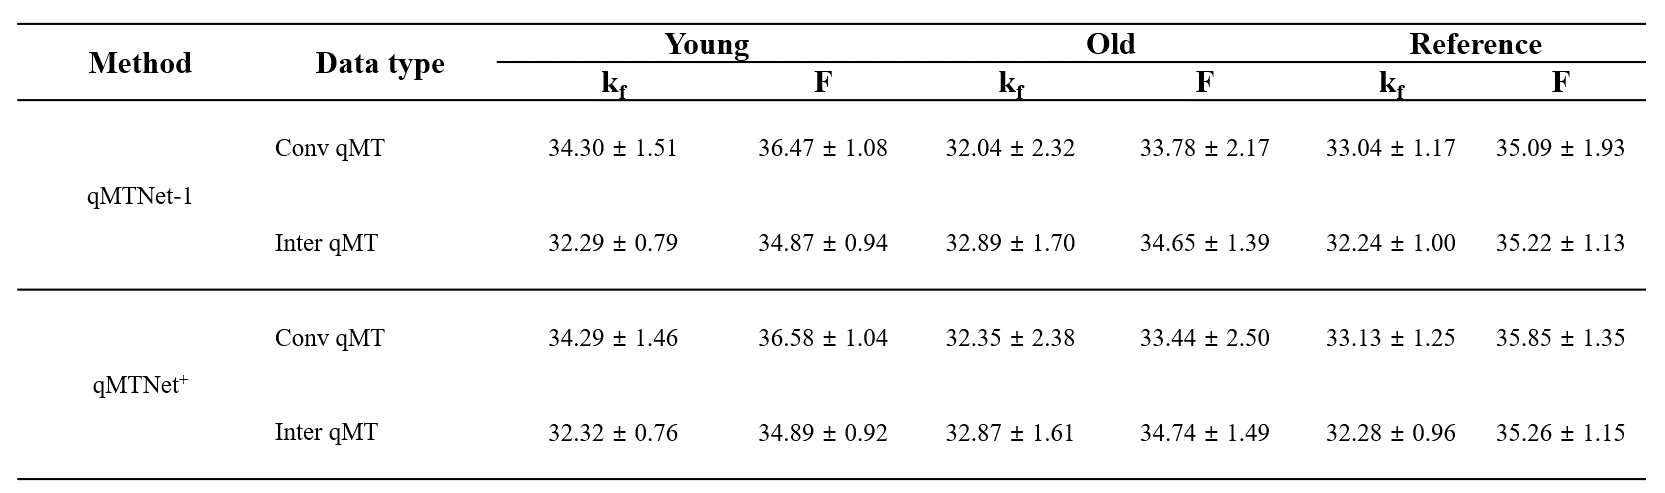
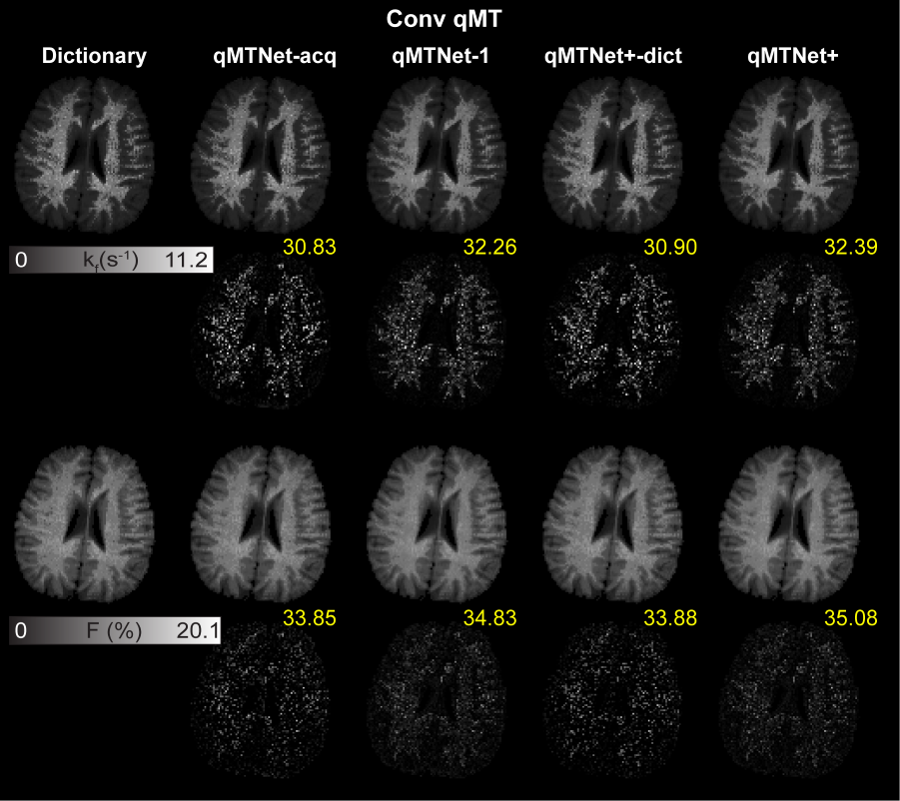
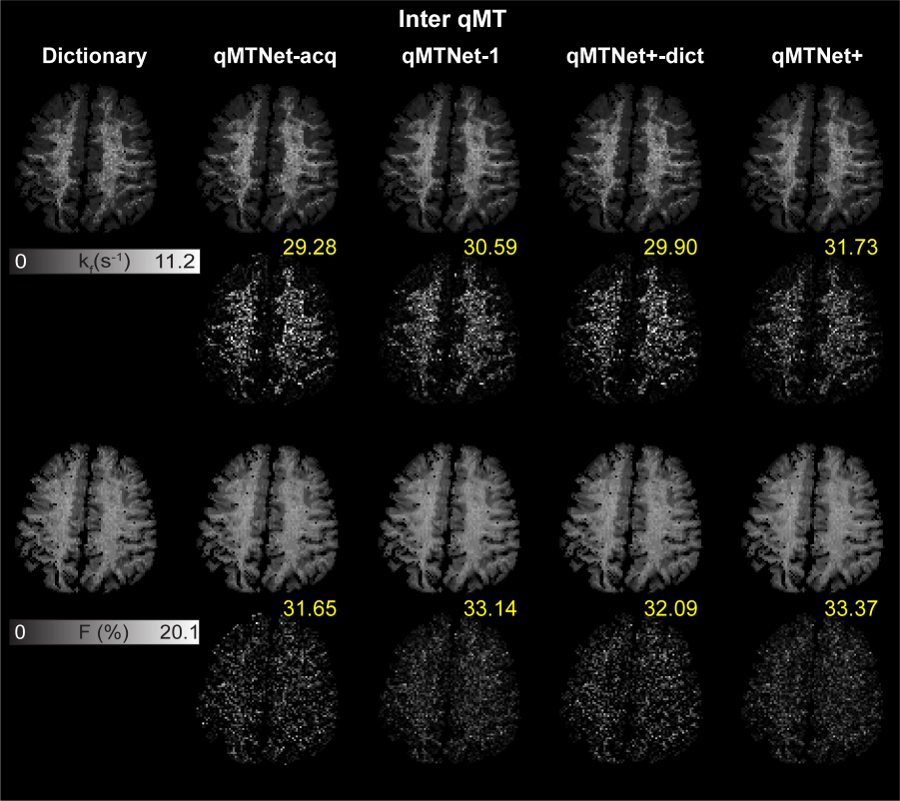
Table 1a shows the PSNR values of MT images and fitted qMT parameters with dictionary fitting of qMTNet-acq and qMTNet+. qMTNet+ consistently showed better results than qMTNet across both types of MT data. Table 1b summarizes the 3 quantitative metrics from cross-validation for qMTNet-1 and qMTNet+, which shows comparable or better performance of qMTNet+ regardless of acquisition scheme or type of qMT parameters. The reduction in processing time is less for qMTNet+ as the network is more complex, but it is still relatively fast (0.35s vs 0.23s for qMTNet-1 per slice). Figures 2 and 3 show the fitted qMT parameter maps from the 4 ANN-based methods in a representative slice for conventional and inter-slice MT data, respectively. The 4 methods are dictionary fitting on MT weighted images produced by qMTNet-acq and qMTNet+ (denoted as qMTNet+-dict), and direct fitting of under-sampled MT data with qMTNet-1 and qMTNet+. There were little visual differences between the qMT parameter maps generated from the four methods, but the 5 times magnified error plot and PSNR values showed qMTNet+ is superior. PSNR of qMTNet+ and qMTNet-1 on the unseen data are shown in Table 2. The two networks showed good performance on both the young and old subject groups, whose data were acquired from a different scanner. qMTNet+ shows comparable or better quantitative values over qMTNet-1 for most data combinations, qMT parameters, and subject groups except for Conventional-F map-old subjects group combination.Discussion
qMTNet+ accelerates qMT imaging by producing both unacquired data and qMT parameters from the acquired data. Cross-validation results show qMTNet+ improves the performance compared to the previously proposed qMTNet. qMTNet+ also generalized to data that was acquired from a different scanner and different subject population. However, generalization to subjects with neurological pathologies has not been considered in the current study. Further works need to be performed to investigate the behavior of qMTNet+ on abnormal patient data and thus to enable more widespread usage of qMT acquisition in the clinic.Acknowledgements
No acknowledgement found.References
1. Henkelman RM, Huang X, Xiang QS, Stanisz GJ, Swanson SD, Bronskill MJ. Quantitative interpretation of magnetization transfer. Magn Reson Med 1993;29(6):759-766.
2. Schmierer K, Tozer DJ, Scaravilli F, Altmann DR, Barker GJ, Tofts PS, Miller DH. Quantitative magnetization transfer imaging in postmortem multiple sclerosis brain. J Magn Reson Imaging 2007;26(1):41-51.
3. Levesque IR, Giacomini PS, Narayanan S, Ribeiro LT, Sled JG, Arnold DL, Pike GB. Quantitative magnetization transfer and myelin water imaging of the evolution of acute multiple sclerosis lesions. Magn Reson Med 2010;63(3):633-640.
4. Garcia M, Gloor M, Bieri O, Radue EW, Lieb JM, Cordier D, Stippich C. Imaging of Primary Brain Tumors and Metastases with Fast Quantitative 3-Dimensional Magnetization Transfer. J Neuroimaging 2015;25(6):1007-1014.
5. Harrison NA, Cooper E, Dowell NG, Keramida G, Voon V, Critchley HD, Cercignani M. Quantitative Magnetization Transfer Imaging as a Biomarker for Effects of Systemic Inflammation on the Brain. Biol Psychiatry 2015;78(1):49-57.
6. McLean M, Lebel RM, MacDonal ME, Boudreau M, Pike GB. Accelerated quantitative magnetization transfer (qMT) imaging using compressed sensing and parallel imaging. 28th Annual Meeting, ISMRM 2020; Program number: 3137
7. Gochberg DF, Gore JC. Quantitative imaging of magnetization transfer using an inversion recovery sequence. Magn Reson Med 2003;49(3):501-505.
8. Gochberg DF, Gore JC. Quantitative magnetization transfer imaging via selective inversion recovery with short repetition times. Magn Reson Med 2007;57(2):437-441.
9. Li K, Zu Z, Xu J, Janve VA, Gore JC, Does MD, Gochberg DF. Optimized inversion recovery sequences for quantitative T1 and magnetization transfer imaging. Magn Reson Med 2010;64(2):491-500.
10. Dortch RD, Li K, Gochberg DF, Welch EB, Dula AN, Tamhane AA, Gore JC, Smith SA. Quantitative magnetization transfer imaging in human brain at 3 T via selective inversion recovery. Magn Reson Med 2011;66(5):1346-1352.
11. Kim JW, Lee SL, Choi SH, Park SH. Rapid framework for quantitative magnetization transfer imaging with interslice magnetization transfer and dictionary-driven fitting approaches. Magn Reson Med 2019;82(5):1671-1683.
12. Barker JW, Han PK, Choi SH, Bae KT, Park SH. Investigation of inter-slice magnetization transfer effects as a new method for MTR imaging of the human brain. PLoS One 2015;10(2):e0117101.
13. Han PK, Barker JW, Kim KH, Choi SH, Bae KT, Park SH. Inter-Slice Blood Flow and Magnetization Transfer Effects as A New Simultaneous Imaging Strategy. PLoS One 2015;10(10):e0140560.
14. Luu HM, Kim DH, Kim JW, Choi SH, Park SH. qMTNet: Accelerated quantitative magnetization transfer imaging with artificial neural networks. Magn Reson Med 2020. 85: 298– 308.
Figures