2161
Ultra-high resolution quantitative multi-parameter mapping (MPM) for post-mortem whole brain microstructure imaging1Neurophysics, Max Planck Institute for Human Cognitive and Brain Sciences, Leipzig, Germany, 2Center for Cognitive Neuroscience Berlin, Freie Universität Berlin, Berlin, Germany, 3Paul Flechsig Institute of Brain Research, University of Leipzig, Leipzig, Germany, 4INM-1, Structural and Functional Organisation of the Brain, Forschungszentrum Juelich GmbH, Juelich, Germany, 5Cecile und Oskar Vogt Institute for Brain Research, Heinrich Heine University Duesseldorf, Duesseldorf, Germany, 6Felix Bloch Institute for Solid State Physics, Faculty of Physics and Earth Sciences, Leipzig University, Leipzig, Germany
Synopsis
Reference neuroanatomical brain data are required to validate qMRI microstructural metrics and link them to histological measures. The BigBrain dataset provides unique cytoarchitectonic 3D atlas based on several post-mortem human brains. We aim to complement the BigBrain atlas by ultrahigh-resolution quantitative multi-parameter maps. Here, we present ultra-high resolution quantitative multi-parameter maps (MPM) acquired at 3T and 7T on a post-mortem brain. We demonstrate high data quality and feasibility of cortical layer and subcortical nuclei analysis. The brain will be processed following the BigBrain cytoarchitectonic atlasing procedure and will reveal specific qMRI fingerprints of cortical areas with distinct cytoarchitecture.
INTRODUCTION
Reference neuroanatomical brain data are indispensable for human neuroscience. They further our understanding of brain anatomy in general and also allow us to identify and align important cortical areas across individuals, i.e., create atlases in stereotactic space. One of the most comprehensive atlas initiatives is the ‘BigBrain’ initiative, which provides unique cytoarchitectonic 3D atlases based on histological data from several human brains1. In the ‘BigBrain’ project several post-mortem human brains are sectioned, histologically stained, imaged and reconstructed into a contiguous 3D volume. The aim is to provide a reference neuroanatomical atlas that shows the precise characterisation of the local morphology, cell densities, and layered organisation of the cortex at cellular resolution.Recent progress in in vivo quantitative MRI (qMRI) enables microstructural characterisation at submillimeter resolution2 providing unique information about cortical layers and subcortical nuclei3.
We aim to merge these two parallel developments by integrating the ‘BigBrain’ cytoarchitectonic atlas approach with ultrahigh-resolution quantitative multi-parameter maps (MPM)3,4. We developed a tissue handling and MRI scanning protocol that is compatible with the histological ‘BigBrain’ processing pipeline. We acquired MPM data at 3T and 7T data on one post-mortem brain, which will be histologically processed for the ‘BigBrain’ project. The ‘BigBrain’ qMRI maps provide a link between the post-mortem neuroanatomical atlas and in vivo qMRI neuroimaging data. In particular, specific qMRI fingerprints of subcortical nuclei and cortical areas with distinct cytoarchitecture could possibly be translated to in vivo applications.
METHODS:
A post-mortem human brain (female, age of death: 73 yrs, cause of death: acute respiratory syndrome, post-mortem time before fixation: 7h) was fixed in 4% paraformaldehyde solution for four months. Tissue acquisition, handling and fixation procedures were described in detail previously1. The brain was transferred to phosphate buffered solution (PBS solution, pH 7.4) 72h prior to scanning to remove formaldehyde monomers and thus improve image contrast. For MRI scanning, the brain was covered and padded with cotton tissues to prevent cortical damage and placed in a custom-made head-shaped container filled with degassed PBS. The container was exposed to 1 mBar vacuum for 12 hours to remove air bubbles.MPM4, data were obtained on a 7T and a 3T MRI systems (7T Terra and 3T PrismaFit, Siemens Healthineers, Germany), using 32 channel radio-frequency head coils. At 7T, two multi-echo FLASH acquisitions (TR=50ms, equidistant TE1-8=3.66-22.56ms, flip angles (FA): 11° and 59°, isotropic resolution of 0.3 mm, and an additional calibration scan for FA mapping using the Bloch-Siegert-Shift method5 were obtained. At 3T, three multi-echo FLASH acquisitions (TR=24.5ms, equidistant TE1-12=2.5-18.6ms, FAs: 8° and 44°, isotropic resolution of 0.8 mm, and additional calibration scan for FA mapping (spin-echo stimulated-echo acquisition6) were obtained. The quantitative maps4, including quantitative maps of proton density (PD) and longitudinal (R1) and effective transverse (R2*) relaxation rates were reconstructed using a version of the hMRI toolbox (hMRI.info) adapted for post-mortem and 7T imaging7. The R1 maps for both 3T and 7T data were used as input into FreeSurfer's cortical surface reconstruction pipe-line (Freesurfer version 7.1.0, using the ‘hires’ flag). Layering was achieved with an equi-volume approach8. Quantitative MRI parameters were mapped onto the mid-cortical surface for visual inspection of cortical myelination patterns.
RESULTS:
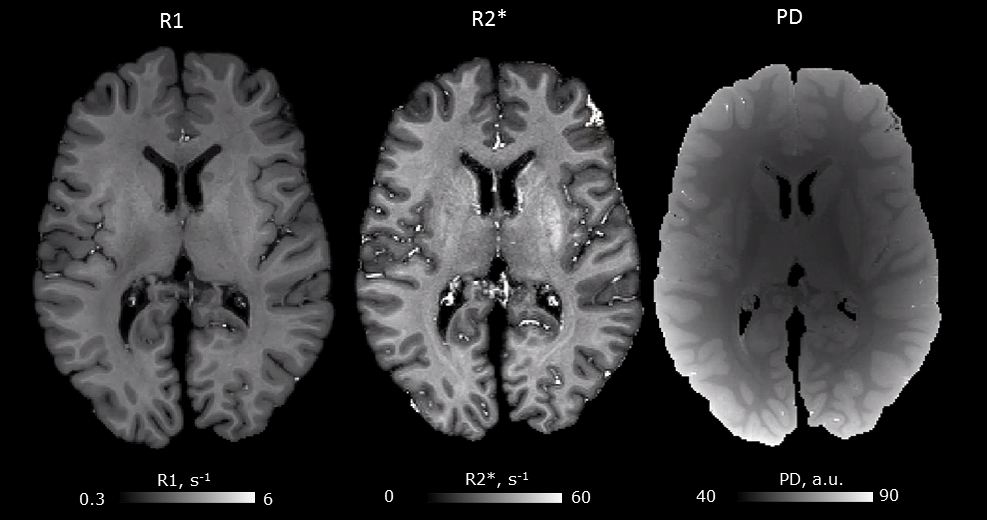
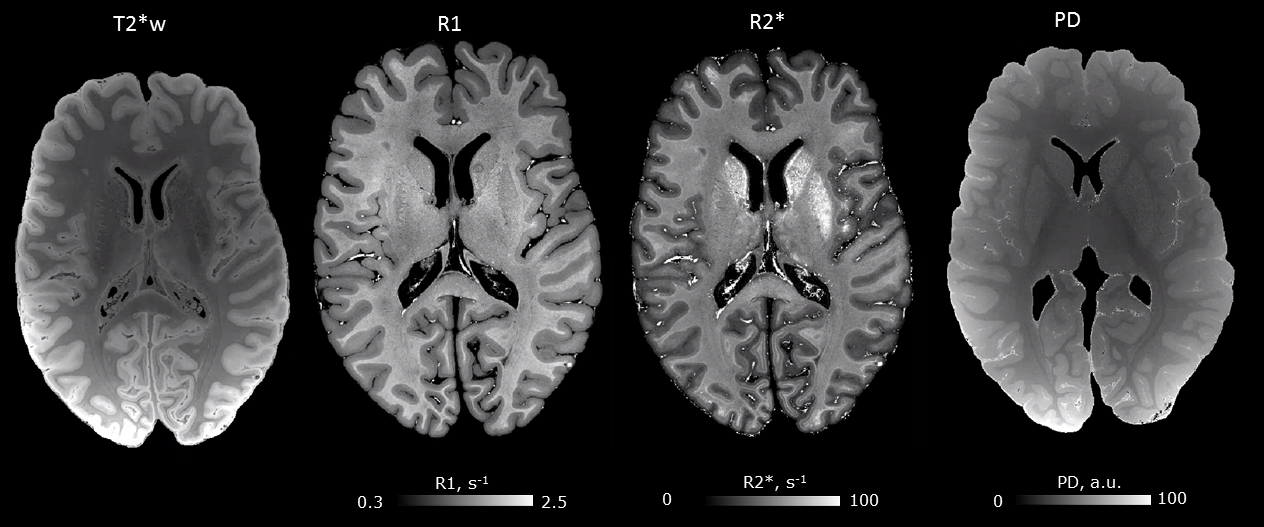
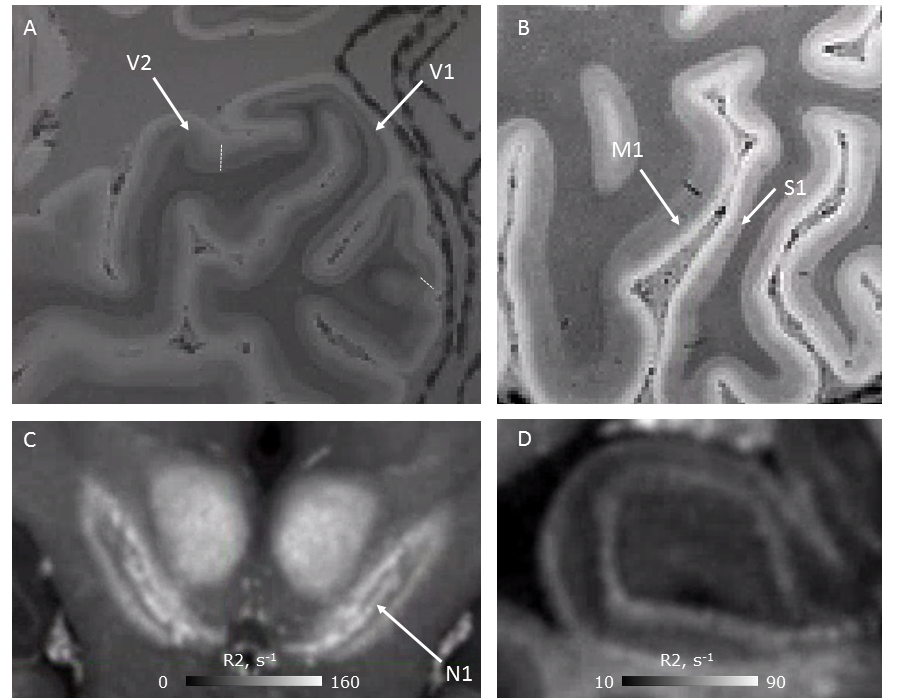
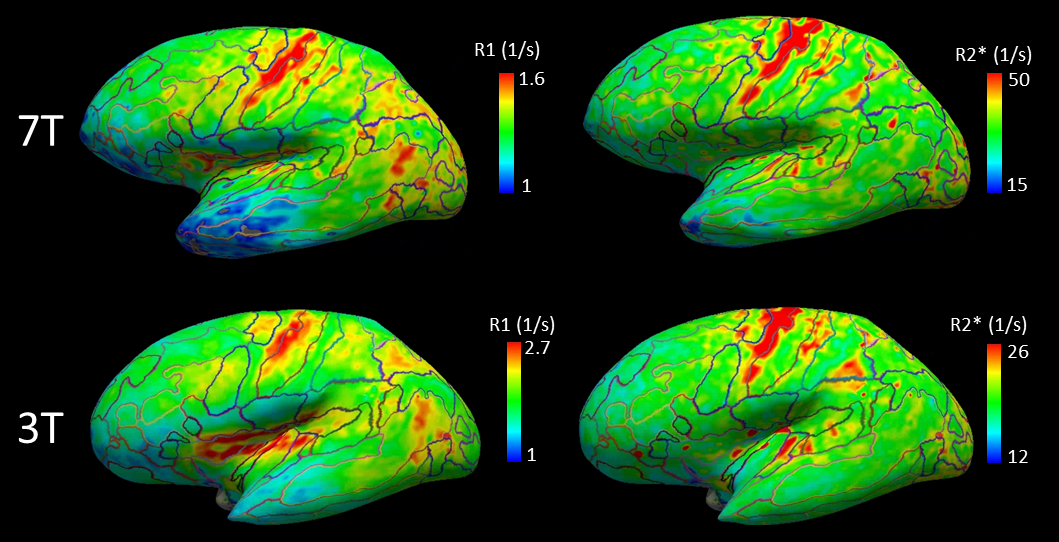
Quantitative maps of R1, R2* and PD showed consistently high contrast between gray and white matter at 3T and 7T (Figs. 1, 2). Homogeneous appearance of white matter indicated generally high tissue quality without signs of fixation artifacts or autolysis. Smooth variations of R1 across the white matter might be related to the concentration gradient of remaining paraformaldehyde across the brain, which spared the cortex. R1 maps showed a much larger dynamic range at 3T as compared to 7T, while R2* contrast in 7T data was about twice that at 3T (compare Fig. 1,2, Fig.4). The 7T MPM showed clear intracortical contrast in line with the layered myeloarchitecture (Fig. 3), e.g., the Stria of Gennari. Difference in cortical thickness between the motor- and somatosensory cortex was also clearly detectable. Also small nuclei in the subcortex (such as nigrosomes in SN, Fig. 3) were clearly recognizable on qMRI maps. Cortical thickness analysis and analysis of cortical myelination revealed results consistent with published in vivo findings (Fig.4), with primary areas showing highest myelination across the brain.DISCUSSION AND CONCLUSIONS:
Ultra-high resolution quantitative multi-parameter maps acquired at 3T and 7T on a whole post-mortem brain with unprecedented resolution yields important information about the brain tissue microstructure. The high resolution and high SNR in combination with high tissue quality facilitate analysis of submillimeter anatomical structures such as cortical layers and subcortical nuclei. The multiple quantitative maps that are obtained with our approach carry complementary information about tissue composition, being sensitive to myelin (R1, R2*) and iron content (R2*)2. In addition, this high resolution data will be used to support the 3D reconstruction of the histological ‘BigBrain’ data. Additionally, it can be used to validate the cortical thickness measures obtained from histological data, by controlling for tissue shrinkage and deformation during histological processing. Combined with histological data, our qMRI maps will provide anatomical reference data and specific qMRI fingerprints of cortical areas with distinct cytoarchitecture, for interpretation and validation of in vivo qMRI applications.Acknowledgements
The research leading to these results has received funding from the European Research Council under the European Union's Seventh Framework Programme (FP7/2007-2013) / ERC grant agreement n° 616905. This project has received funding from the European Union's Horizon 2020 research and innovation programme under the grant agreement No 681094, and under the Specific Grant Agreement No. 945539 (Human Brain Project SGA3), and is supported by the Swiss State Secretariat for Education, Research and Innovation (SERI) under contract number 15.0137. This project has received funding from the BMBF (01EW1711A & B) in the framework of ERA-NET NEURON.References
1. Amunts, K. et al. BigBrain: an ultrahigh-resolution 3D human brain model. Science 340, 1472–1475 (2013).
2. Edwards, L. J., Kirilina, E., Mohammadi, S. & Weiskopf, N. Microstructural imaging of human neocortex in vivo. Neuroimage 182, 184–206 (2018).
3. Trampel, R., Bazin, P.-L., Pine, K. & Weiskopf, N. In-vivo magnetic resonance imaging (MRI) of laminae in the human cortex. Neuroimage 197, 707–715 (2019).
4. Weiskopf, N. et al. Quantitative multi-parameter mapping of R1, PD(*), MT, and R2(*) at 3T: a multi-center validation. Front. Neurosci. 7, 95 (2013).
5. Sacolick, L. I., Wiesinger, F., Hancu, I. & Vogel, M. W. B1 mapping by Bloch-Siegert shift. Magn. Reson. Med. 63, 1315–1322 (2010)
6. Lutti, A. et al. Robust and fast whole brain mapping of the RF transmit field B1 at 7T. PLoS One 7, e32379 (2012).
7. Tabelow, K. et al. hMRI - A toolbox for quantitative MRI in neuroscience and clinical research. Neuroimage 194, 191–210 (2019).
8. Waehnert, M. D. et al. Anatomically motivated modeling of cortical laminae. Neuroimage 93(2), 210–220 (2014).
Figures