2160
Sensitivity of structural brain MRI in clinical cross-sectional studies1Griffith University, Southport, QLD, Australia, 2Nuclear Medicine, Royal Adelaide Hospital, Adelaide, SA, Australia, 3University of Sunshine Coast, Sunshine Coast, QLD, Australia
Synopsis
The sensitivity of different structural MRI sequences for the detection of clinical abnormalities in cross-sectional studies was evaluated using actual population studies. We studied 3 patient cohorts on two MRI scanners (1.5T and 3T), using T1wSE, T2wSE, T1GRE, T2SPACE and MTC sequences for clinical group comparisons. Novel insights into their clinical potential of different structural MRI scans indicated T1wSE and T2wSE offer advanced sensitivity and should be standard in clinical cross-sectional studies. . Although our sensitivity metric was computed for separate voxels, we expect inter-subject variance will have a similar effect on the sensitivity for cluster detection.
introduction
Given that in white matter 90% of R1(1/T1) contrast is determined by myelin, and in grey matter 81% of R2*(1/T2*) contrast by iron1, so-called ‘structural MRI’ offers quite specific evaluation of functionally relevant brain molecules. However, they are rarely used. Although scans with strong grey – white matter contrast are visually appealing, their inter-subject variance determines whether they are sensitive in cross-sectional comparisons. The sensitivity of different structural MRI sequences for the detection of clinical abnormalities in cross-sectional studies can best be evaluated by performing actual population studies. Over 15 years we have studied 3 patient cohorts on two MRI scanners (1.5T and 3T), using T1wSE, T2wSE, T1GRE, T2SPACE and MTC sequences for clinical group comparisons and correlations with severity metrics2-5 (SE = spin echo, GRE = gradient echo, SPACE = Siemens ‘optimized 3D fast spin-echo’ that yields T2 contrast, and MTC = magnetization transfer contrast).methods
Using standard voxel-based statistical analysis we here derive sensitivity in terms of the effect size that would yield a nominal statistical inference for specific sequences and cohorts. We report, for the above MRI sequences, the mean sensitivity in two white matter regions: the sensorimotor cortex and the brainstem. Although not relevant to our sensitivity results, each of the three cohorts consisted of healthy controls (HC) and chronic fatigue syndrome (ME/CFS) subjects. Cohorts A and B were acquired 6 years apart on the same Philips Integra 1.5 Tesla scanner with a birdcage receive coil. Cohort C was acquired on a Siemens 3T Skyra scanner with a 64 channel head-neck coil. Table 1 lists cohort and sequence details.For each cohort, standard voxel-wise image processing was performed using the SPM (Statistical Parametric Mapping) package: (a) Spatial normalization to a standard anatomical (MNI) space3,5, (b) Statistical analysis via a ‘2 sample’ group comparison, using ‘proportional scaling’ to adjust for variation in inter-subject global levels. SPM output files permit the cohort mean and standard deviation to be computed at each voxel6. A locally written Matlab script computed voxel-wise sensitivity after Abbott et al6, expressed as the effect size (% voxel mean) required to yield a nominal T statistic. Here we evaluate effect sizes in sensorimotor and brainstem regions of interest (Fig 1).
results
Sensitivity images for 3 cohort C sequences are shown in Fig 2. Table 2 lists the effect sizes required to yield significant statistical inference (T = 5.0) in the two regions assessed. These values scale linearly with the reference T statistic chosen. T1wSE was the sequence with the highest sensitivity (smallest effect size) on the 3T scanner (cohort 3). This was followed by T1GRE, T1wSE and T2wSE for cohort A. After 6 years there was an appreciable loss of sensitivity on the same 1.5T scanner (cohort B).discussion
Gradient echo (MPRAGE) structural scans are commonly acquired in fMRI and DTI studies to facilitate spatial normalization, but MPRAGE signal amplitudes are not used quantitatively. However, quantitative T1wSE and T2wSE have been successfully implemented by our group (after further refining inter-subject intensity adjustment)2-5. Consistent with the 3-fold improvement in T1wSE sensitivity at 3T, strong differences between their constituent HC and ME/CFS groups were seen at 3T but not 1.5T. Correlations with clinical metrics were strong for both T1wSE and T2wSE at 1.5T2,4, and T1wSE at 3T. A T1wSE analysis for cohort A that yielded a strong correlation, when repeated with T1 GRE was insignificant, despite similar sensitivities. Although T2 SPACE yielded attractive high spatial resolution images with ‘T2 contrast’, they were ineffective in our cross-sectional studies.conclusion
This analysis provides novel insights into the clinical potential of different structural MRI scans. Quantitative T1wSE and T2wSE offer advanced sensitivity and should be standard in clinical cross-sectional studies. This must be tempered, of course by the unknown clinical effect sizes detected by each sequence. Although our sensitivity metric was computed for separate voxels, we expect inter-subject variance will have a similar effect on the sensitivity for cluster detection.Acknowledgements
We thank the patients and healthy controls who donated their time and effort to participate in this study. This study was supported by the Alison Hunter Memorial Foundation, Stafford Fox Medical Research Foundation, the Judith Jane Mason Foundation (MAS2015F024), Mr. Douglas Stutt, and the Blake-Beckett Foundation, Ian and Talei Stewart, Buxton Foundation and McCusker Charitable Foundation. Their financial support did not affect any aspect of the study.
We thank Richard Burnet, Peter DelFante and Richard Kwiatek in Adelaide for recruiting subjects and Kevin Finegan, Sandeep Bhuta and Tim Ireland at Gold Coast University Hospital for assistance in acquiring MRI scans.
References
1 Stüber, C. et al. Myelin and iron concentration in the human brain :A quantitative study of MRI contrast. NeuroImage 93, 95–106, doi:http://dx.doi.org/10.1016/j.neuroimage.2014.02.026 (2014).
2 Barnden, L., Crouch, B., Kwiatek, R., Burnet, R. & Del Fante, P. Evidence in Chronic Fatigue Syndrome for severity-dependent upregulation of prefrontal myelination that is independent of anxiety and depression. NMR Biomed 28, 404-413, doi:10.1002/nbm3261 (2015).
3 Barnden, L. et al. A brain MRI study of chronic fatigue syndrome: Evidence of brainstem dysfunction and altered homeostasis. NMR Biomed 24, 1302-1312, doi:DOI: 10.1002/nbm.1692 (2011).
4 Barnden, L., Kwiatek, R., Crouch, B., Burnet, R. & Del Fante, P. Autonomic correlations with MRI are abnormal in the brainstem vasomotor centre in Chronic Fatigue Syndrome. NeuroImage: Clinical 11, 530-537, doi:10.1016/j.nicl.2016.03.017 (2016).
5 Barnden, L. R. et al. Hyperintense sensorimotor T1 spin echo MRI is associated with brainstem abnormality in chronic fatigue syndrome. NeuroImage. Clinical 20, 102-109, doi:10.1016/j.nicl.2018.07.011 (2018).
6 Abbott, D., Pell, G., Pardoe, H. & Jackson, G. Voxel-Based Iterative Sensitivity (VBIS): methods and a validation of intensity scaling for T2-weighted imaging of hippocampal sclerosis. NeuroImage 44, 812-819 (2009).
Figures
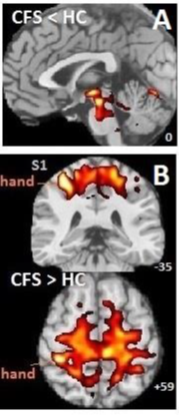
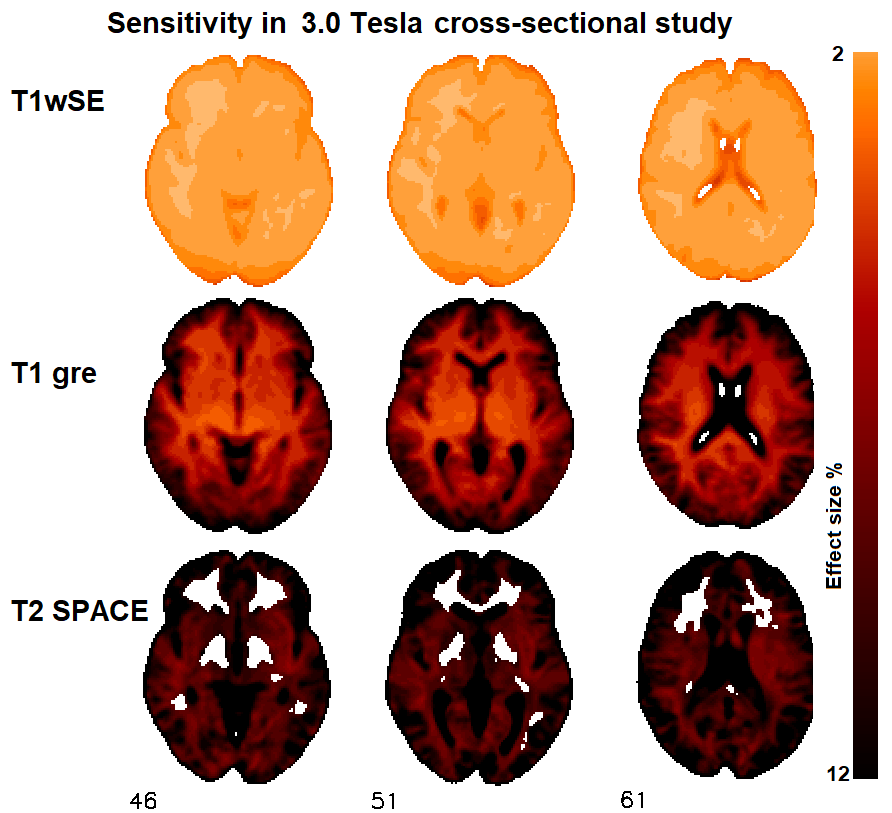
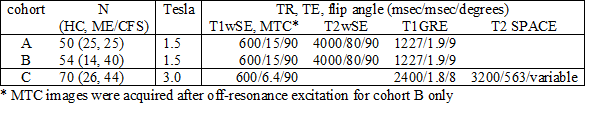
Table 1 Subject cohorts and MRI sequences. For cohorts A and B, the T1wSE (‘turbo’ factor, number averaged) was (3, 2), for T2wSE (8, 1), while for cohort C T1wSE it was (1, 1) (no acceleration).
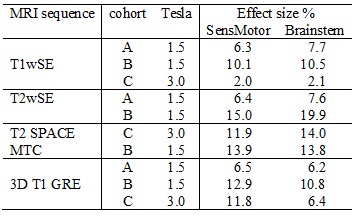
Table 2 Effect size in sensorimotor and brainstem ROIs that yield statistical inference (T=5) for five structural MRI sequences and 3 cohorts