2153
Atrophy Quantification in Multiple Sclerosis: Application to the Multicenter INNI Dataset
Loredana Storelli1, Elisabetta Pagani1, Patrizia Pantano2,3, Nikolaos Petsas2, Gioacchino Tedeschi4, Antonio Gallo4, Nicola De Stefano5, Marco Battaglini5, Paola Zaratin6, Maria A. Rocca1,7,8, and Massimo Filippi1,7,8,9,10
1Neuroimaging Research Unit, Division of Neuroscience, IRCCS San Raffaele Scientific Institute, Milan, Italy, 2Department of Human Neurosciences, "La Sapienza" Rome University, Rome, Italy, 3Department of Radiology, IRCCS Neuromed, Pozzilli, Italy, 4Department of Advanced Medical and Surgical Sciences, and 3T MRI Center, University of Campania “Luigi Vanvitelli”, Naples, Italy, 5Department of Medicine, Surgery and Neuroscience, University of Siena, Siena, Italy, 6Fondazione Italiana Sclerosi Multipla, Genoa, Italy, 7Neurology Unit, IRCCS San Raffaele Scientific Institute, Milan, Italy, 8Vita-Salute San Raffaele University, Milan, Italy, 9Neurorehabilitation Unit, IRCCS San Raffaele Scientific Institute, Milan, Italy, 10Neurophysiology Service, IRCCS San Raffaele Scientific Institute, Milan, Italy
1Neuroimaging Research Unit, Division of Neuroscience, IRCCS San Raffaele Scientific Institute, Milan, Italy, 2Department of Human Neurosciences, "La Sapienza" Rome University, Rome, Italy, 3Department of Radiology, IRCCS Neuromed, Pozzilli, Italy, 4Department of Advanced Medical and Surgical Sciences, and 3T MRI Center, University of Campania “Luigi Vanvitelli”, Naples, Italy, 5Department of Medicine, Surgery and Neuroscience, University of Siena, Siena, Italy, 6Fondazione Italiana Sclerosi Multipla, Genoa, Italy, 7Neurology Unit, IRCCS San Raffaele Scientific Institute, Milan, Italy, 8Vita-Salute San Raffaele University, Milan, Italy, 9Neurorehabilitation Unit, IRCCS San Raffaele Scientific Institute, Milan, Italy, 10Neurophysiology Service, IRCCS San Raffaele Scientific Institute, Milan, Italy
Synopsis
Using the multicenter dataset available within the Italian Neuroimaging Network Initiative, we compared the performance of different atrophy tools on brain MRI from 457 multiple sclerosis (MS) patients and 271 healthy controls, since monitoring neurodegeneration is one of the most important goals of therapeutic strategies in MS. We found an acceptable agreement and comparable performances among the software for GM and whole brain atrophy quantification. The free licence, speed and facility of integration in the clinical routine are also important aspects to consider for the selection of the atrophy pipeline. These results should be confirmed on large-scale longitudinal data.
Introduction
Halting neurodegeneration and promoting neuroprotection in multiple sclerosis (MS) is one of the most important goals of current therapeutic strategies.1, 2 Therefore, there is the need to improve image analysis techniques in order that both whole brain and gray matter (GM) atrophy can be reliably estimated to be of use in the clinical setting for helping in individualized treatment decisions.3, 4 There are both technical and disease-related challenges that prevent atrophy measurements for use in clinical practice. Moreover, there are at present no validated techniques for monitoring single subject neuroprotection using MRI, even using high resolution T1-weighted images.5, 6 The majority of previous studies on atrophy quantification in MS (both global and regional) has enrolled small number of patients and healthy controls (HC). The Italian Neuroimaging Network Initiative (INNI) supports the creation of a repository where MRI, clinical and neuropsychological data from MS patients and HC are collected from Italian Research Centers with internationally-recognized expertise in MRI applied to MS. Using a large multicenter MRI dataset from the INNI repository, we aimed to compare a set of available state-of-art methods for GM and whole brain atrophy measurements to guide in the selection of an atrophy pipeline in MS.Methods
For the quantification of atrophy of the GM and the whole brain, we selected the software to be compared according to the results obtained by our previous study,7 in order to include well-performing methods. Moreover, a new proposed software for brain atrophy quantification was also included. Thus, the pipeline selected for this study were: SIENAX (FSL Library), SPM version 12 (Matlab) and Jim8 (Xinapse Systems). The atrophy software tools were implemented and applied on the 3D T1-weighted MPRAGE image acquired from 457 relapsing-remitting MS patients (Center A: 210, Center B: 57, Center C: 113, Center D: 77) and 271 HC (Center A: 114, Center B: 59, Center C: 72, Center D: 26) collected from the INNI repository. For cross-sectional GM and whole brain atrophy measures, we firstly evaluated the agreement and correlation between GM and brain volume results among the different pipelines on HC. The capability of the different software in discriminating between HC and MS was also assessed. A possible influence of the acquisition of different 3D T1-weighted MRI scans at the different Centers with different MR scanners was also evaluated. The sample size requirement and the possibility to move each atrophy method in the clinical setting were considered.Results
We found significant agreement (p<0.05) and comparable results for both GM and whole brain volume quantification on HC among the different software. In particular, we found the highest significant correlation between the results of SPM and Jim8 tools (0.91, p<0.05) and the lowest (although high) between the results of SIENAX and Jim8 (0.6, p<0.05), for both GM and whole brain atrophy (Figure 1). A bias was found in the comparison between SIENAX and Jim8 GM and whole brain volumes, with a possible systematic underestimation or overestimation of volumes on these images for SIENAX and Jim8, respectively. All pipelines were able to find significant atrophy in MS patients compared to HC (p<0.05), as shown in Figure 2. However, comparing distributions, SIENAX for GM volumes and Jim8 for brain volumes better separated the two distribution of values. Considering each single Center separately, none of the pipeline showed a bias in the estimation of GM or whole brain volumes in respect to a particular MRI Center, with comparable correlations among the Centers and the software. The highest correlations were found again between SPM and Jim8 results (0.91 and 0.96 for GM and whole brain volumes respectively) and the lowest between SIENAX and Jim8 (0.6 and 0.8 for GM and whole brain volumes respectively). To detect significant differences between patients and controls with a significance p-value <0.05 and a statistical power of 0.8, a dataset composed of at least 150 brain MRI for each sample should be employed.Discussion
From the comparisons of the pipelines selected for the quantification of GM and whole brain atrophy quantification, we found an acceptable agreement (>0.6) among the software with comparable performance among them. Possible biases could be irrelevant if the same technique is used for the longitudinal assessment. To move atrophy from the research setting to the clinical practice normative data from at least 150 HC should be available. Moreover, the free licence (as for SIENAX), the speed and the facility of integration in the clinical routine (as for Jim8 and SIENAX) are important aspects to consider for the selection of the atrophy pipeline to use. These results should be explored and confirmed on large-scale longitudinal data.Conclusions
Using the multicenter dataset available within the INNI initiative, we were able to compare the performance of different atrophy tools on large-scale data increasing generalizability and robustness of the results. Importantly, results derived from large datasets of healthy controls and MS patients using these techniques could be easily translated to other neurodegenerative conditions. Recommended guidelines are still needed for both the acquisition and analysis procedures for reliable quantification of GM and whole brain atrophy in MS.Acknowledgements
Funding. This project has been supported by a research grant from the Fondazione Italiana Sclerosi Multipla (FISM2019/S/3), and financed or co-financed with the ‘5 per mille’ public funding.References
1. Sormani MP, Arnold DL, De Stefano N. Treatment effect on brain atrophy correlates with treatment effect on disability in multiple sclerosis. Ann Neurol 2014;75:43-49. 2. Vidal-Jordana A, Sastre-Garriga J, Rovira A, Montalban X. Treating relapsing-remitting multiple sclerosis: therapy effects on brain atrophy. J Neurol 2015;262:2617-2626. 3. Filippi M, Preziosa P, Copetti M, et al. Gray matter damage predicts the accumulation of disability 13 years later in MS. Neurology 2013;81:1759-1767. 4. Rocca MA, Battaglini M, Benedict RH, et al. Brain MRI atrophy quantification in MS: From methods to clinical application. Neurology 2017;88:403-413. 5. Derakhshan M, Caramanos Z, Giacomini PS, et al. Evaluation of automated techniques for the quantification of grey matter atrophy in patients with multiple sclerosis. Neuroimage 2010;52:1261-1267. 6. Enzinger C, Fazekas F. Measuring Gray Matter and White Matter Damage in MS: Why This is Not Enough. Frontiers in neurology 2015;6:56. 7. Storelli L, Rocca MA, Pagani E, et al. Comparison of Methods for Whole-Brain and Grey Matter Atrophy Assessment in Multiple Sclerosis. ECTRIMS; 2017; Paris, France.Figures
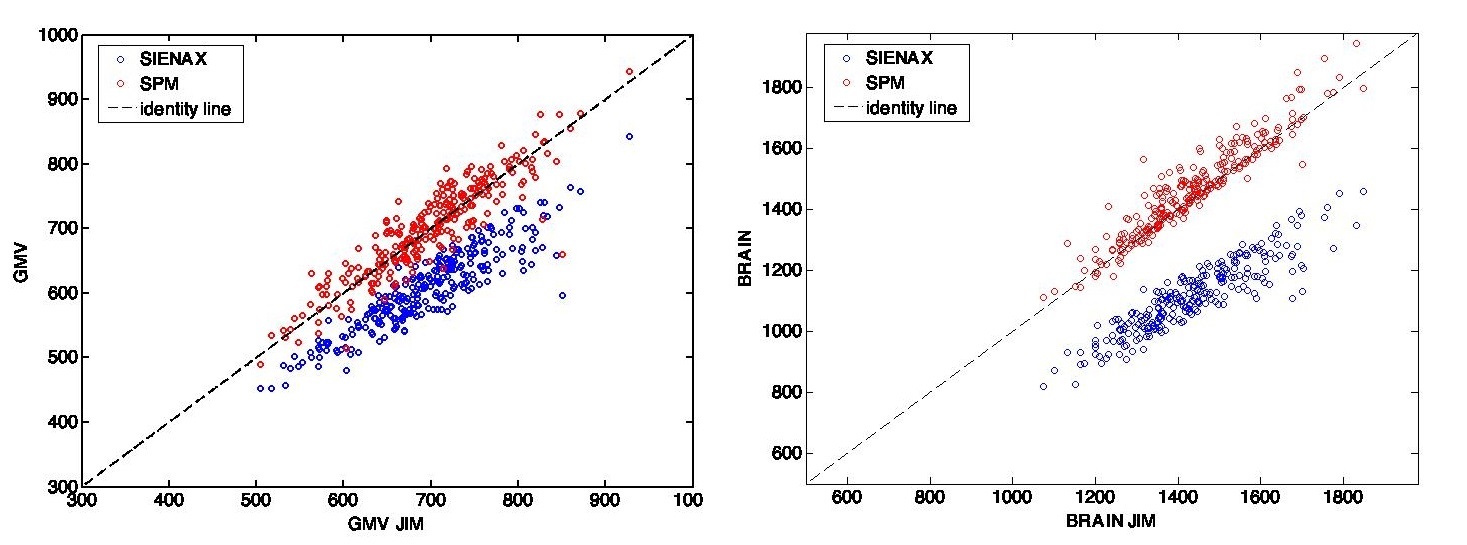
Figure 1. On the left, the scatter plot for the comparisons of GM volume results
(in ml) on HC for the different software. On the right, the scatter plot for
the comparisons of whole brain volume results (in ml) on HC for the different
software. GMV: gray matter volume.
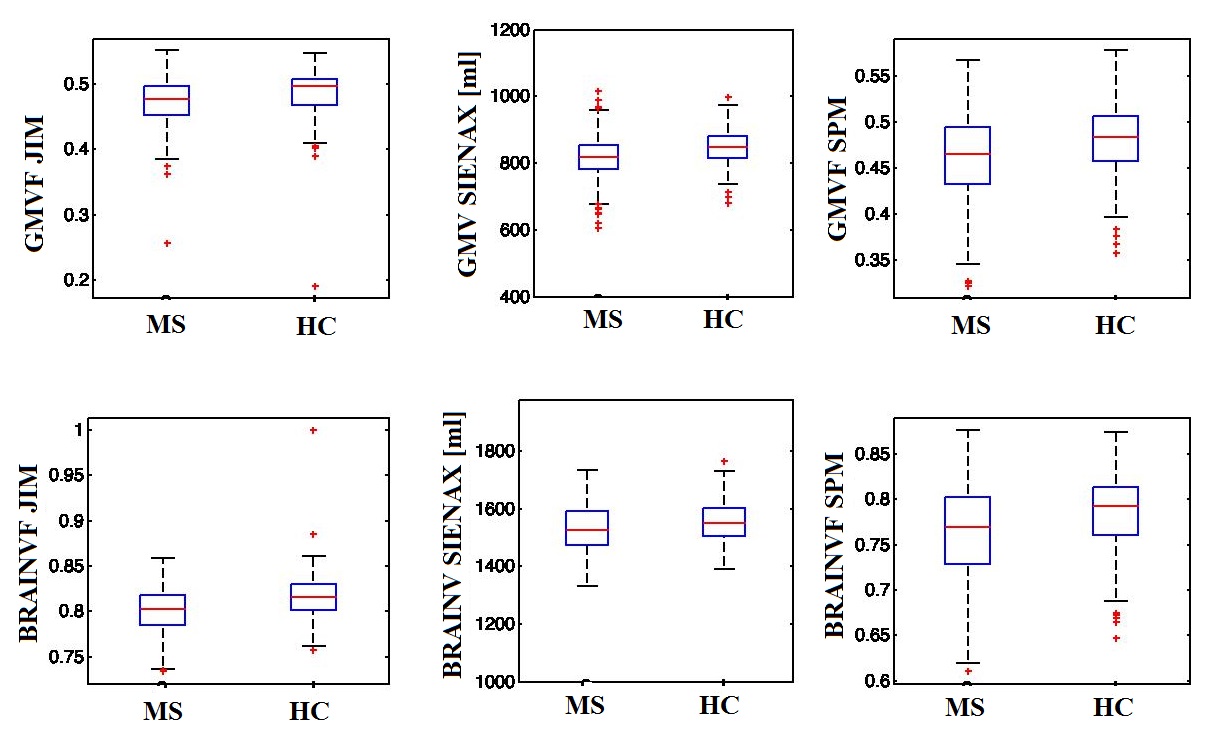
Figure 2. In the first row, the GM volume/volume-fraction distributions for MS and
HC obtained by the different software (in the three columns). In the second
row, the distributions of the whole brain volumes/volume-fractions for MS and
HC obtained by the different software (in the three columns). GMVF: gray matter
volume fraction; BRAINVF: brain volume fraction; MS: multiple sclerosis; HC:
healthy controls.
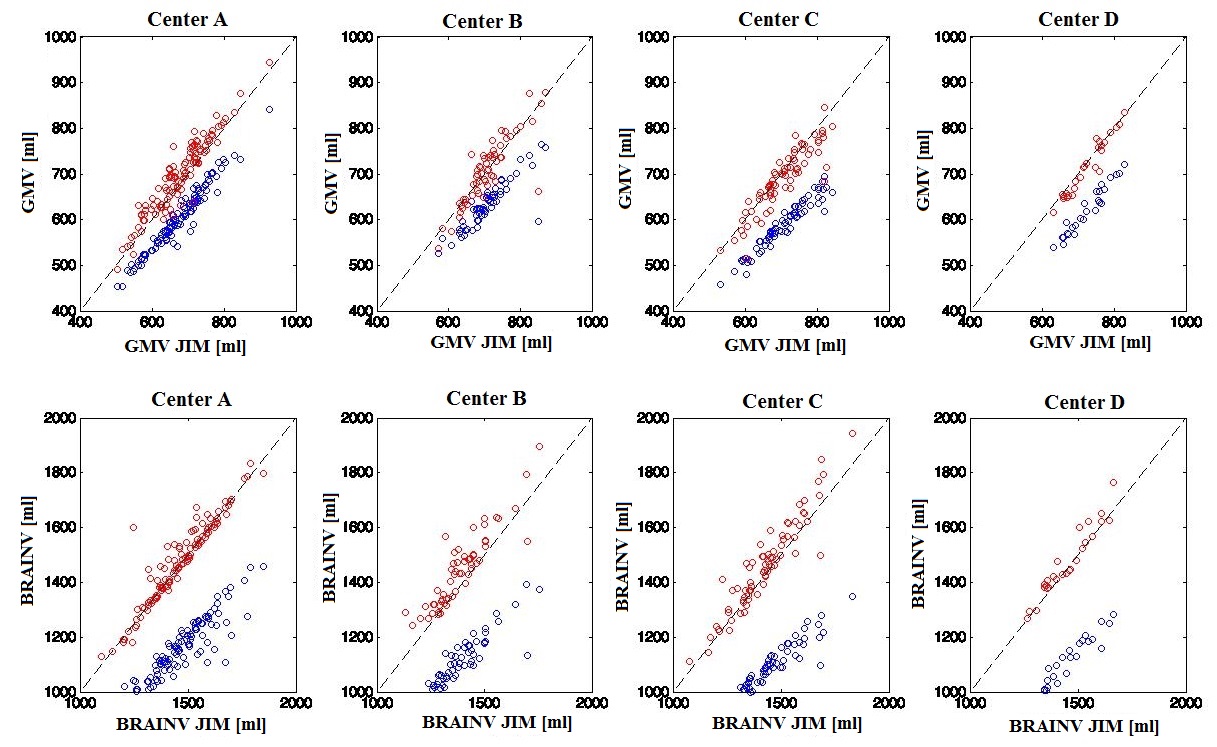
Figure 3. In the first row, the scatter plots for the comparisons of GM volume
results on HC for the different software and separately for each Center (on
each column). In the second row, the scatter plots for the comparisons of whole
brain volume results on HC for the different software and separately for each
Center (on each column).