2151
Exploration of highly accelerated multi-echo MPRAGE using compressed sensing for brain morphometry applications
Lindsay C Hanford1,2,3, Emily M Iannazzi1,2, Tom Hilbert4,5,6, Tobias Kober4,5,6, Randy L Buckner1,2,3, and Ross W Mair1,3
1Center for Brain Science, Harvard University, Cambridge, MA, United States, 2Department of Psychology, Harvard University, Cambridge, MA, United States, 3Martinos Center for Biomedical Imaging, Massachusetts General Hospital, Charlestown, MA, United States, 4Advanced Clinical Imaging Technology, Siemens Healthcare, Lausanne, Switzerland, 5Department of Radiology, Lausanne University Hospital and University of Lausanne, Lausanne, Switzerland, 6LTS5, École Polytechnique Fédérale de Lausanne, Lausanne, Switzerland
1Center for Brain Science, Harvard University, Cambridge, MA, United States, 2Department of Psychology, Harvard University, Cambridge, MA, United States, 3Martinos Center for Biomedical Imaging, Massachusetts General Hospital, Charlestown, MA, United States, 4Advanced Clinical Imaging Technology, Siemens Healthcare, Lausanne, Switzerland, 5Department of Radiology, Lausanne University Hospital and University of Lausanne, Lausanne, Switzerland, 6LTS5, École Polytechnique Fédérale de Lausanne, Lausanne, Switzerland
Synopsis
Compressed sensing (cs) has the potential to shorten scan acquisition time. This time savings may help to reduce patient burden, MR artifacts due to motion, and cost for repeat acquisitions. A key open question is whether time-saving cs T1w structural images will yield quantitative morphometric estimates comparable to traditional longer sequences. To test this, images were acquired for numerous cs T1w image variations across two independent datasets. Structural estimates were compared within- and between-subjects to assess scan stability and the effect of acceleration. x6 cs acceleration (~86s scan) was sufficient to yield comparable morphometrics for most measures in typical applications.
Introduction
Traditional 1 mm isotropic MPRAGE scans take 5-10 minutes to acquire. Not only is this time costly, and an increased burden on subjects, but these acquisitions can be highly susceptible to motion artifacts. Alternatively, rapid scanning techniques have yielded comparable morphometric results1,2 with additional benefits of: (i) reduced patient burden, (ii) less susceptibility to motion, and (iii) repeat scanning within the same time it takes to acquire one conventional scan3. We have previously piloted the use of incoherent undersampling with compressed sensing reconstruction4 in standard MPRAGE acquisitions5,6,7. Here, across two studies, we comprehensively explored the effect of compressed sensing on multi-echo MPRAGE scans to reduce scan time while maintaining the accuracy of the resulting morphometrics.Methods
T1w images were acquired using a standard 32-channel head coil and 3T MRI scanner (MAGNETOM Prisma, Siemens Healthcare, Erlangen, Germany). All scan protocols were based on the “recommended Freesurfer” protocols8, including FOV 256 mm, 176 slices, 1 mm spatial resolution, sagittal orientation, 4 echoes, BW 650 Hz/Px, TE = 1.7/3.5/5.4/7.3ms, TI/TR = 1100/2500ms. The effect of acceleration was tested using a prototype multi-echo MPRAGE sequence with compressed sensing (csMEMPR) and acceleration factors (scan type: x2, x4, x6, x8, x10), resulting in reduced scan times of 4:13, 2:08, 1:26, 1:06, 0:51, respectively. All were compared to a conventional 1.0 mm MEMPR without incoherent undersampling but using GRAPPA = 2 in-plane acceleration (scan time of 5:58, i.e., recommended Freesurfer protocol). The default regularization factor (r = 0.0003) was applied to all cs imaging variants during image reconstruction. Two independent datasets were acquired. In the first study, images were acquired across two independent sessions for 8 subjects. In the second study, this was repeated across four sessions for 8 novel subjects. Images were processed using MRIQC for QC metrics9 and FreeSurfer v6.0.0 longitudinal pipeline10, analyzing each scan type separately. Volumetric11,12,13 and regional cortical thickness14, as parcellated by the Desikan-Killiany atlas15, were compared across scan types. Volumetric estimates included estimated total intracranial volume (eTIV), whole brain volume, hippocampus volume, and amygdala volume. Test-retest reliability of each scan type was calculated by comparing estimates from across sessions. Percent Error was calculated as the percent difference in estimates between sessions: between two scans in study 1, and between four scans in study 2. We answered the critical question of how fast cs imaging compared to traditional imaging by correlating, for multiple morphometric measures, the traditionally acquired quantitative values to the same values using only a single, fast variant cs image.Result
Example traditional 1.0 mm multi-echo MPRAGE and cs MEMPR x2, x4, x6, x8 and x10 images are displayed in Figure 1. At the highest level of compressed sensing acceleration (csMEMPRx10), ringing artifacts appear. Generally, csMEMPR images are visually comparable to the standard image. Ordered by estimate stability, Figure 2 shows the test-retest reliability of volumetric estimates from MEMPR, csMEMPRx6, and csMEMPRx10 scan types. cs imaging variants showed comparable test-retest reliability to that of traditional MEMPR images. Similarly, percent error across subjects for both study 1 and study 2 was comparable between all cs variants and MEMPR images (Figure 3). A direct comparison of the volumetric and thickness estimates obtained from an 86-second 1.0 mm csMEMPRx6 scan to a 6-minute MEMPR scan showed that individual differences between subjects (or ranking) remains preserved (Figure 4). Regions are again ordered by estimate stability. Figure 5 displays surface-based tracings as estimated by the standard image and cs MEMPR x2, x4, x6, x8 and x10 scan types from one subject (i.e., estimates from 12 independent T1w images, 2 of each scan type). Here we see regions of high stability (e.g., superior frontal cortex) and low stability (e.g., inferior temporal cortex) across cs imaging variants.Discussion
This work shows that multi-echo MPRAGE scans can be highly accelerated with incoherent undersampling and compressed sensing reconstruction without significant impact on image quality or accuracy for most structural estimates. Test-retest reliability and the absolute error of the estimate was similar between traditional and T1w cs variants. Most critically, for most structures, the quantitative estimate obtained from a single, highly accelerated cs image was directly comparable to that obtained from a longer traditional acquisition. Quantitative differences between subjects were maintained. In fact, in many ways, our results suggest that an 86-second 1.0 mm csMEMPRx6 scan is an adequate substitute for a standard 6-minute 1.0 mm MEMPR scan. However, acceleration was not without cost. Regions with high susceptibility-induced gradients showed distortion and quantitative measures within those regions were affected (e.g., inferior temporal cortex). The noisiest morphometric estimates (e.g., amygdala) were affected most by high levels of acceleration. By contrast, stable measures including large volumes (e.g., eTIV, whole brain volume) and stable subcortical volumes (e.g., hippocampus) were nearly indistinguishable even at high levels of acceleration.Acknowledgements
NIH Grants R01AG067420; Harvard Center for Brain Science; NIH Shared Instrumentation Grant S10OD020039; NIH Grants P50-MH106435, P41-RR14075, U24-RR021382.References
- Holmes, A.J. et al., ‘Brain Genomics Superstruct Project initial data release with structural, functional, and behavioral measures’, Sci. Data 2015;2:150031.
- Mair, R.W. et al., ‘Impact of acquisition parameters on cortical thickness and volume derived from Multi-Echo MPRAGE scans’, Proceedings ISMRM 2016;24:1158.
- Nielsen, J.A. et al., ‘Precision Brain Morphometry: Feasibility and Opportunities of Extreme Rapid Scans’, bioRxiv 2019;530436.
- Lustig M. et al., ‘Sparse MRI: The application of compressed sensing for rapid MR imaging’ Magn. Reson. Med. 2007;58:1182-1195.
- Mussard E. et al., ‘Accelerated MP2RAGE imaging using Cartesian phyllotaxis readout and compressed sensing reconstruction’, Magn. Reson. Med. 2020;84:1881-1894.
- Hanford, L.C. et al., ‘Proof-of-Concept Longitudinal Tracking of Brain Change Within Individual Patients Using Repeated Acquisitions of Rapid Structural Scans’, Proceedings SfN 2019;427.19.
- Mair, R.W. et al, ‘Optimizing rapid compressed-sensing MPRAGE acquisitions for repeat sampling of brain morphometry within individuals’, Proceedings ISMRM 2020;28:564.
- https://surfer.nmr.mgh.harvard.edu/fswiki/FreeSurferWiki?action=AttachFile&do=get&target=FreeSurfer_Suggested_Morphometry_Protocols.pdf
- Esteban O. et al., ‘MRIQC: Advancing the Automatic Prediction of Image Quality in MRI from Unseen Sites’, PLOS ONE 2017;12:e0184661.
- Reuter, M., ‘Within-subject template estimation for unbiased longitudinal image analysis’, NeuroImage 2012;61;1402-1418.
- Buckner, R.L. et al., ‘A unified approach for morphometric and functional data analysis in young, old, and demented adults using automated atlas-based head size normalization: reliability and validation against manual measurement of total intracranial volume’, NeuroImage,2004;23(2);724-738.
- Fischl, B et al., ‘Whole brain segmentation: automated labeling of neuroanatomical structures in the human brain’, Neuron 2002;33;341-355.
- Fischl, B. et al., ‘Sequence-independent segmentation of magnetic resonance images’, Neuroimage 2004a;23(s1);69-84.
- Fischl, B., ‘Measuring the thickness of the human cerebral cortex from magnetic resonance images’, Proc. Natl. Acad. Sci. 2000;97;11050-11055.
- Desikan, R.S. et al., ‘An automated labeling system for subdividing the human cerebral cortex on MRI scans into gyral based regions of interest’, Neuroimage 2006;31;968-980.
Figures
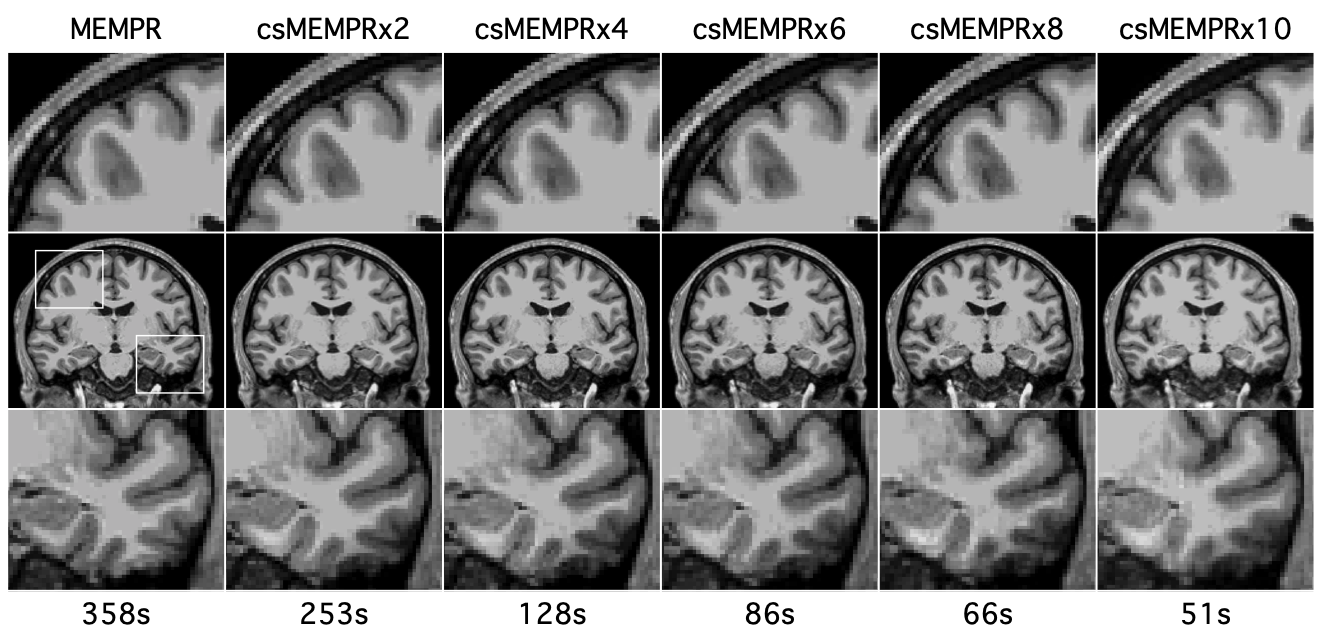
Figure 1: Example raw T1w images from traditional 1.0 mm multi-echo MPRAGE and cs acceleration variants from one subject.
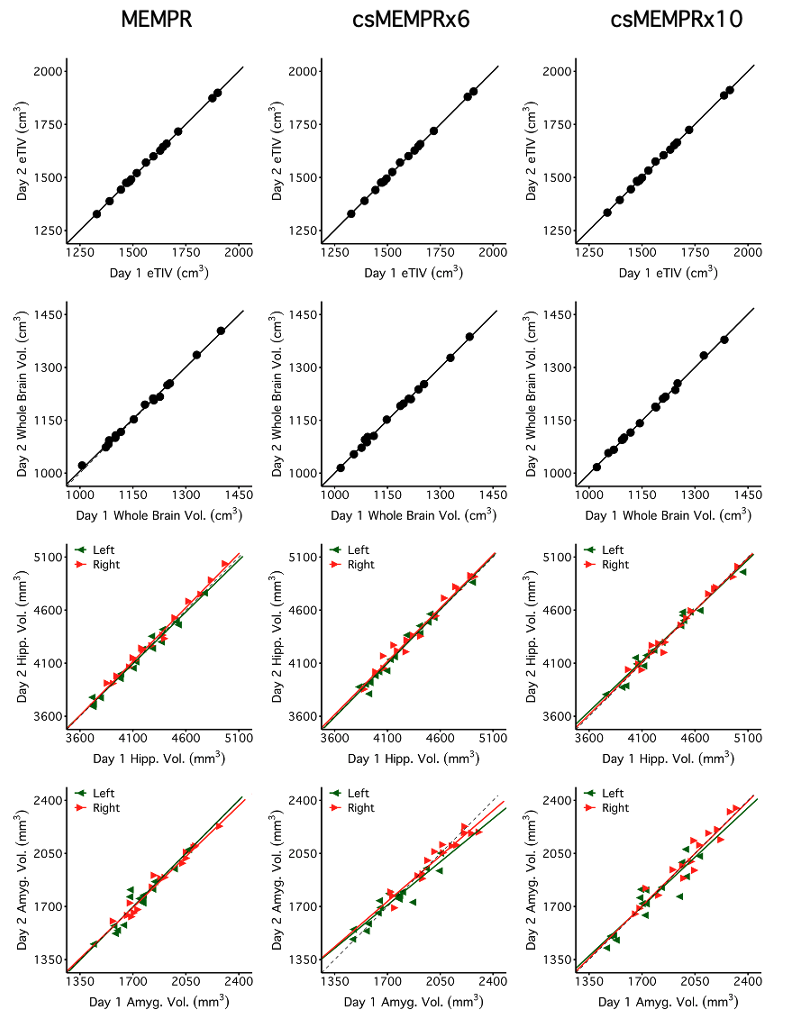
Figure 2: Test-retest reliability of volumetric estimates for MEMPR (358s), csMEMPRx6 (86s), and csMEMPRx10 (51s) scan types. eTIV, whole brain volume, hippocampus volume, and amygdala volume are displayed here, ordered by estimate stability across 2 sessions (e.g., days) in all 16 subjects.
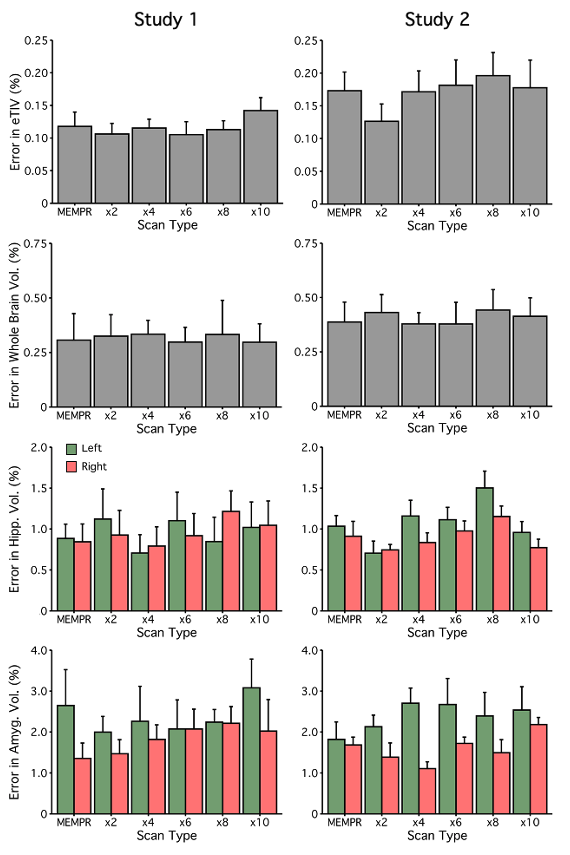
Figure 3: Percent error of eTIV, whole brain volume, hippocampus volume and amygdala volumes across scan types. Each scan type shows the mean and standard error across subjects.
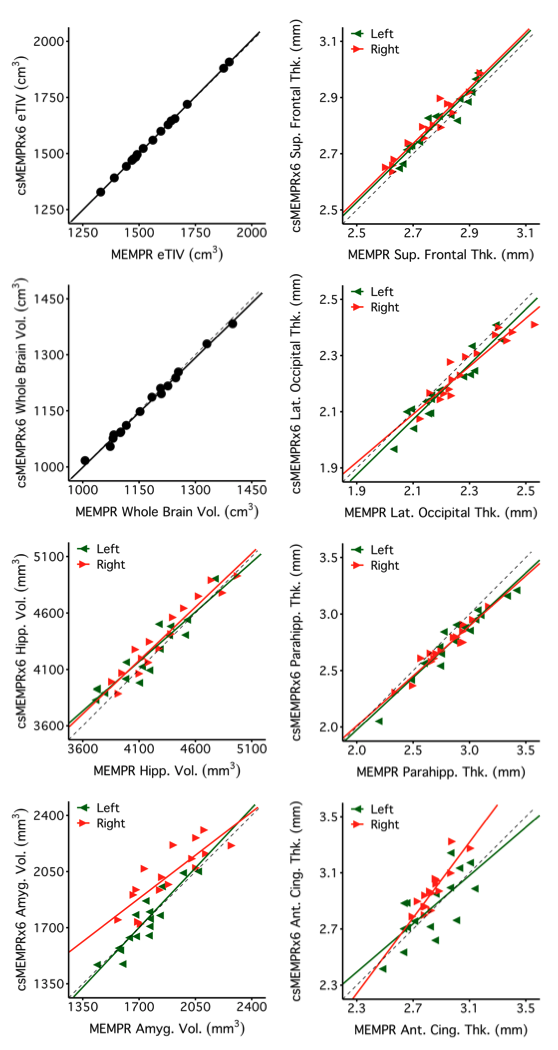
Figure 4: Volumetric and regional cortical thickness estimates, ordered by regional stability, are compared between 1.0 mm csMEMPRx6 (86s) to traditional MEMPR (358s) scan types.
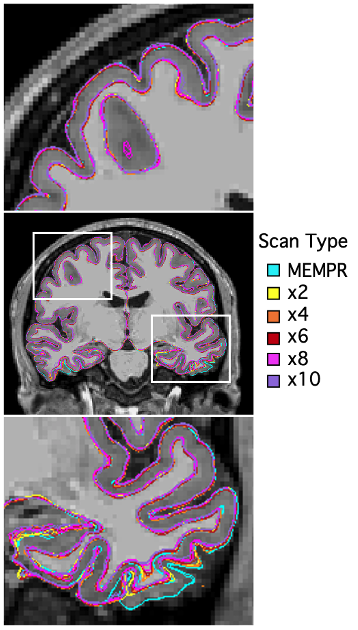
Figure 5: Example surface tracings from traditional MEMPR and cs variants displayed on MEMPR T1w for one subject from study 1 (12 independent T1w scans, 2 of each scan type).