2150
Structural 3DT1 scans with compressed sensing are suitable for cross-sectional brain volume measures in multiple sclerosis
Jonathan Stutters1, Marco Battiston1, Nevin John1, Thomas Williams1, Claudia Wheeler-Kingshott1,2,3, Frederik Barkhof1,4,5, Jeremy Chataway1, and Ferran Prados1,4,6
1NMR Research Unit, Queen Square MS Centre, Department of Neuroinflammation, UCL Queen Square Institute of Neurology, Faculty of Brain Sciences, University College London (UCL), London, United Kingdom, 2Department of Brain & Behavioural Sciences, University of Pavia, Pavia, Italy, 3Brain Connectivity Center Research Department, IRCCS Mondino Foundation, Pavia, Italy, 4Centre for Medical Image Computing (CMIC), Department of Medical Physics and Bioengineering, University College London (UCL), London, United Kingdom, 5Department of Radiology and Nuclear Medicine, VU University Medical Centre, Amsterdam, Netherlands, 6e-Health Centre, Universitat Oberta de Catalunya, Barcelona, Spain
1NMR Research Unit, Queen Square MS Centre, Department of Neuroinflammation, UCL Queen Square Institute of Neurology, Faculty of Brain Sciences, University College London (UCL), London, United Kingdom, 2Department of Brain & Behavioural Sciences, University of Pavia, Pavia, Italy, 3Brain Connectivity Center Research Department, IRCCS Mondino Foundation, Pavia, Italy, 4Centre for Medical Image Computing (CMIC), Department of Medical Physics and Bioengineering, University College London (UCL), London, United Kingdom, 5Department of Radiology and Nuclear Medicine, VU University Medical Centre, Amsterdam, Netherlands, 6e-Health Centre, Universitat Oberta de Catalunya, Barcelona, Spain
Synopsis
Optimizations of a 3D T1 sequence to take advantage of recent improvements to the hardware and software of a Philips Achieva MRI scanner allowed an acquisition to be performed in one third of the original time. We compared a number of cross-sectional volume measures, often used in research studies or as outcome measures of clinical trials, computed from images obtained with this protocol and the more widely used non-accelerated one. We find that cross-sectional volume measures are highly correlated between the accelerated and non-accelerated protocols, warranting the adoption of the accelerated one in clinical studies and clinical trials.
Introduction
Magnetic Resonance Imaging (MRI) is a valuable tool for the diagnosis and monitoring of a number of neurodegenerative diseases including multiple sclerosis (MS) and Alzheimer's disease. Cross-sectional measures of whole brain volume, grey-matter volume and the volume of structures such as the thalamus are used to characterize patient populations in clinical trials of treatments. Accurate volume measurements are usually performed using high-resolution isotropic 3D T1-weighted images. It is desirable to reduce the time required to acquire these images to improve both patient comfort and optimal efficiency in the utilization of the MRI scanner, while keeping sensitivity and accuracy of volume measurements.In this study, we investigate the effect of state-of-the-art acceleration techniques on a widely used clinical diagnostic sequence, such as the 3D T1-weighted sequence for MS "black-hole" lesion detection and delineation. In particular, we exploit the compressed sensing technique1 2 where data acquisition can be greatly accelerated through random k-space undersampling with minimal information loss, that is now available on most clinical scanners. We show that large scan time reductions through the use of compressed sensing are viable without affecting the measurement of regional brain volumes from the 3D-T1w protocol in a MS cohort.
Methods
A cohort of 53 patients with secondary-progressive MS (age not lower than 25 and not greater than 65 years, EDSS not lower than 4.0 and not greater than 6.5) was included in the study.In vivo imaging was performed on a 3T Philips Ingenia CX (Philips Healthcare, Best, The Netherlands) using a body coil for transmission and a 32-channel head coil for signal reception. Two 3D-T1w protocols were acquired and volumetric results compared: a standard version (T1wstd) of 6:34sec duration, and a fast version (T1wcomp) with compressed sensing acceleration of 1:55sec duration.
The standard 3D-T1w protocol was approved by a team of trained radiographers and neuroradiologists and has been extensively used in our unit as part of diagnostic protocol in research studies and clinical trials. It uses a fast gradient echo readout where a train of 225 gradient echoes are collected (excitation flip angle=8°, TR=7ms, TE= 3ms), following a global adiabatic inversion pulse (with a delay of 17.5ms from its centre to the first excitation), repeated every 3000ms. A field of view (FOV) of 256x256x176 mm³ is acquired at 1mm³ isotropic resolution, with SENSE acceleration factor RS = 2 (1.96) in the anterior-posterior (AP) direction and an oversampling factor of 1.28 in the right-left (RL) direction, for a total of 131 shots, and a duration of 6:34sec.
The fast version is built from the standard 3D-T1w protocol described above by simply replacing the SENSE acceleration with a compressed sensing acceleration factor RCS = 6. This produces a random undersampling of k-space with variable density in one of the phase encoding directions, which enables a reduction of the number of shots to 38, for a total protocol duration of 1:55sec. All the other sequence parameters remain unvaried compared to the standard protocol, other than a higher slice oversampling factor of 1.4.
The image analysis pipeline was fully automated and identical for images acquired with the T1wstd and T1wcomp protocols. Images were first bias-corrected using the N4 algorithm.3 Then, images were segmented using the Geodesic Information Flows (GIF) algorithm4 into grey-matter, white-matter and cerebro-spinal fluid masks. Lesions were identified using BaMoS5 and filled using a patch-based technique6. The lesion-filled images were then re-segmented for better accuracy as per our standard pipeline in MS studies. Brain tissue volume, normalised for subject head size, was estimated with SIENAX7, part of FSL8. Regional brain volumes were measured from the parcellation provided by GIF. Here we report a selection of volume measures used in clinical trials, e.g. the MSSMART study, 9 which used brain atrophy calculated from 3D-T1 images as its primary outcome measure.
Statistical analysis was carried out in R.10 We calculated Pearson’s correlation coefficients, carried out a linear regression and performed a paired T-test between all measures. Bland-Altman plots and limit of agreement calculations were performed with the blandr package.11
Results and discussion
There is a high level of agreement between all measures taken from the standard and accelerated scans using compressed-sense (see figures 1 and 3). Correlation is ≥ 0.99 for all volumes. Bias in the normalized brain volume lay within one standard error of zero indicating that the compressed-sense images did not result in a significant shift in the measured volume compared to the standard sequence (see figures 2 and 4). Statistically significant bias was observed in the cortical grey matter, sub-cortical grey matter, caudate and cuneus volumes (see figure 2). Our examination of the images and segmentations leads us to believe that this bias was due to the lower signal to noise ratio in the compressed sense images.Conclusion
Use of compressed-sensing for 3D-T1 acquisitions offers significant scan time reductions while producing outcomes that are very highly correlated with those from a standard 3D-T1 protocol for volumetric analysis outcomes commonly used in a clinical-trial setting.Acknowledgements
The UK MS Society and International MS Society and Rosetree Trust. The UCL-UCLH Biomedical Research Centre for ongoing support. CGWK receives funding from ISRT, Wings for Life and the Craig H. Neilsen Foundation (the INSPIRED study), from the MS Society (#77), Wings for Life (#169111), Horizon2020 (CDS-QUAMRI, #634541). FP is a non-clinical Postdoctoral Guarantors of Brain fellow. FB is a board member for Roche, Biogen, Bayer AG and Merck. JC provides consultancy for Azadyne, Biogen, Celgene, MedDay Pharma, Merck and Roche.References
- M. Lustig, D. L. Donoho, J. M. Santos and J. M. Pauly, "Compressed Sensing MRI," in IEEE Signal Processing Magazine, vol. 25, no. 2, pp. 72-82, March 2008, doi: 10.1109/MSP.2007.914728.
- L. Geerts-Ossevoort, E. de Weerdt, A. Duijndam, G. van IJPeren, H. Peeters, M. Doneva, M. Nijenhuis, A. Huang, “Compressed SENSE: Speed done right. Every time.”, 2018. Philips Healthcare, Best, The Netherlands.
- Tustison, N. J., Avants, B. B., Cook, P. A., Zheng, Y., Egan, A., Yushkevich, P. A., & Gee, J. C. (2010). N4ITK: improved N3 bias correction. IEEE Transactions on Medical Imaging, 29(6), 1310–1320. https://doi.org/10.1109/TMI.2010.2046908
- Cardoso, M. J., Modat, M., Wolz, R., Melbourne, A., Cash, D., Rueckert, D., & Ourselin, S. (2015). Geodesic Information Flows: Spatially-Variant Graphs and Their Application to Segmentation and Fusion. IEEE Transactions on Medical Imaging, 34(9), 1976–1988. https://doi.org/10.1109/TMI.2015.2418298
- Sudre, C., Cardoso, M. J., Bouvy, W., Biessels, G., Barnes, J., & Ourselin, S. (2015). Bayesian model selection for pathological neuroimaging data applied to white matter lesion segmentation. Medical Imaging, IEEE Trans. On (TMI), 34(c), 1–1. https://doi.org/10.1109/TMI.2015.2419072
- Prados, F., Cardoso, M. J., Kanber, B., Ciccarelli, O., Kapoor, R., Gandini Wheeler-Kingshott, C. A. M., & Ourselin, S. (2016). A multi-time-point modality-agnostic patch-based method for lesion filling in multiple sclerosis. NeuroImage, 139, 376–384. https://doi.org/10.1016/J.NEUROIMAGE.2016.06.053
- Hemond, C. C., Chu, R., Tummala, S., Tauhid, S., Healy, B. C., & Bakshi, R. (2018). Whole-brain atrophy assessed by proportional- versus registration-based pipelines from 3T MRI in multiple sclerosis. Brain and Behavior, 8(8). https://doi.org/10.1002/brb3.1068.
- Smith, S. M., Jenkinson, M., Woolrich, M. W., Beckmann, C. F., Behrens, T. E. J., Johansen-Berg, H., Bannister, P. R., De Luca, M., Drobnjak, I., Flitney, D. E., Niazy, R. K., Saunders, J., Vickers, J., Zhang, Y., De Stefano, N., Brady, J. M., & Matthews, P. M. (2004). Advances in functional and structural MR image analysis and implementation as FSL. NeuroImage, 23(SUPPL. 1), S208–S219. https://doi.org/10.1016/j.neuroimage.2004.07.051
- Chataway, J., De Angelis, F., Connick, P., Parker, R. A., Plantone, D., Doshi, A., John, N., Stutters, J., MacManus, D., Prados Carrasco, F., Barkhof, F., Ourselin, S., Braisher, M., Ross, M., Cranswick, G., Pavitt, S. H., Giovannoni, G., Gandini Wheeler-Kingshott, C. A., Hawkins, C., … McLean, B. (2020). Efficacy of three neuroprotective drugs in secondary progressive multiple sclerosis (MS-SMART): a phase 2b, multiarm, double-blind, randomised placebo-controlled trial. The Lancet Neurology, 19(3), 214–225. https://doi.org/10.1016/S1474-4422(19)30485-5
- R Core Team (2019). R: A language and environment for statistical computing. R Foundation for Statistical Computing, Vienna, Austria. URL https://www.R-project.org/
- Datta, D. (2017). blandr: a Bland-Altman Method Comparison package for R. Zenodo. <doi:10.5281/zenodo.824514> https://github.com/deepankardatta/blandr
Figures
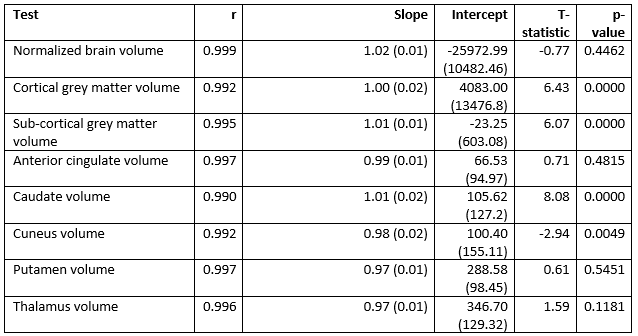
Pearson’s correlations
(r), linear regressions (slope, intercept) and t-tests (T-statistic, p-value)
between volumetric measures obtained using T1wstd and T1wcomp
protocols
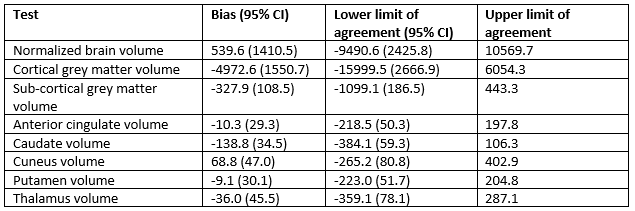
Bias, lower and upper limits of agreement
between volumetric measures obtained using the T1wstd and T1wcomp
protocols. Confidence interval for upper
limit of agreement is equal to that of lower limit of agreement.
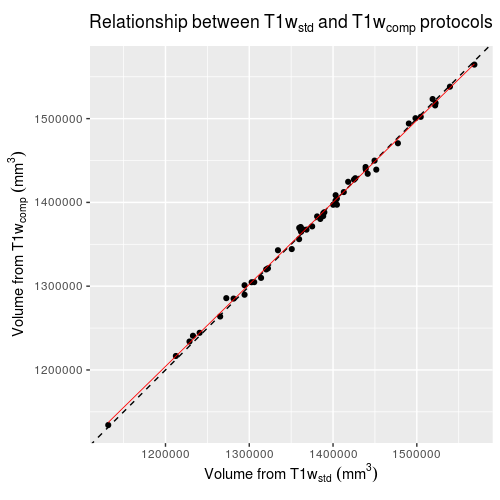
Comparison of
normalized whole brain volume obtained from SIENAX using T1wstd and
T1wcomp sequences. Points
show individual subjects. Dotted line
shows slope = 1, intercept = 0, red line shows linear regression between the
two volumes.
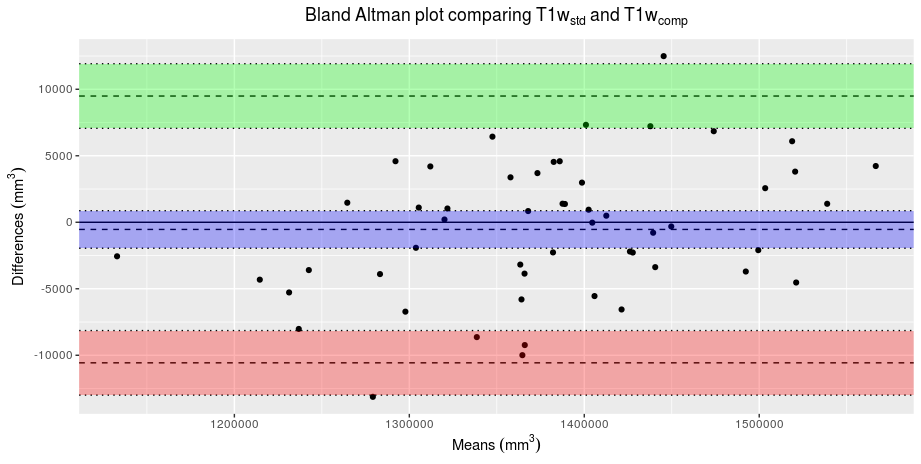
Bland-Altmann plot comparing whole brain volumes obtained
from SIENAX using T1wstd and T1wcomp sequences. Points show individiual subjects. Green and red shaded areas show 95%
confidence intervals around the upper and lower limits of agreement. Blue shaded area shows the 95% confidence
interval around the bias.