2149
Comparison of cortical gray matter and subcortical gray matter using double diffusion encoding1Department of Radiology, Juntendo University School of Medicine, Tokyo, Japan, 2Department of Radiology, Graduate School of Medicine, The University of Tokyo, Tokyo, Japan, 3Department of Radiology, Toho University Omori Medical Center, Tokyo, Japan, 4Advanced MRI development PJ Team, Canon Medical Systems corp., Kanagawa, Japan
Synopsis
Cortical and subcortical gray matter (GM) are histologically different and have different DTI values. In this study, we measured the microscopic fractional anisotropy (μFA) of cortical and subcortical GM in healthy subjects using double-diffusion encoding. We confirmed that the μFA and fractional anisotropyof subcortical GM were higher than those of cortical GM. Additionally, the μFA in the globus pallidus was high than in the striatum. Myelin was higher in subcortical GM than in cortical GM, and it was higher in globus pallidus than in the striatum; therefore, higher μFA may reflect these histological features.
INTRODUCTION:
Cortical and subcortical gray matter (GM) differ in their histology, including the type and number of nerve cell bodies and the layered structure of cortical GM.1 A few studies have examined the differences between cortical and subcortical GM using magnetic resonance imaging (MRI) and acknowledged the differences in fractional anisotropy (FA) and iron deposition, which are consistent with the results expected from the known properties of the histology.2,3 Double-diffusion encoding (DDE) is an imaging technique that has attracted much attention in recent years for its application to in vivo imaging methods. Using DDE, we can obtain microscopic fractional anisotropy (μFA) maps and evaluate anisotropy in voxels, and clinical application is expected.4,5,6 There is a paucity of studies that have measured μFA targeting the cortex of the brains of healthy individuals.7 The possibility that higher myelin content contributes to higher FA and microscopic anisotropy (μA) is known.8,9 This study aimed to obtain the FA, μFA, and myelin‐sensitive (T1w/T2w) images10 of GM in healthy subjects. We examined whether there were differences in these values between cortical and subcortical GM, and within subcortical GM (putamen, caudate nucleus, and globus pallidus) against the background of histological differences such as difference in the amount of myelin.METHODS:
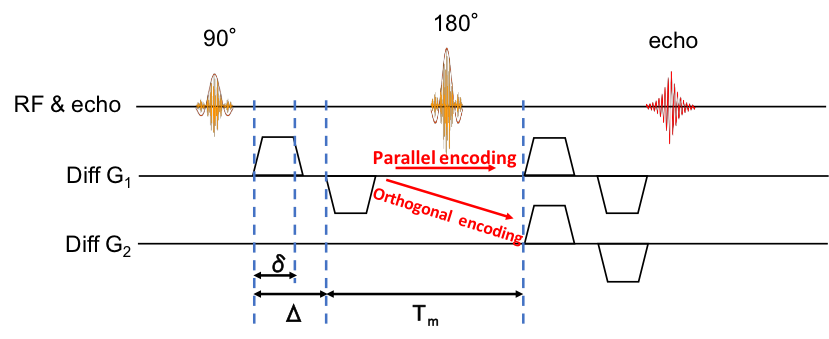
Study Participants: We obtained MRI images of three healty volunteers (one man and two women, aged 25, 39, and 40, respectively). Images were acquired on a clinical scanner (Vantage Galan 3T/ZGO, Canon Medical Systems Corp.) using a DDE-Single-shot 2D SE-EPIsequence (Fig.1). Acquisition parameters were as follows: TR/TE = 12,000 ms/116 ms, FOV = 21.4 cm × 21.4 cm, matrix = 144 × 144, slice thickness/gap = 2.5 mm/0 mm, and b-value = 0 and 2,000 s/mm2 (for the entire DDE). The parameters of the diffusion time were δ = 16 ms, Δ = 19 ms, and mixing time = 27 ms. The diffusion encoding pattern was 12 parallel and 36 (12×3) orthogonal diffusion-encoding pairs.4 The diffusion data were pre-processed using FSL [https://fsl.fmrib.ox.ac.uk/fsl/fslwiki/] to correct for susceptibility-induced distortions and eddy currents. FA was calculated using the dtifit of FSL.μFA Theory: The DDE sequence applies diffusion encoding twice along two orientations before data acquisition. μFA can be calculated as follows:
$$$\mu F A=\sqrt{\frac{3}{2} \frac{\mu A}{\mu A+(3 / 5) M D^{2}}}$$$
where MD is the mean diffusivity and μA2 and ε are defined as follows4,11:
$$$\mu A^{2}=\frac{\varepsilon}{\Delta}$$$
$$$\epsilon=\left[\log \left(\frac{1}{N_{\text {para}}} \Sigma S_{\|}\right)-\log \left(\frac{1}{N_{\text {ortho}}} \Sigma S_{\perp}\right)\right] q^{-4}$$$
where S∥ is the signal with parallel diffusion encoding, S⊥ is the signal with orthogonal diffusion encoding, Npara is the number of parallel diffusion encodings, and Northo is the number of orthogonal diffusion encodings.
Three-dimensional T1-weighted (T1w) images were obtained using a spoiled gradient-recalled sequence, and T2-weighted(T2w) images were obtained using a fast-spin echo sequence. T2w images were registered with T1w images, and the T1w/T2w ratio was calculated. The T1w/T2w ratio correlated with myelin density.10 We extracted cortical and subcortical GM regions using the Desikan-Killiany atlas from FreeSurfer. We calculated the mean FA, μFA, and T1w/T2w ratios for the entire cortical GM area, caudate nucleus, putamen, and globus pallidus. Statistical analysis was performed using Student t-test for FA, μFA, and T1w/T2w ratios between cortical and subcortical GM area and within subcortical GM.
RESULTS:
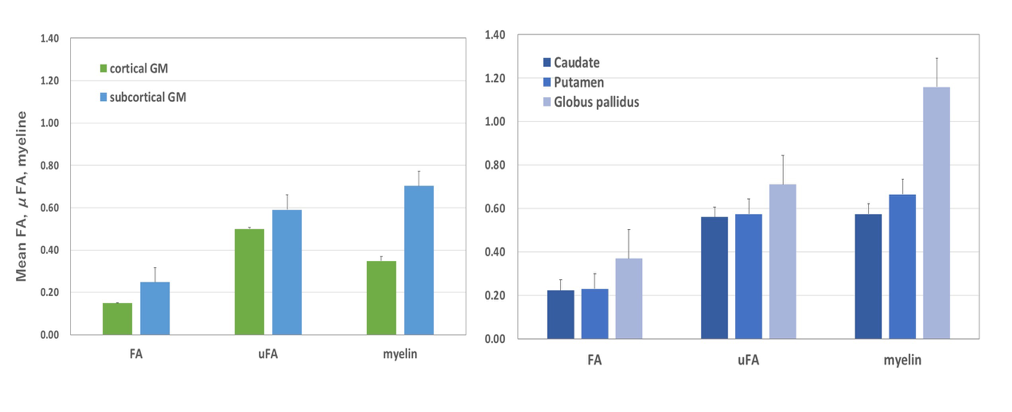
Subcortical GM showed higher FA, μFA, and T1w/T2w ratios than cortical GM in all regions (Fig.2). The globus pallidus showed higher FA, μFA, and T1w/T2w ratio than the putamen and caudate nucleus (Fig.2).DISCUSSION:
We showed that FA, μFA, and myelin were different between cortical and subcortical GM. Our results were consistent with those of previous reports wherein subcortical GM had higher FA and myelin than cortical GM.2,12 While µFA was also high in the subcortical GM, it is possible that this reflects differences in myelin between these regions. Lampinen et al. reported that μA values were higher in regions expected to feature a higher myelin content, but they do not have result for subcortical GM. Other factors may include differences in cell density and the effect of iron.3 Both FA and μFA were higher in the globus pallidus than in the striatum. Dendrites of most neurons in the striatum (96%) were covered with dendritic spines,1 allowing water to diffuse freely. The globus pallidus is known for its high myelin density–with some fibers-forming bundles13–restricting water movement, which may have higher FA and μFA. Additionally, pallidum has exceptionally high iron deposition, which may affect FA and μFA. Many degenerative diseases are known to have the basal ganglia as their primary locus, including Parkinson's disease. The DTI and μFA values obtained in healthy subjects, such as those in this study, can be compared with patients to deepen our understanding of disease pathophysiology and may lead to early diagnosis in the future. For example, a study has found decreased FA in the putamen in early Parkinson's patients.14CONCLUSION:
We showed that DDE could detect differences between cortical and subcortical GM. In the future, by adding more data from healthy individuals, we may be able to understand the histological characteristics of these regions better and apply them to the early prediction of diseases wherein the basal ganglia is the primary locus.Acknowledgements
No acknowledgement found.References
1.Parent A, Hazrati LN. Functional anatomy of the basal ganglia. I. The cortico-basal ganglia-thalamo-cortical loop. Brain Res Brain Res Rev. 1995;20(1):91-127.
2. Munivenkatappa A, Bagepally BS, Saini J, Pal PK. In vivo Age-related Changes in Cortical, Subcortical Nuclei, and Subventricular Zone: A Diffusion Tensor Imaging Study. Aging Dis. 2012;4(2):65-75.
3. Rulseh AM, Keller J, Tintěra J, Kožíšek M, Vymazal J. Chasing shadows: what determines DTI metrics in gray matter regions? An in vitro and in vivo study. J Magn Reson Imaging. 2013;38(5):1103-1110.
4. Yang G, Tian Q, Leuze C, Wintermark M, McNab JA. Double diffusion encoding MRI for the clinic. Magn Reson Med. 2018;80(2):507-520.
5. Henriques RN, Palombo M, Jespersen SN, Shemesh N, Lundell H, Ianuş A. Double diffusion encoding and applications for biomedical imaging [published online ahead of print, 2020 Nov 1]. J Neurosci Methods. 2020;108989.
6. Szczepankiewicz F, Lasič S, van Westen D, et al. Quantification of microscopic diffusion anisotropy disentangles effects of orientation dispersion from microstructure: applications in healthy volunteers and in brain tumors. Neuroimage. 2015;104:241-252.
7. Lawrenz M, Finsterbusch J. Detection of microscopic diffusion anisotropy in human cortical gray matter in vivo with double diffusion encoding. Magn Reson Med. 2019;81(2):1296-1306.
8. Jiang W, Wu Q, Zhou C, Zhao Z, Tan Y. Gray matter nuclei damage in acute carbon monoxide intoxication assessed in vivo using diffusion tensor MR imaging. Radiol Med. 2020;125(1):80-86.
9. Lampinen B, Szczepankiewicz F, Novén M, et al. Searching for the neurite density with diffusion MRI: Challenges for biophysical modeling. Hum Brain Mapp. 2019;40(8):2529-2545.
10. Glasser MF, Van Essen DC. Mapping human cortical areas in vivo based on myelin content as revealed by T1- and T2-weighted MRI. J Neurosci. 2011;31(32):11597-11616.
11. Jespersen SN, Lundell H, Sønderby CK, Dyrby TB. Orientationally invariant metrics of apparent compartment eccentricity from double pulsed field gradient diffusion experiments [published correction appears in NMR Biomed. 2014 Jun;27(6):738]. NMR Biomed. 2013;26(12):1647-1662.
12. Hagiwara A, Hori M, Kamagata K, et al. Myelin Measurement: Comparison Between Simultaneous Tissue Relaxometry, Magnetization Transfer Saturation Index, and T1w/T2w Ratio Methods. Sci Rep. 2018;8(1):10554.
13. Yelnik J, Percheron G, François C. A Golgi analysis of the primate globus pallidus. II. Quantitative morphology and spatial orientation of dendritic arborizations. J Comp Neurol. 1984;227(2):200-213.
14. Surova Y, Nilsson M, Lampinen B, et al. Alteration of putaminal fractional anisotropy in Parkinson's disease: a longitudinal diffusion kurtosis imaging study. Neuroradiology. 2018;60(3):247-254.
Figures