2148
Volume-based brain morphometry and T1 mapping: comparison between MP2RAGE accelerated by parallel imaging and compressed sensing at 3 Tesla1Department of Neuroradiology, Henri Mondor Universitary Hospital, AP-HP, Créteil, France, 2Faculty of Medicine, Université Paris Est Créteil, Créteil, France, 3Siemens Healthcare SAS, Saint-Denis, France, 4Advanced Clinical Imaging Technology, Siemens Healthcare AG, Lausanne, Switzerland, 5Department of Radiology, Lausanne University Hospital and University of Lausanne, Lausanne, Switzerland, 6Signal Processing Laboratory (LTS 5), École Polytechnique Fédérale de Lausanne (EPFL), Lausanne, Switzerland
Synopsis
MP2RAGE is 3D T1-weighted MR sequence used for high GM/WM contrast imaging, enabling morphometry, brain segmentation and T1 mapping. Despite these advantages, it suffers from long acquisition times, hindering broad clinical adoption. In this work, brain data obtained from 29 patients with various pathologies using the GRAPPAx3-accelerated reference (8:22 min) and a new compressed-sensing version (4:00 min) of the MP2RAGE were compared with respect to brain volumetry and T1 mapping results. Very high agreement was observed between the two versions. These results pave the way for a broader use of CS-MP2RAGE, eventually enabling its clinical use.
Introduction
Quantitative MR imaging has great potential for wide clinical adoption as the maps obtained are, to a large extent, independent from the MR system used. In contrast to conventional imaging, this enables the generation of normative databases for follow-up and even detection of pathology. In this context, the Magnetization-prepared 2 rapid acquisition gradient-echo (MP2RAGE1) sequence, an extension to MP-RAGE, provides both an anatomical T1 weighted 3D volume and a T1 map from one scan, showing better2 or similar3 automated segmentation results in normal brain compared to MP-RAGE. Consequently, this sequence provides numerous perspectives in neuroradiology, such as automated brain atrophy evaluation in degenerative diseases, or quantitative tissue microstructure analysis based on the T1 mapping4. However, it still suffers from long acquisition times (>7-8min for isotropic millimetric resolution, even with 3-fold GRAPPA acceleration) which hinders its clinical adoption5. Compressed sensing (CS) is an acceleration technique in MRI6 that follows a mathematical concept exploiting an incoherent sampling pattern, the prior knowledge of a sparse signal, and a non-linear reconstruction to approximate the image. In this framework, a flexible CS-compatible readout trajectory based on a Cartesian phyllotaxis pattern was integrated in the MP2RAGE sequence and validated in healthy volunteers7. This work aims to compare automated segmentation and T1 mapping results obtained by a CS-accelerated MP2RAGE sequence with those from the GRAPPA-accelerated reference in a population of patients presenting with typical pathologies seen in clinical routine.Methods
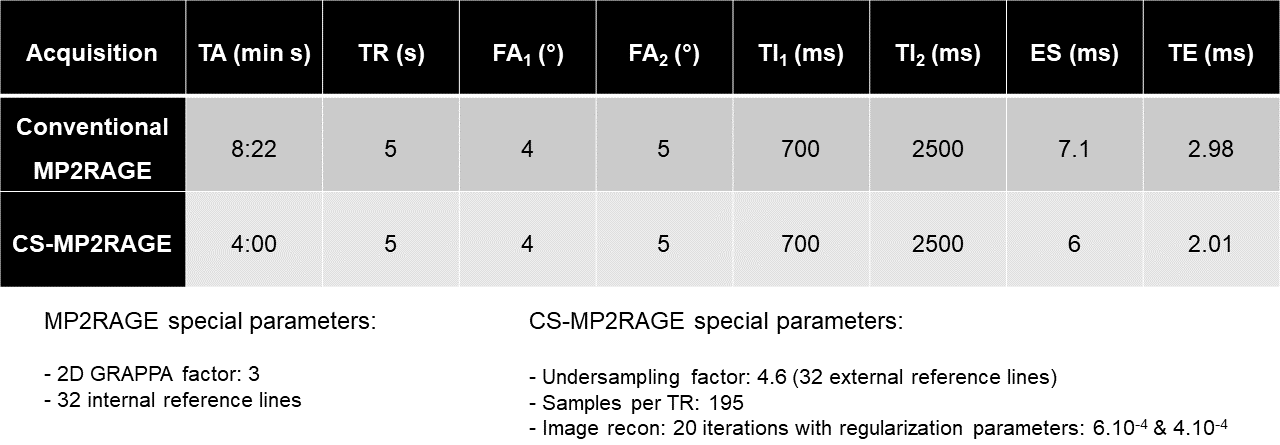
Twenty-nine patients (17f, mean age: 55 yo) affected by diverse pathologies were prospectively examined at 3T (MAGNETOM Skyra, Siemens Healthcare , Erlangen, Germany) between February and March 2020. All patients underwent brain MRI using GRAPPA-accelerated and CS-accelerated MP2RAGE acquisitions. Sequence parameters were largely synchronized in the 1mm isotropic resolution and FOV=256x240x224mm3 acquisitions (other relevant parameters are given in Table 1). Three patients underwent two CS-MP2RAGE acquisitions in the same session to assess reproducibility. Full brain segmentations were automatically generated using the MorphoBox prototype8. Mean T1 values and volumes were computed for each region. Segmentation masks were visualized using ITK-SNAP (U Penn, PA, USA). Differences in volumetric measurements were assessed with Lin's concordance correlation coefficients and displayed using Bland Altman plots. Histograms and scatter plots were drawn for mean T1 values comparisons. The statistical significance of the difference from the zero median in relative volumetric/T1 values differences was tested using the Wilcoxon signed-rank test, as the differences were not expected to be normally distributed. False discovery rate (FDR) correction was used to correct for multiple comparisons.Results
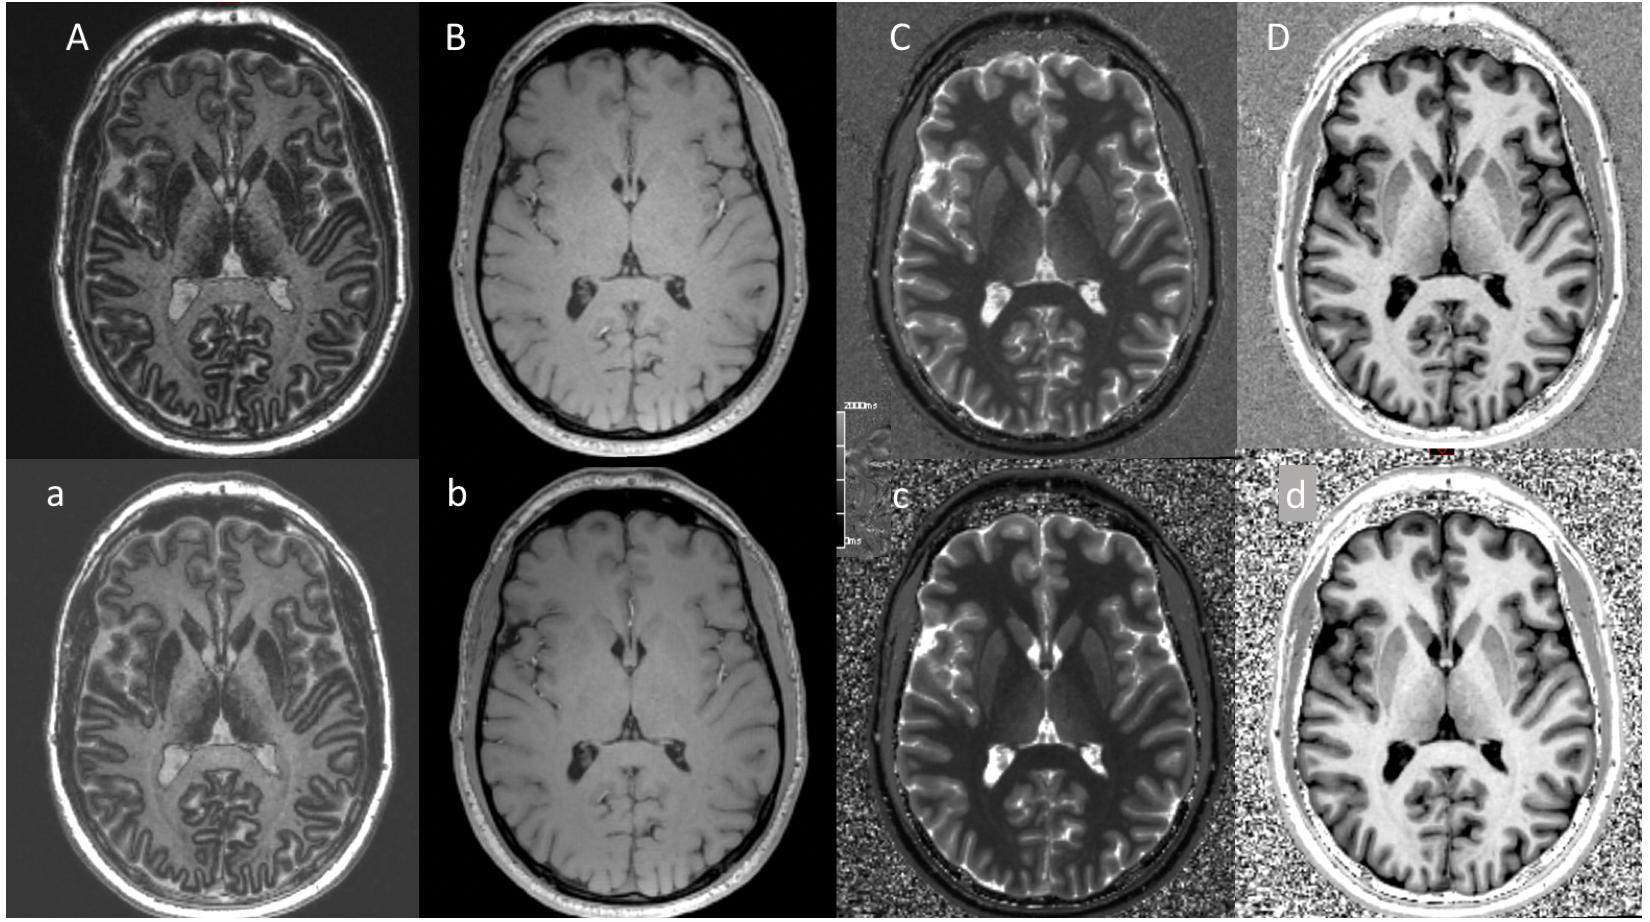
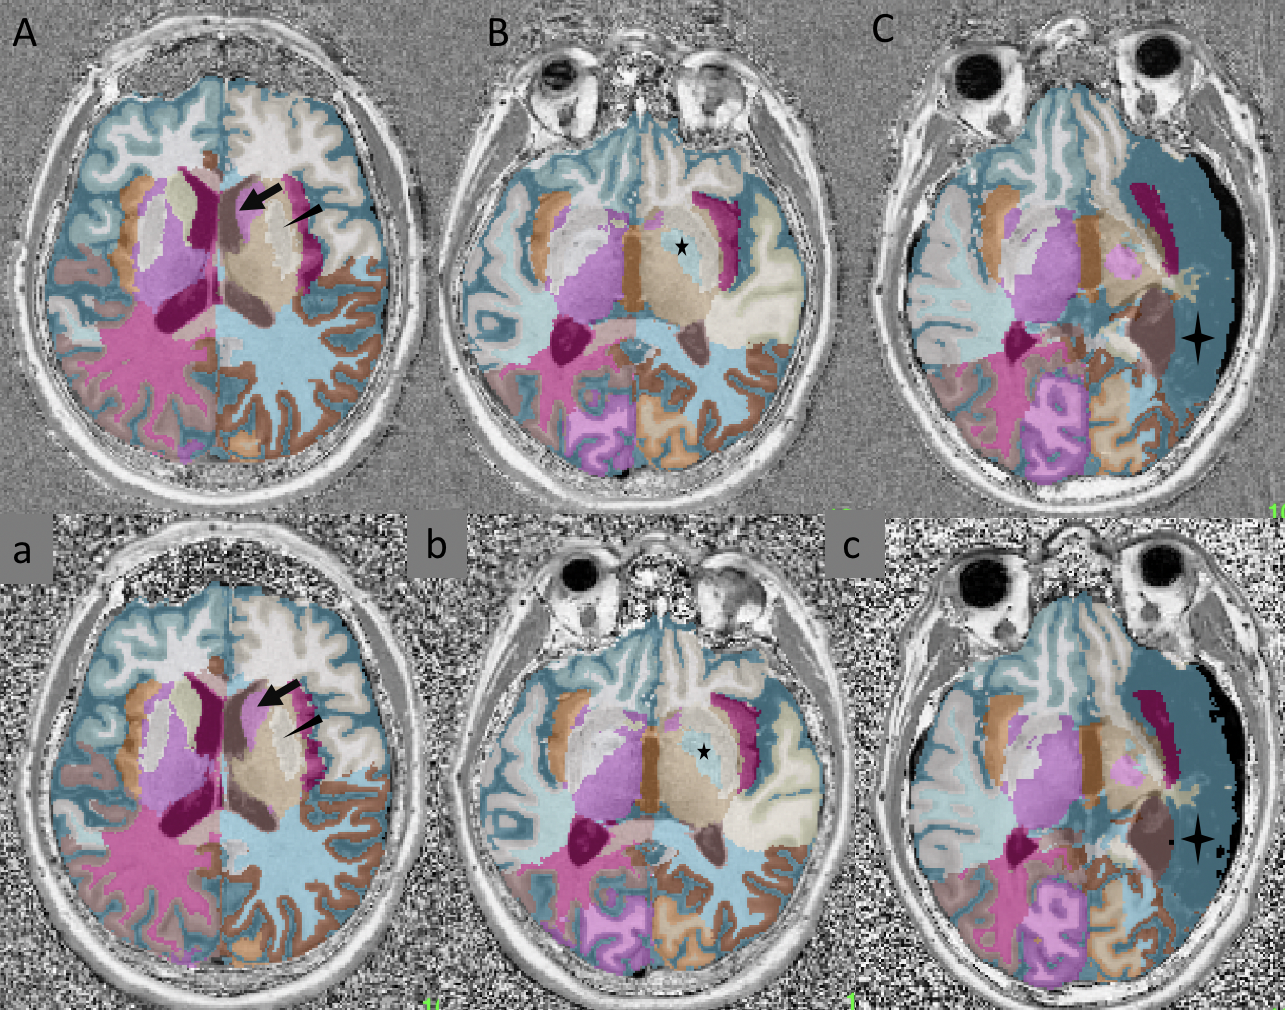
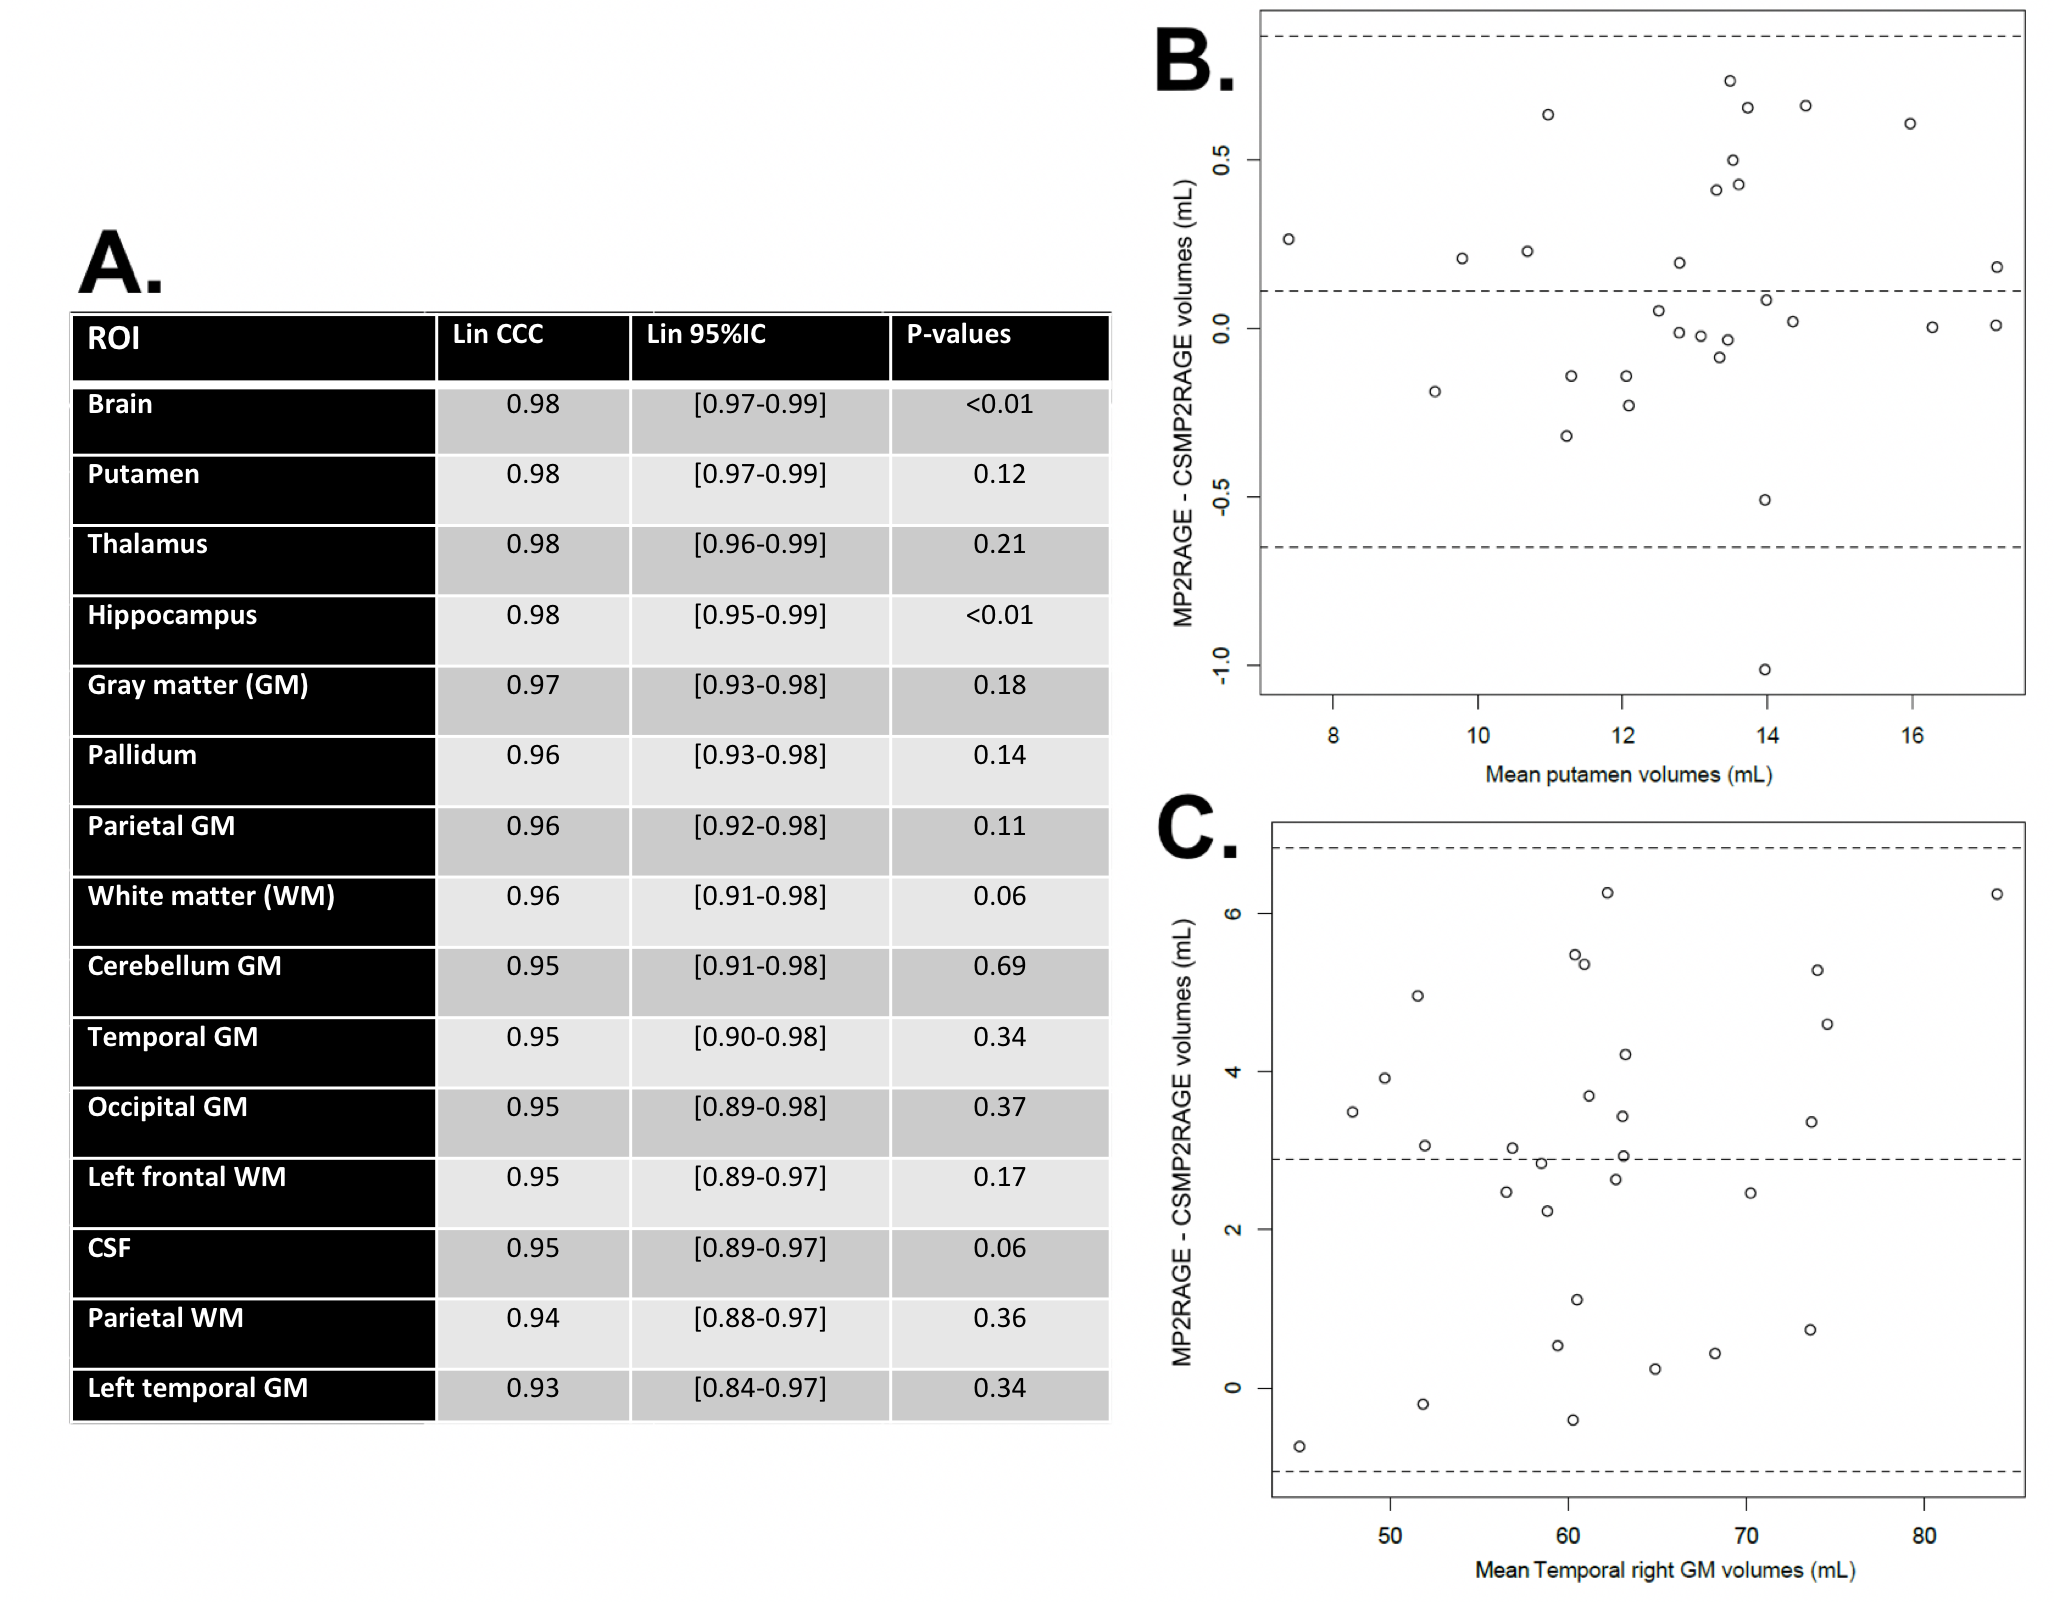
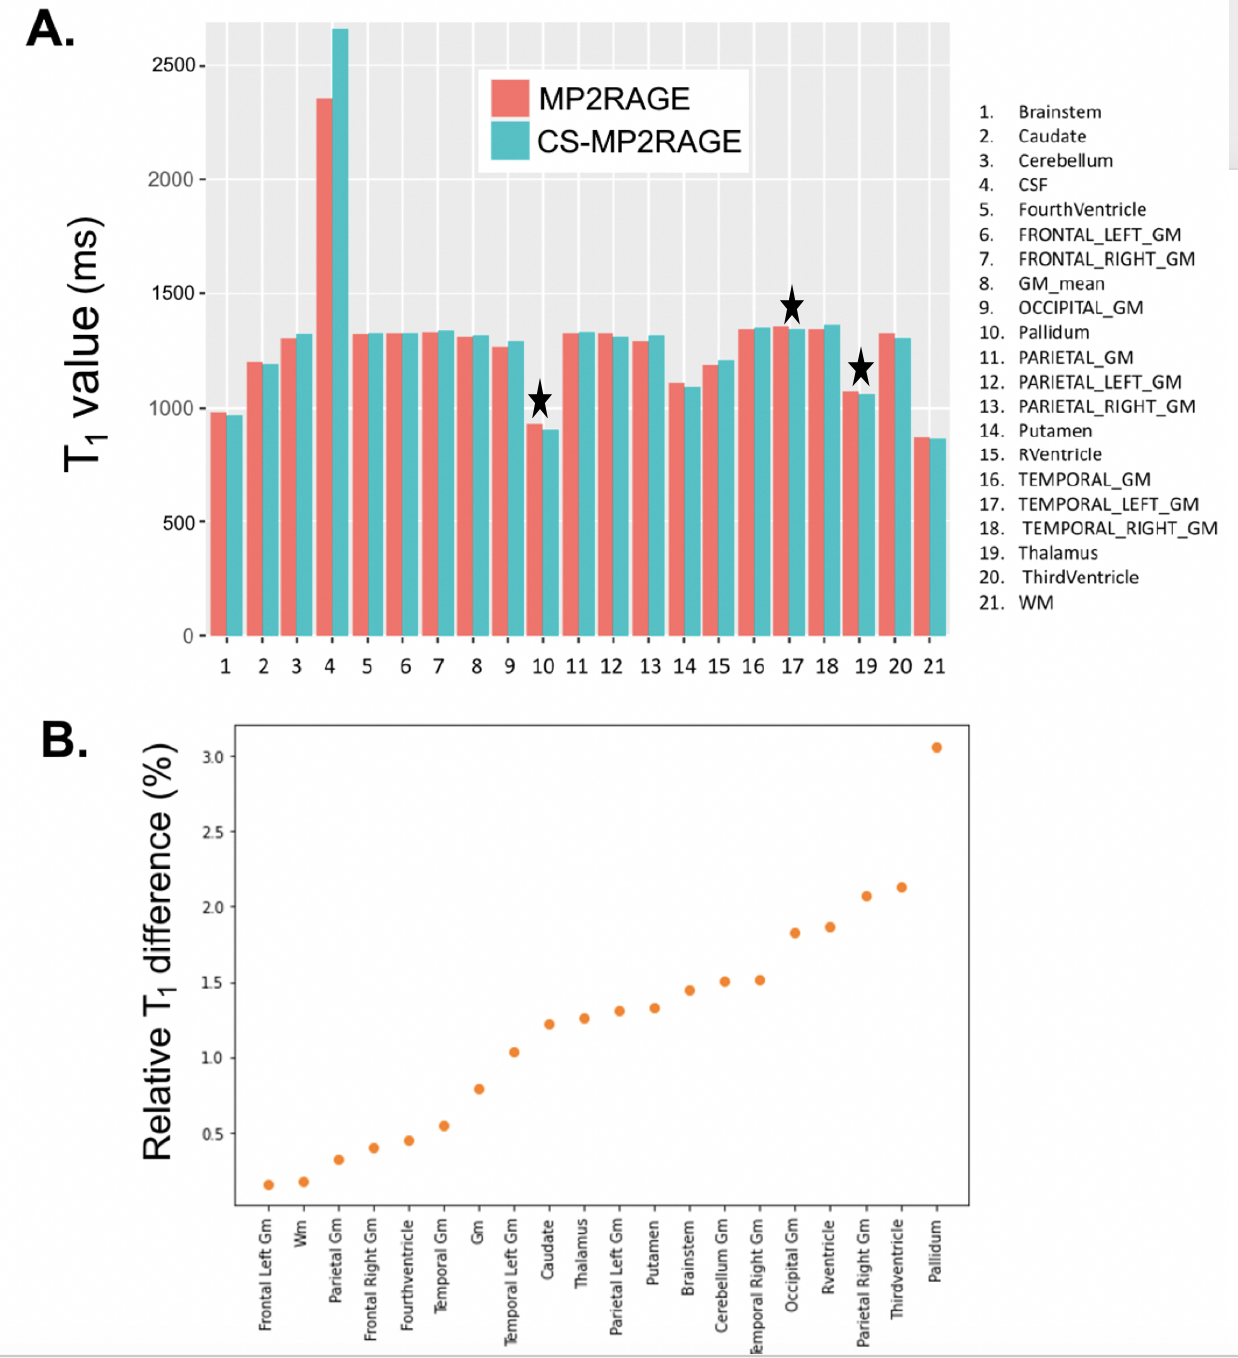
Figures 2 and 3 show example images and automated brain segmentations obtained from the reference and CS-MP2RAGE. Visual image quality of CS-MP2RAGE was considered suitable for clinical diagnosis by two neuroradiologists (with respectively 2 and more than 30 years experience), which is consistent with recent radiological literature9. Visual analysis of three main structures (putamen, pallidum, caudate) did not show significant errors in segmentation masks, with consistency between techniques reported even for severe brain abnormalities. For volumetric data comparison, Lin’s concordance correlation values and Bland Altman plots for best concordance, obtained for putamen segmentation (0.98 [IC95%: 0.97-0.99]); and worst concordance, obtained for temporal gray matter (0.93 [IC95%: 0.84-0.97]) are reported in Figure 4. Absolute mean T1 values and relative T1 mapping differences are illustrated in Figure 5. Except for CSF, relative differences under 3% for mean T1 values were observed for all brain regions and were significant (p<0.01) for thalamus, pallidum and GM in left temporal.Discussion
The fact that CS-MP2RAGE is significantly shorter compared to the reference MP2RAGE also contributes to reduce motion sensitivity, which is especially relevant for neurologically impaired patients. Brain segmentation quality was considered high, with excellent consistency for volume calculation in most anatomical regions of interest. The worst performance was seen in temporal gray matter, a small brain region known to be sharp and tortuous. Still, the obtained absolute differences were under 5%, which was considered clinically acceptable. T1 values obtained with CS-MP2RAGE were in strong agreement with the reference sequence, and with the literature10. The strongest significant difference in pallidum (3% relative to mean value) could likely be explained by anatomical factors (proximity with internal capsule) and potential little infarcts with CSF replacement. CSF T1 measurements can be ignored, as the prescribed MP2RAGE parametrizations were not adapted to measure T1 values above 2s in both cases.Conclusion
CS-accelerated MP2RAGE successfully provided reliable volumetric assessment and T1 mapping in the brain compared to the reference MP2RAGE accelerated by parallel imaging, which can inform the decision to use it in a clinical context, with multiple neuroradiological applications.Acknowledgements
No acknowledgement found.References
1Marques JP, Kober T, Krueger G, et al. MP2RAGE, a self bias–field corrected sequence for improved segmentation and T1-mapping at high field. Neuroimage 2010;49:1271–1281.
2O'Brien KR, Kober T, Hagmann P, et al. Robust T1-weighted structural brain imaging and morphometry at 7T using MP2RAGE. PLoS One 2014;9:e99676.
3Alonso J, Pareto D, Alberich M, Kober T, Maréchal B, Lladó X, Rovira A. Assessment of brain volumes obtained from MP-RAGE and MP2RAGE images, quantified using different segmentation methods. Magn Reson Mater Phys Biol Med 2020;33, 757-767.
4Simioni S, Amarù F, Bonnier G, et al. MP2RAGE provides new clinically-compatible correlates of mild cognitive deficits in relapsing-remitting multiple sclerosis. J Neurol. 2014;261:1606–1613.
5Trotier AJ, Rapacchi S, Faller TL, Miraux S, Ribot EJ. Compressed-Sensing MP2RAGE sequence: Application to the detection of brain metastases in mice at 7T. Magn Reson Med 2019;81, 551–559.
6Lustig M, Donoho D, Pauly JM. Sparse MRI: The application of compressed sensing for rapid MR imaging. Magn Reson Med. 2007;58:1182–1195.
7Mussard E, Hilbert T, Forman C, Meuli R, Thiran J, Kober T. Accelerated MP2RAGE imaging using Cartesian phyllotaxis readout and compressed sensing reconstruction. Magn Reson Med 2020;84:1881–1894.
8Schmitter, D., Roche, A., Maréchal, B., Ribes, D., Abdulkadir, A., Bach-Cuadra, M., Krueger, G. (2015). An evaluation of volume-based morphometry for prediction of mild cognitive impairment and Alzheimer’s disease. NeuroImage: Clinical, 7(1), 7–17.
9Vranic JE, Cross NM, Wang Y, Hippe DS, de Weerdt E, Mossa-Basha M. Compressed Sensing–Sensitivity Encoding (CS-SENSE) Accelerated Brain Imaging: Reduced Scan Time without Reduced Image Quality. Am J Neuroradiol 2019;40, 92–98.
10Bojorquez J, Bricq S, Acquitter C, Brunotte F, Walker PM, Lalande A. What are normal relaxation times of tissues at 3 T? Magn Reson Imag 2017;35, 69-80.
Figures