2147
Essential tremor: Structural Characterization with 3-T MR Imaging1Huaxi MR Research Center (HMRRC), West China Hospital of Sichuan University, sichuan, China, 2Department of Psychiatry and Behavioral Neuroscience, University of Cincinnati, Cincinnati, OH, United States, 3Huaxi MR Research Center (HMRRC), West China Hospital of Sichuan University, Chengdu, China, 4Department of Neurology, West China Hospital of Sichuan University, Chengdu, China
Synopsis
Present neuroradiological studies demonstrated significant alterations in surface-based morphology in patients with essential tremor (ET) relative to healthy controls (HC). The current study was achieved by exploring the abnormal brain morphological features of patients with ET by using three-dimensional T1-weighted imaging, as well as the relationship between demographic/clinical variables and affected structural cortical features. We found that ET patients showed significant structural changes both in the motor and non-motor brain regions and some abnormities were correlated with the clinical scales. Further, abnormalities attributed to ET can also be affected by various demographic and clinical variables.
INTRODUCTION
Some neuroimaging studies based on surface morphometric analyses provided precise information about underling essential tremor (ET)-related mechanisms 1, 2. However, few studies have comprehensively described the comprehensive surface characteristics of the whole brain to further prove the differences between ET patients and healthy control (HC).METHODS
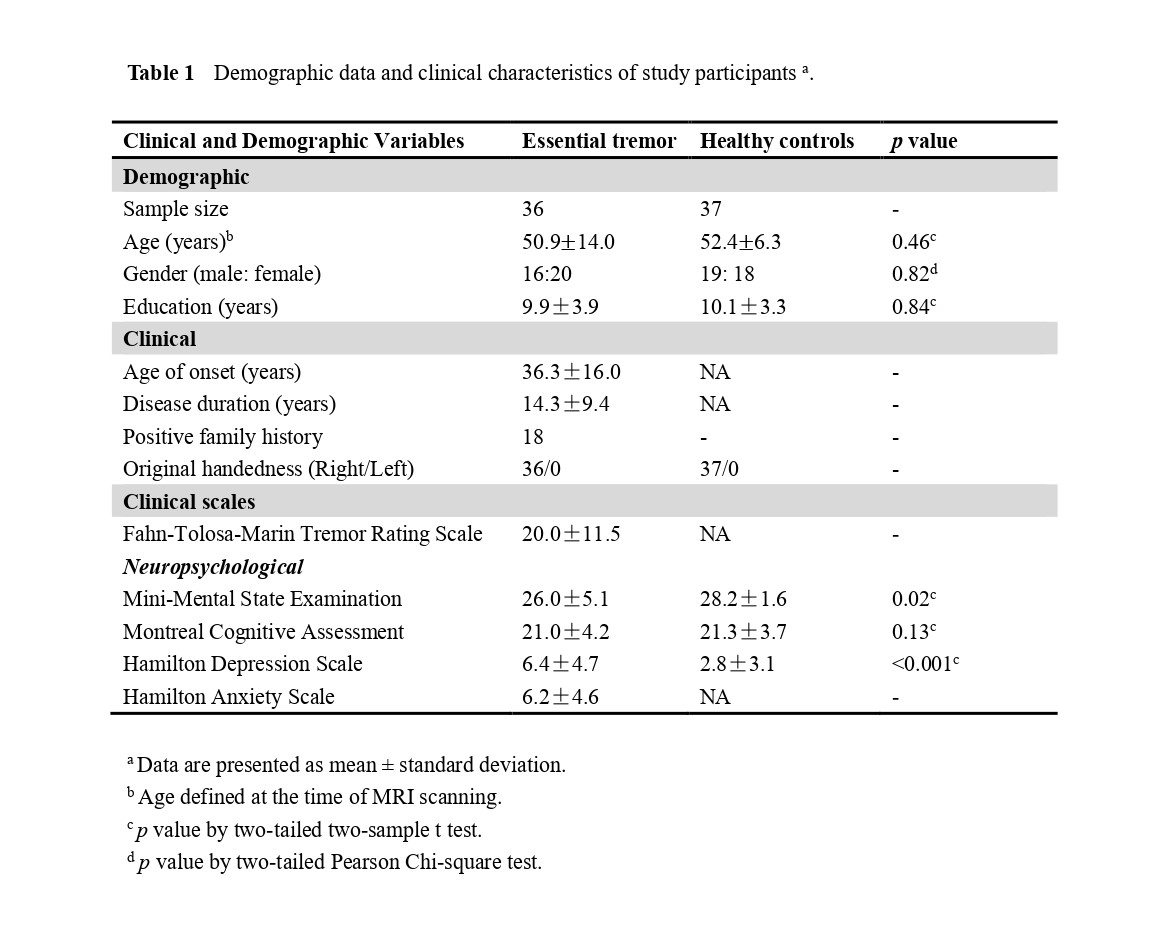
Informed consent was provided, and the prospective study was approved by the ethics committee of the West China Hospital. Recruited were 36 patients with ET and 37 HC (Table 1). All participants underwent scanning in a 3.0 tesla whole-body MRI system (Tim Trio; Siemens Healthineers, Erlangen, Germany) with an 8-channel phased array head coil to obtain a high-resolution 3D-T1 weighted structure image. Cortical thickness, volume and area were analyzed with FreeSurfer 6.0.0 software based on the raw data. Statistical differences between patient group and HC group were evaluated with a general linear model. The results were corrected in order to avoid false positives from repeated comparisons 3. Averaged data from the regions with volumetric or cortical thickness/area differences between groups were extracted in each individual to examine correlations between morphometric measures and clinical profiles.RESULTS
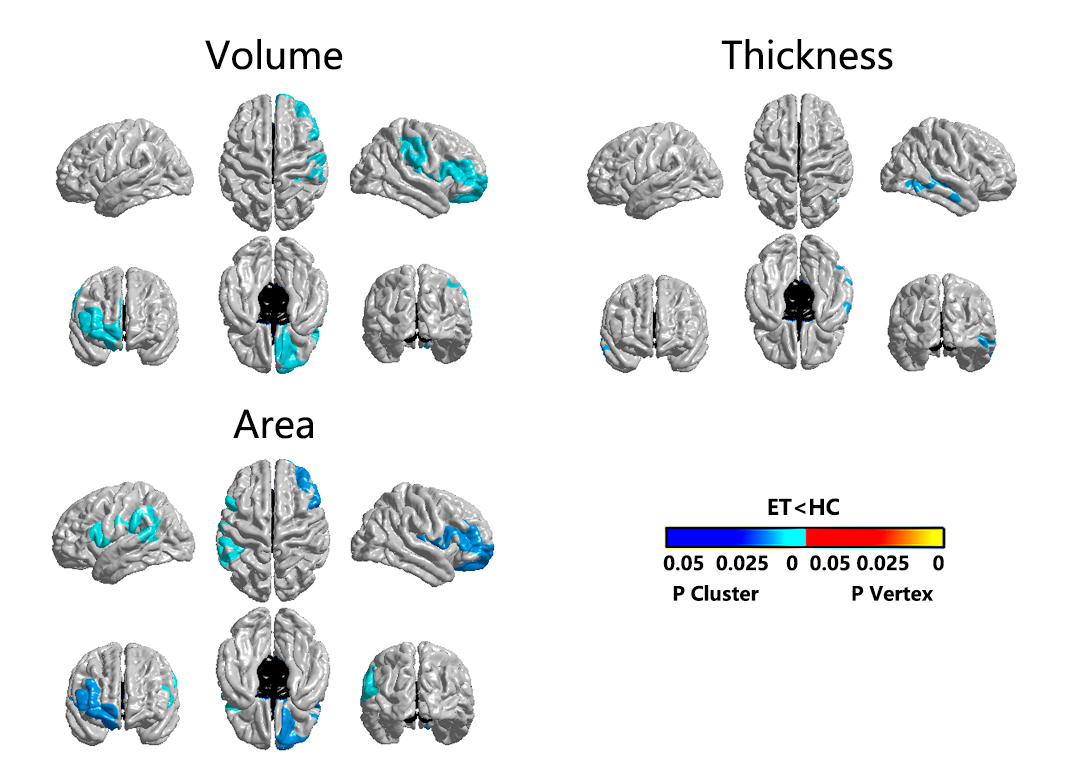
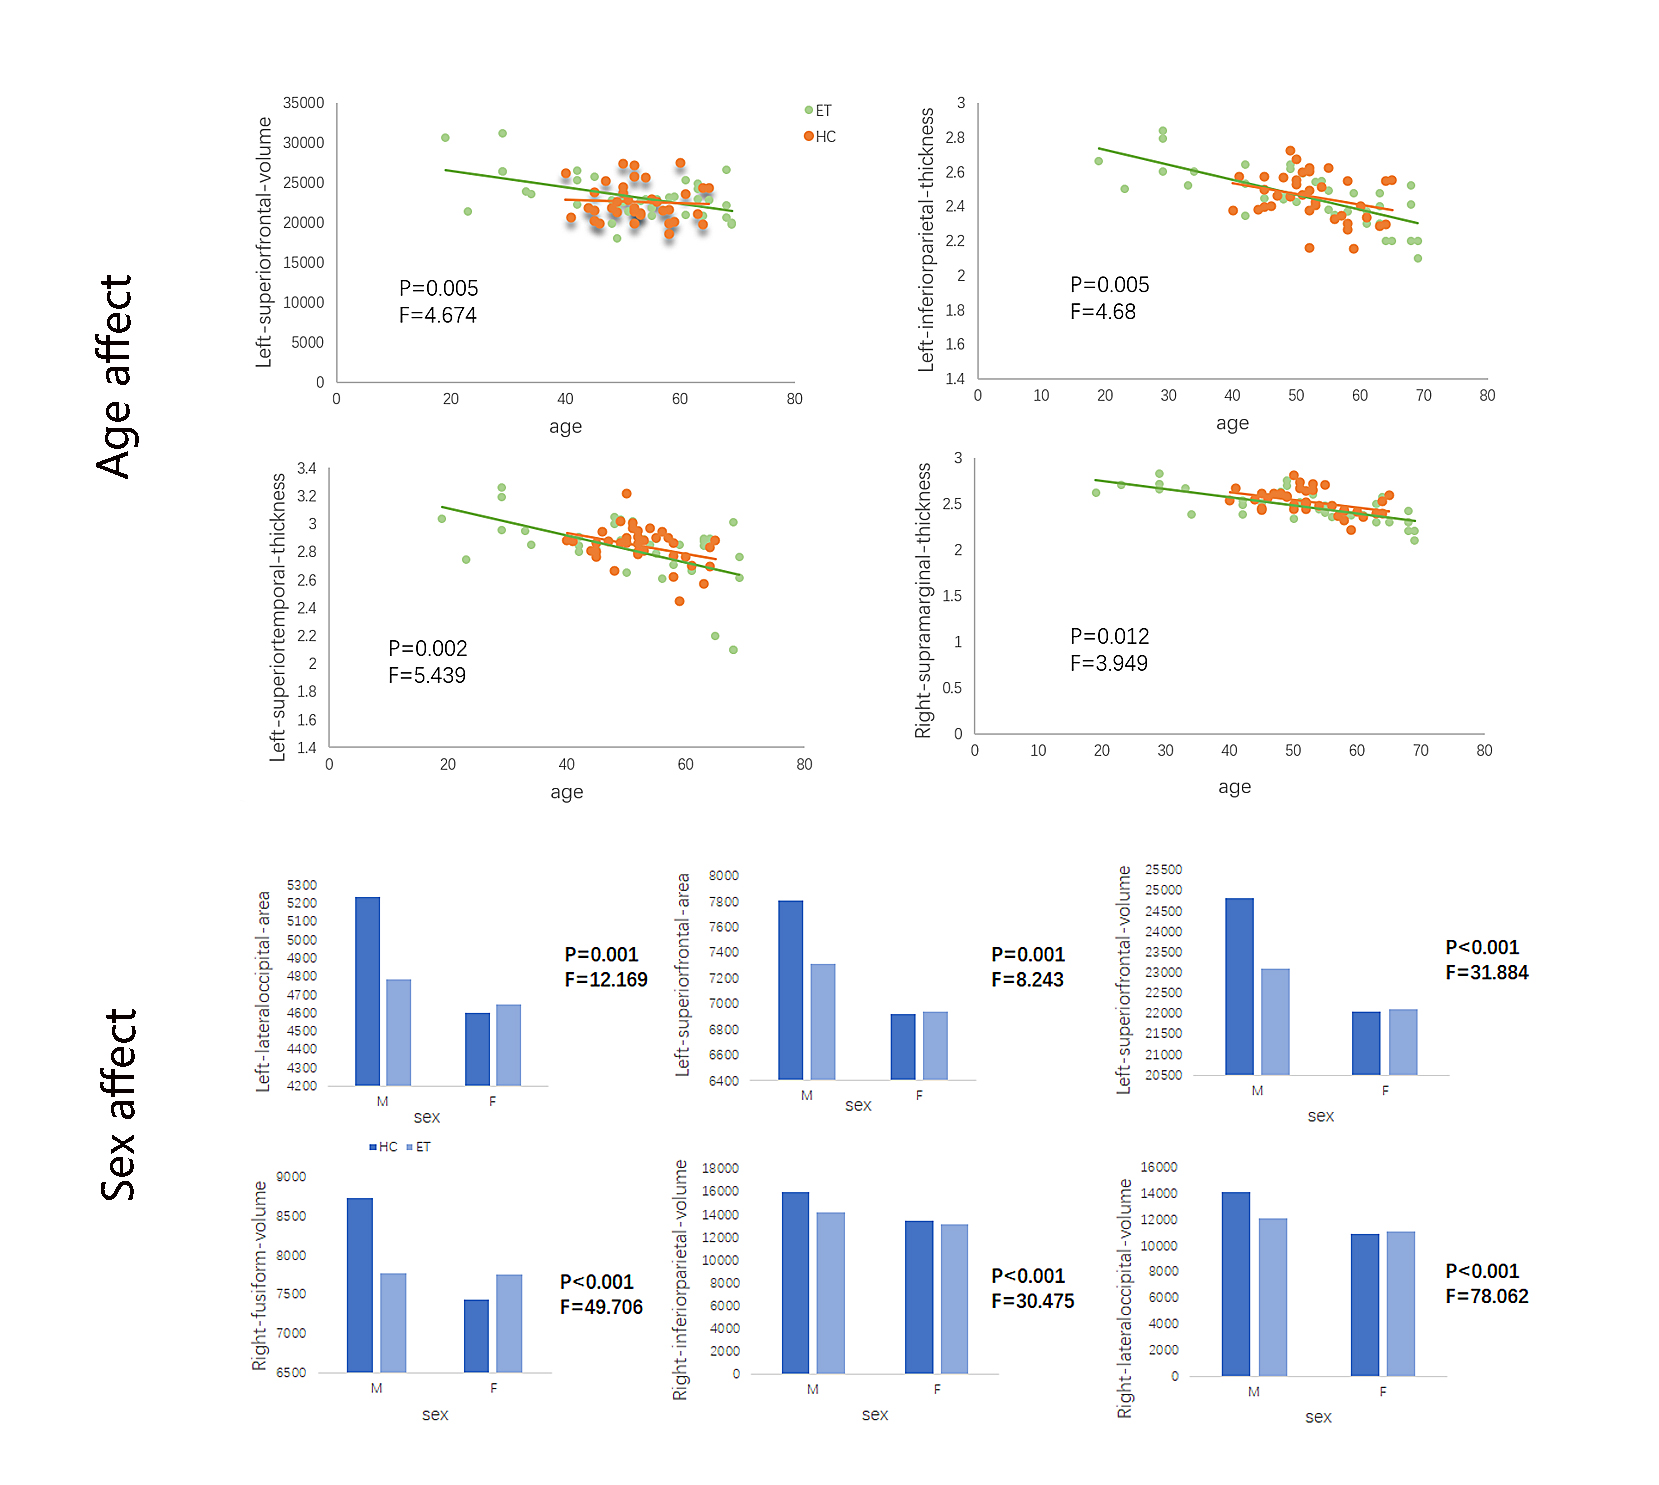
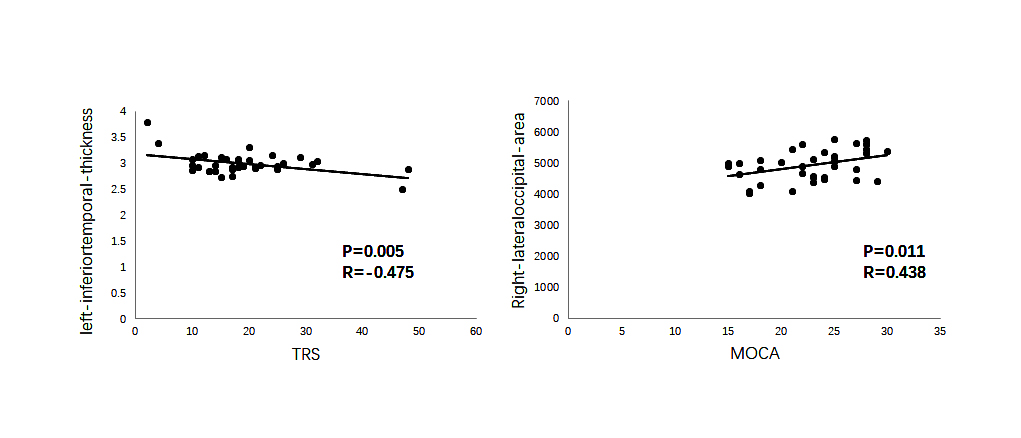
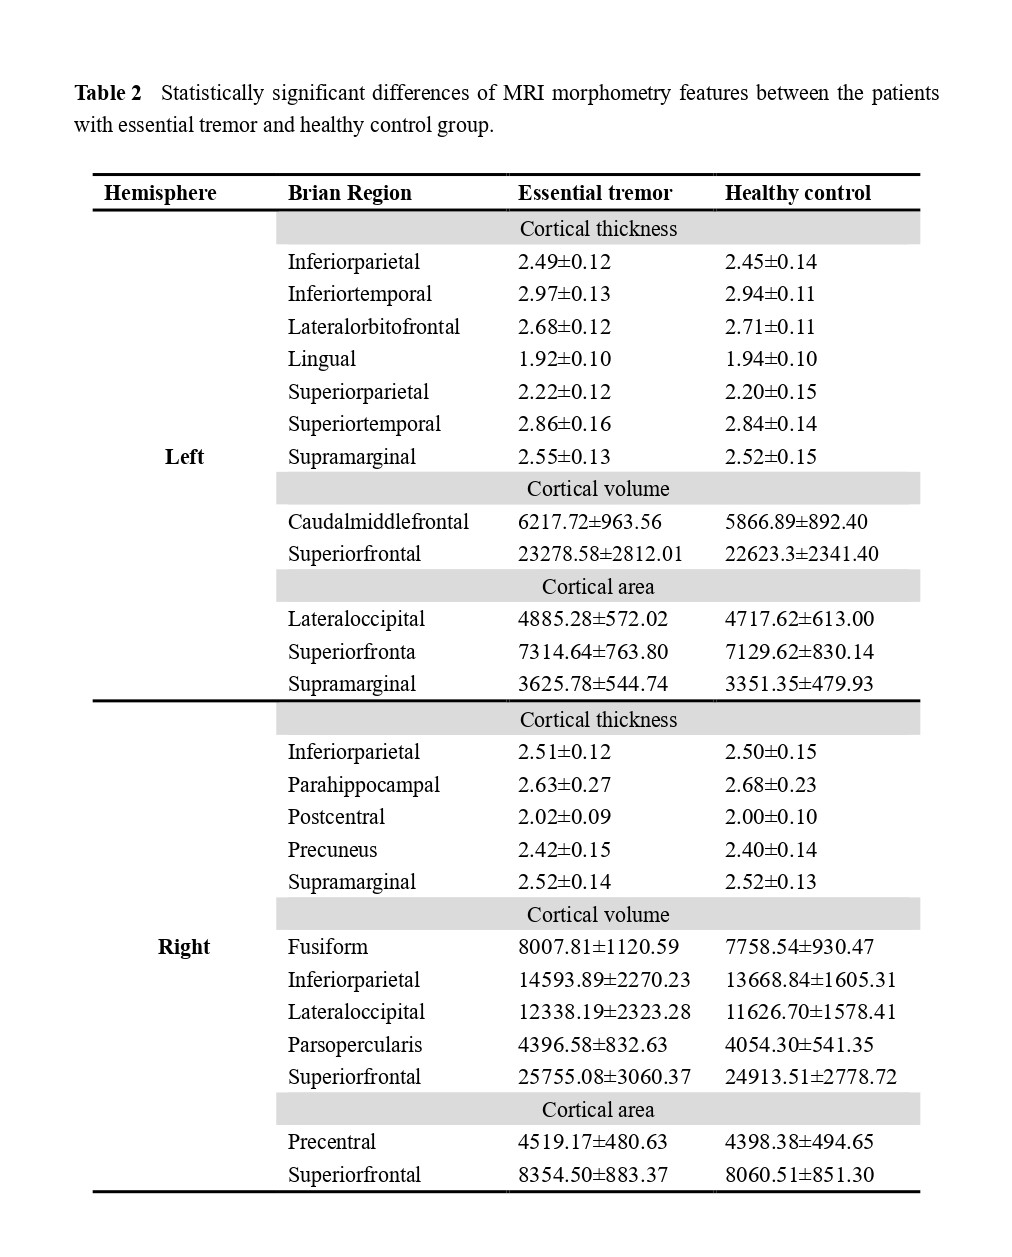
Patients with ET showed reduced cortical thickness in bilateral inferior parietal gyrus, bilateral supramarginal lobe, left inferior/superior temporal lobe, right precuneus and right postcentral cortex. Reduced cortical volume in bilateral superior frontal gyrus and right inferior parietal gyrus, right lateral occipital lobe. Moreover, reduced cortical area in left supramarginal gyrus, left superior frontal gyrus, left lateral occipital gyrus and right precentral gyrus, right superior frontal gyrus (p<0.05; Monte Carlo null-z simulation corrected) compared with HC (Figure 1, Table 2). The volume of left superior frontal gyrus (p=0.005, F=4.674) and the thickness of left inferior parietal gyrus (p=0.005, F=4.68), left superior temporal lobe (p=0.002, F=5.439), right supramarginal lobe (p=0.012, F=3.949) showed significant differences based on the detection of age affect between groups. The area of left lateral occipital gyrus (p=0.001, F=12.169), left superior frontal gyrus (p=0.001, F=8.243) and the volume of left superior frontal gyrus (p<0.001, F=31.884), right inferior parietal gyrus (p<0.001, F=30.475), right lateral occipital gyrus (p<0.001, F=78.062) exhibited that significant differences based on the detection of gender affect between groups (Figure 2). Additionally, ET severity was negatively correlated with cortical thickness of the left inferior temporal gyrus (r = -0.475, p=0.005), as well as Montreal Cognitive Assessment was positively correlated with cortical area of the right lateral occipital gyrus (r=0.438, p=0.011) (Figure 3).DISCUSSION
The current research revealed a wide range of cortical characteristic deficits in patients with ET relative to HC. As a multisystem disease, the cortical characteristic abnormities in primary motor areas and extra motor areas were both expected in patients with ET, which has been reported by some previous studies 4, 5. It’s natural to know that atrophic changes always occur over a chronic course of illness, such as some pure neurological disorders 6, 7. Moreover, the patterns of findings in superior frontal, temporal and occipital gyrus were also interesting, because all of these areas were dispersedly located in different subnetworks, including default mode network, central executive network and salience networks. To our knowledge, the finding of these structural alterations has been proved in some previous studies 8, 9, indicating a potential structural basis for dysfunction of these subnetworks. Meanwhile, the significant effects of age and gender on abnormal cortical characteristic of patients with ET were also detected. With age, the cortical characteristics of some abnormal brain regions changed significantly more than those of HC. As some reports have shown, the prevalence of ET increases with age 10. Therefore, it is easy to speculate that the brain abnormalities of ET patients become more common and more serious with the increase of age. And there are also great differences between male and female patients, it’s obviously to know that ET is a sex-related disorder and it’s also higher in male than female to have some positive symptoms 11, which is consistent with our present result, the cortical characteristic alterations of brain regions in male patients were more serious than these in female patients. On the other hand, there also exists some relationships between cortical characteristic abnormities and clinical scales. The thickness of left-inferior temporal gyrus was negatively correlated with the Fahn–Tolosa–Marìn Tremor Rating Scale, as well as the area of right-lateral occipital was positively correlated with the Montreal Cognitive Assessment. Previous neuroimage studies have shown consistently that ET is associated with an extensive involvement of the temporal and occipital gyrus 12, 13, it was consistent with that in our study. Therefore, we can speculate that the relationship between abnormal alterations of these regions and the more serious ET symptom could be seen as a biomarker to lighten the pathology of ET.CONCLUSION
Our findings exhibited that ET patients showed significant surface-based morphology alternations when compared with HC, and those alterations were also related to the severity of ET symptoms. Furthermore, the present relationship between neuroradiological findings and demographic variable could help to clarify the pathogenesis of ET and could be potential biomarkers of brain abnormalities.Acknowledgements
The authors of this report would like to thank the families who participated in this study.References
1. Prasad S, Shah A, Bhalsing K S, et al. Clinical correlates of abnormal subcortical volumes in Essential Tremor. J Neural Transm (Vienna). 2019; 126(5): 569-576.
2. Prasad S, Shah A, Bhalsing K S, et al. Abnormal hippocampal subfields are associated with cognitive impairment in Essential Tremor. J Neural Transm (Vienna). 2019; 126(5): 597-606.
3. Genovese C R, Lazar N A, Nichols T. Thresholding of statistical maps in functional neuroimaging using the false discovery rate. Neuroimage. 2002; 15(4): 870-8.
4. Hopfner F, Ahlf A, Lorenz D, et al. Early- and late-onset essential tremor patients represent clinically distinct subgroups. Mov Disord. 2016; 31(10): 1560-1566.
5. Louis E D, Benito-León J, Bermejo-Pareja F. Self-reported depression and anti-depressant medication use in essential tremor: cross-sectional and prospective analyses in a population-based study. Eur J Neurol. 2007; 14(10): 1138-46.
6. Masaki H, Watanabe K, Kakeda S, et al. Hippocampal sclerosis without visually detectable hippocampal MRI abnormalities: automated subfield volumetric analysis. Jpn J Radiol. 2020; 38(11): 1020-1027.
7. Boutzoukas E M, Crutcher J, Somoza E, et al. Cortical thickness in childhood left focal epilepsy: Thinning beyond the seizure focus. Epilepsy Behav. 2020; 102: 106825.
8. Han Q, Hou Y, Shang H. A Voxel-Wise Meta-Analysis of Gray Matter Abnormalities in Essential Tremor. Front Neurol. 2018; 9: 495.
9. Benito-Leon J, Louis E D, Romero J P, et al. Altered Functional Connectivity in Essential Tremor: A Resting-State fMRI Study. Medicine (Baltimore). 2015; 94(49): e1936.
10. Benito-León J, León-Ruiz M. [Epidemiology of essential tremor]. Rev Neurol. 2020; 70(4): 139-148.
11. Sun H, Sun F, Zhang X Q, et al. The Prevalence and Clinical Characteristics of Essential Tremor in Elderly Chineses: A Population-Based Study. J Nutr Health Aging. 2020; 24(10): 1061-1065.
12. Cao H, Wang R, Luo X, et al. A Voxel-Based Magnetic Resonance Imaging Morphometric Study of Cerebral and Cerebellar Gray Matter in Patients Under 65 Years with Essential Tremor. Med Sci Monit. 2018; 24: 3127-3135.
13. Cameron E, Dyke J P, Hernandez N, et al. Cerebral gray matter volume losses in essential tremor: A case-control study using high resolution tissue probability maps. Parkinsonism Relat Disord. 2018; 51: 85-90.
Figures