2145
Mapping brain structure and network alterations in male chronic smokers using generalized q-sampling MRI1Department of Medical Imaging and Radiological Sciences, and Bachelor Program in Artificial Intelligence, Chang Gung University, Taoyuan, Taiwan, 2Medical Imaging Research Center, Institute for Radiological Research, Chang Gung University and Chang Gung Memorial Hospital at Linkou, Taoyuan, Taiwan, 3Department of Psychiatry, Chang Gung Memorial Hospital, Chiayi, Taiwan, 4Department of Medical Laboratory and Biotechnology, Chung Shan Medical University, Taichung, Taiwan, 5Clinical Laboratory, Chung Shan Medical University Hospital, Taichung, Taiwan, 6Department of Psychology, Chung Shan Medical University, Taichung, Taiwan, 7Clinical Psychological Room, Chung Shan Medical University Hospital, Taichung, Taiwan
Synopsis
The World Health Organization suggests that cigarette smoking causes more than 7 million deaths every year. However, few studies have focused on the structural alternations of chronic smoking by using generalized q-sampling imaging (GQI). We aimed to use GQI to evaluate the impact of the neurological structure and network caused by chronic smoking. Our results provided further evidence indicating that chronic smoking may lead to brain structure and connectivity changes.
Introduction
The World Health Organization suggests that cigarette smoking causes more than 7 million deaths every year 1, 2. However, few studies have focused on the structural alternations of chronic smoking by using generalized q-sampling imaging (GQI). In the current study, the chronic smokers and nonsmokers received structural GQI scans, and the data were analyzed with voxel-based analysis (VBA), graph theoretical analysis (GTA) and network-based statistical (NBS) analysis to detect the structure and structural connectivity alternation in the brain.Methods
Sixty-seven chronic smokers and 43 nonsmokers underwent a magnetic resonance imaging (MRI) scan. Diffusion images were obtained using a 3-Tesla MRI (750W, GE Medical Systems, Waukesha, WI) with TR/TE = 4800/80 ms, FOV = 250 × 250 mm2, matrix =128 × 128, slices = 40, in-plane resolution = 2 × 2 mm2, slice thickness = 3.5 mm, signal average =1, 64 x 2 non-collinear diffusion weighting gradient direction with b = 1000, 2000 s/mm2 and 4 null images without diffusion weighting (b = 0 s/mm2).In the diffusion-image preprocessing, the eddy current artifact was first corrected with FSL Eddy correction (FMRIB, Oxford, UK). GQI indices mapping (GFA and NQA) were reconstructed from multishell diffusion data with DSI Studio (National Taiwan University, Taipei, Taiwan) 3. In GQI voxel-based statistical analysis (VBA), the GQI indices of the chronic smokers and the nonsmokers were compared using false discovery rate (FDR) corrected two-sample t-tests. Age and education year were used as covariates for t-test analysis.
For graph theoretical analysis (GTA), we first segmented the whole brain of each subject into 90 regions based on the Automated Anatomical Labeling (AAL) atlas 4, with each region considered a node. The GQI tractography connection between each node was viewed as an edge (fiber number x NQA / mean fiber length). The 90 × 90 connectivity matrix was then calculated using DSI Studio for each participant. The Graph Analysis Toolbox (GAT, Stanford University School of Medicine, Stanford, CA, USA) was then used to obtain the topological parameters. The network-based statistical (NBS) analysis (NBS, Melbourne Neuropsychiatry Centre, the University of Melbourne and Melbourne Health, Australia) 5. was also performed to identify the alterations of cerebral subnetworks in group comparison.
Results
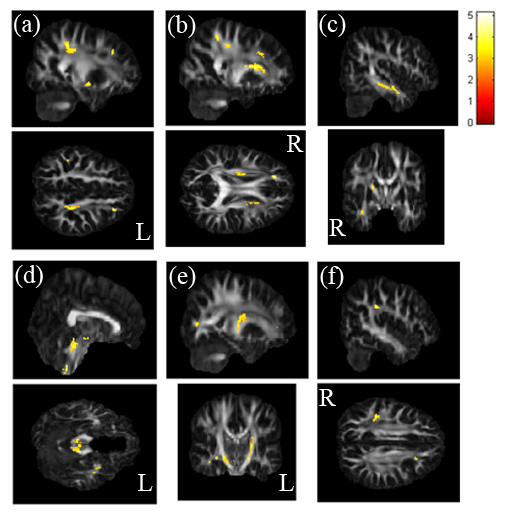
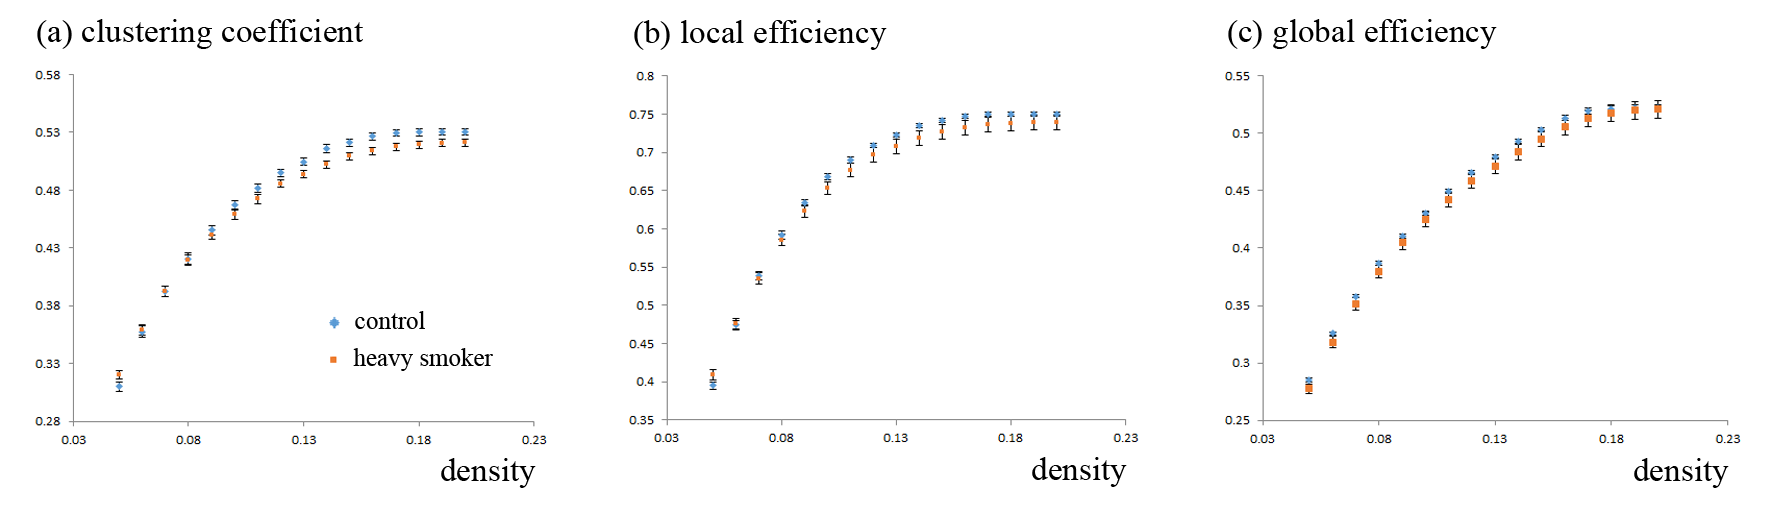
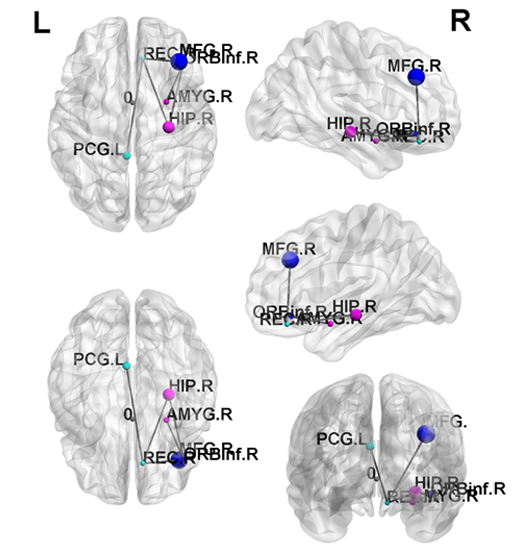
In the t-test result of GQI, we observed that chronic smokers had less GFA in the left middle frontal gyrus (Fig. 1a), the right superior fronto-occipital fasciculus (Fig. 1b), the right temporal gyrus (Fig. 1c), the left parahippocampus (Fig. 1d), the left anterior internal capsule (Fig. 1e), and the right inferior parietal gyrus (Fig. 1f), compared with nonsmokers.A statistically significant lower clustering coefficient, as well as local and global efficiency, were obtained in the chronic smokers compared to the nonsmokers from 0.05 to 0.2 density (p < 0.05) (Fig. 2). Furthermore, in NBS, there were fewer connections within and between the subnetworks among the chronic smokers as compared to the nonsmokers. In general, the majority of the subnetwork connectivity among the chronic smokers was localized to the frontal-temporal gyrus (p < 0.05) (Fig. 3).
Discussion
The current study evaluated the alternations of the neurological structure caused by chronic cigarette smoking. Our results demonstrated the white matter integrity alternations in the chronic smokers. The chronic smokers demonstrated poorer information transmission within the local networks and global integration. Also, they had fewer connections within and between the subnetworks.Conclusion
Our results provided further evidence indicating that chronic smoking may lead to brain structure and connectivity changes.Acknowledgements
This study was supported by the research program, MOST105-2410-H-040-001-MY3, which was sponsored by the Ministry of Science and Technology, Taipei, Taiwan.References
1. Öberg, M., et al., Worldwide burden of disease from exposure to second-hand smoke: a retrospective analysis of data from 192 countries. The Lancet, 2011. 377(9760): p. 139-146.
2. Yoshida, T. and R.M. Tuder, Pathobiology of Cigarette Smoke-Induced Chronic Obstructive Pulmonary Disease.Physiological Reviews, 2007. 87(3): p. 1047-1082.
3. Yeh, F.C., V.J. Wedeen, and W.Y. Tseng, Generalized q-sampling imaging. IEEE Trans Med Imaging, 2010. 29(9): p. 1626-35.
4. Tzourio-Mazoyer, N., et al., Automated anatomical labeling of activations in SPM using a macroscopic anatomical parcellation of the MNI MRI single-subject brain. Neuroimage, 2002. 15(1): p. 273-89.
5. Zalesky, A., A. Fornito, and E.T. Bullmore, Network-based statistic: identifying differences in brain networks.Neuroimage, 2010. 53(4): p. 1197-207.
Figures