2144
Towards to quantitative mapping of grey matter deficits in children with treatment-naïve attention deficit/hyperactivity disorder1First Affiliated Hospital, Sun Yat-sen University, Guang Dong, China, 2MR Research, GE Healthcare, Beijing, China
Synopsis
As the most common childhood-onset neurodevelopmental disorder, the pathogenesis of attention deficit hyperactivity disorder (ADHD) is still unclear. The goal of current study aims at investigating the quantitative profiles of brain grey matter in pediatric treatment-naïve ADHD using Synthetic MRI (SyMRI).
Introduction
Attention-deficit/hyperactivity disorder (ADHD), as the most common childhood-onset neurodevelopmental disorder, is characterized by age-inappropriate inattention, hyperactivity and impulsivity[1]. Recent studies indicated that the findings from brain morphometry studies were for ADHD-related alterations in total grey matter volume (GMV) reductions, the changes of reductions in various cortical regions remained controversial[2-4]. Nowadays, advanced magnetic resonance imaging technology have a great application prospect insight of microstructural changes of human brain cortex[5]. Quantitative analysis of MR relaxation parameters can provide more brain indices as its inherent goal is to measure characteristic relaxation times of different brain structures[6], which might reflect a combined developmental changes of brain microstructure. Following this concept, the main work in our research including: 1) the synthetic MRI measure the quantitative MR parameters, T1, T2 and PD from one scan; 2) the correlations between the quantitative MR values of GM regions with the severity of illness in ADHD were accessed; 3) a whole-brain GM analysis was performed.Method
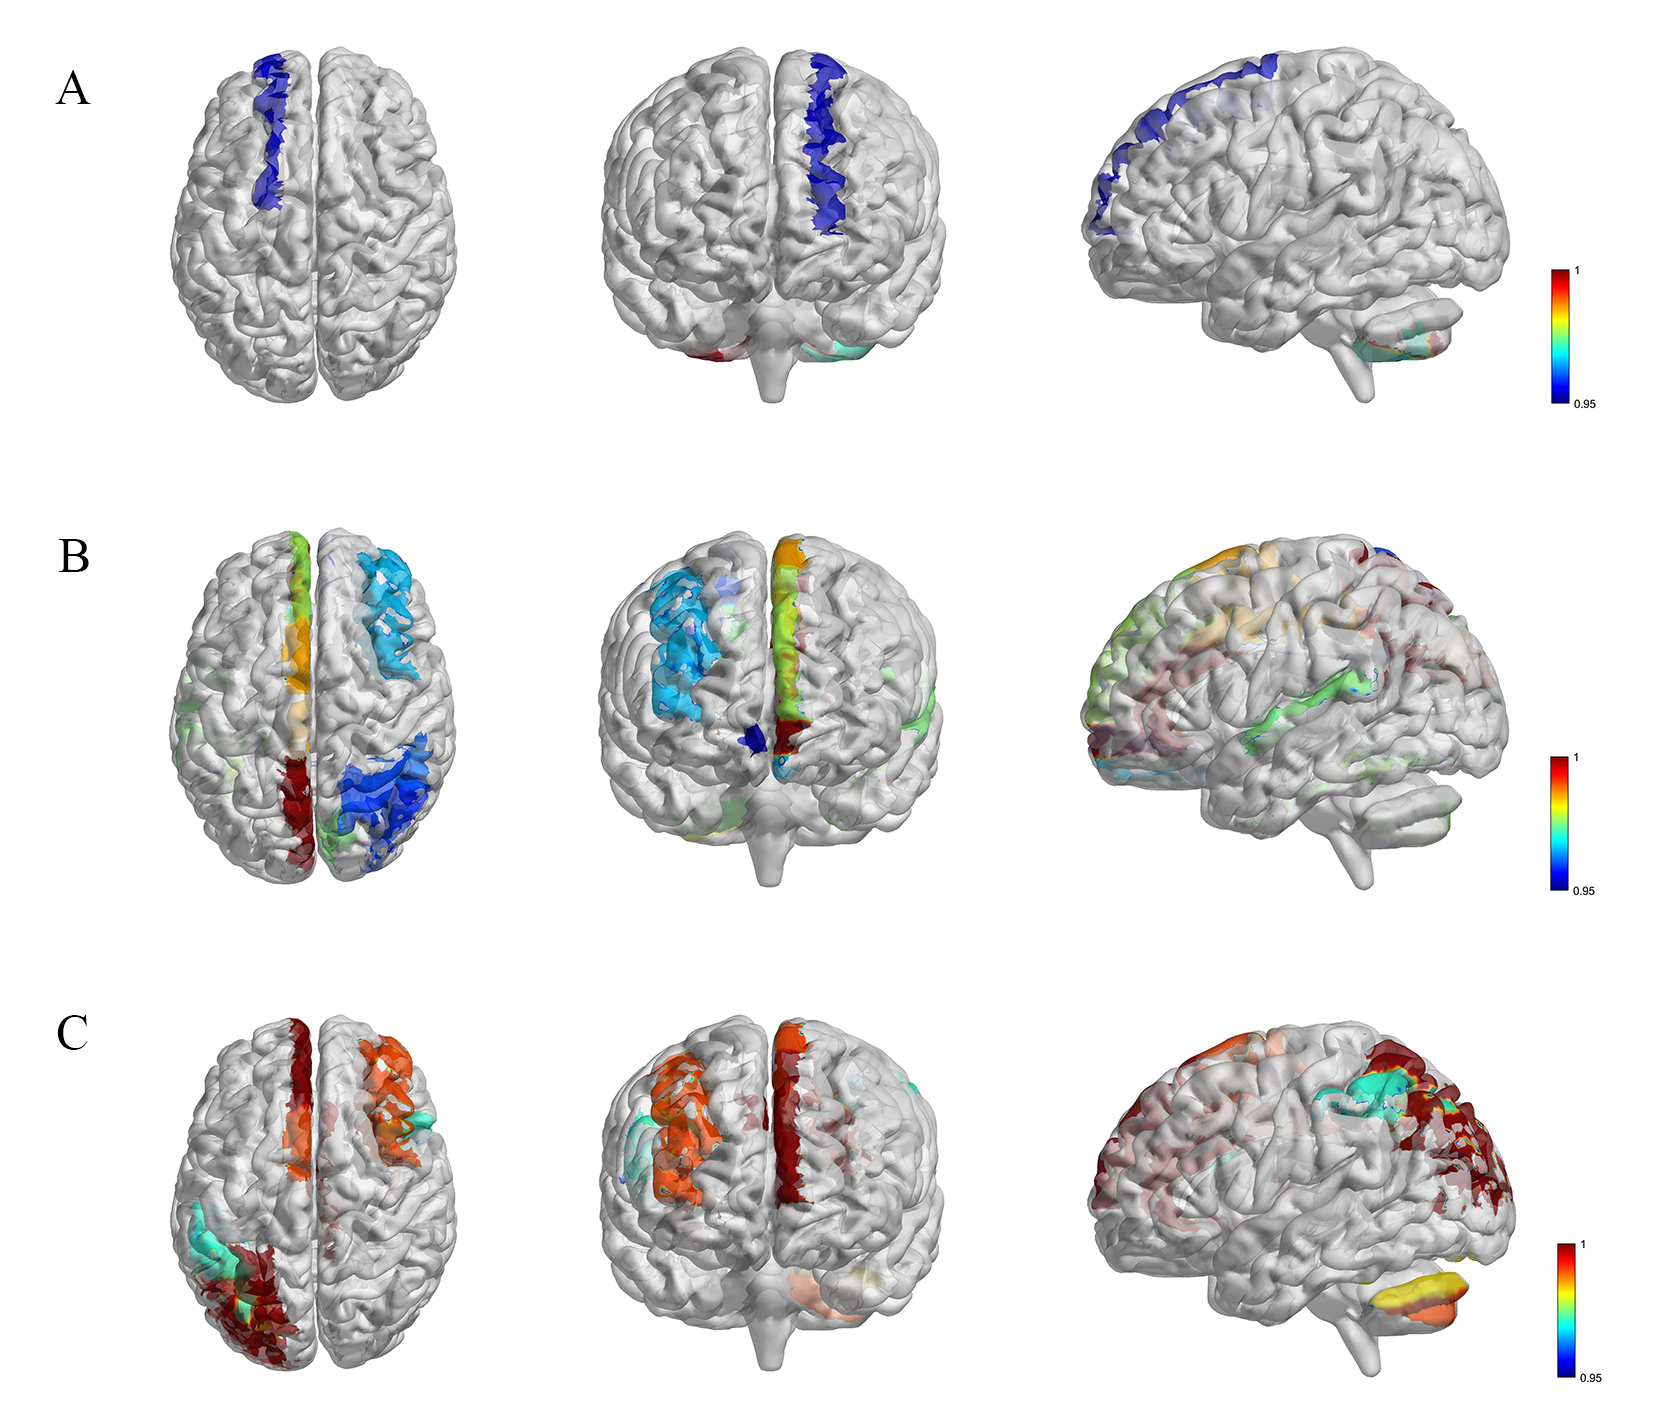
37 treatment-naïve pediatric patients with clinical diagnosis of ADHD and 27 age- and gender- matched healthy controls (HC) were enrolled in this study. Each subject underwent both SyMRI and conventional 3D T1-FSPGR scans. Quantitative parameters, T1, T2 and PD maps, were extracted from the SyMRI data using vendor provided postprocessing tool (Synthetic MR, v11.2.2). Thereafter, the individual T1, T2, PD maps were first co-registered to 3D T1-FSPGR image, then normalized to the MNI space. The AAL atlas was applied to extract the regional quantitative values for each subject. A general linear model was performed to compare the differences of these quantitative maps between groups. Then, Pearson correlation analysis was conducted to assess the association between the significantly altered MR indices and clinical measurements (Test of Variables of Attention) in ADHD group.Results
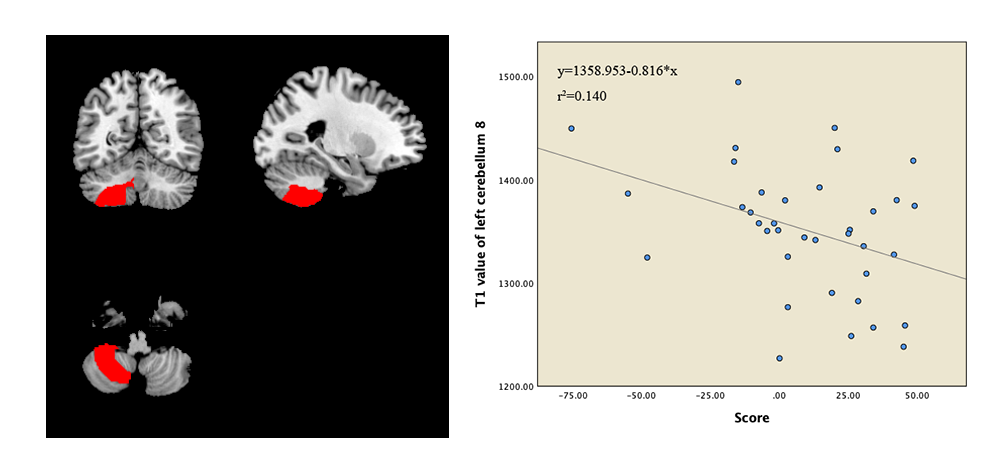
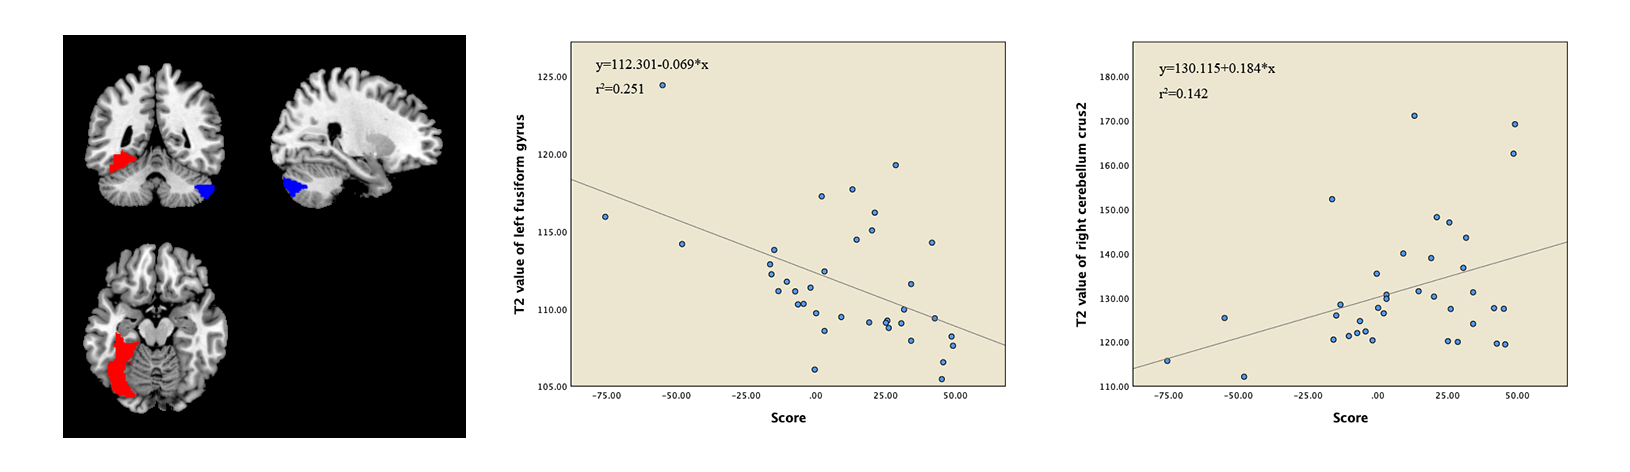
Compared with HC group, ADHD group showed significantly altered T1, T2 and PD values in grey matter regions of cerebellum, limbic system and default mode network (DMN). Moreover, the T1 value of the right cerebellum 8 were found to have negative correlation with attention concentration level in ADHD patients (r = -0.374, P < 0.05). With regards to T2 maps, we observed negative correlation relationships between T2 value of left fusiform gyrus (r =-0.501, P < 0.05) and right cerebellum crus2 (r =-0.377, P < 0.05) with attention level in ADHD patients.Discussion
MRI relaxometry is sensitive to a variety of tissue characteristics in a complex manner, which makes it both attractive and challenging for characterizing tissue. As we know, there are many reasons that can lead to the T1, T2 and PD values change in the brain, including but not limited to mental deposition like iron or calcium deposition, changes of metabolic state and changes of blood perfusion[6]. Our findings demonstrate that patients with ADHD were linked to multiple regions changes of MR mapping values relative to control individuals, which mostly located in functional grey matter regions of cerebellum, limbic system and default mode network (DMN). Recently, an independent component (ICA) analysis showed significant gray matter network reductions in bilateral crus I, left lingual gyrus, left crus II, and left fusiform in ADHD[7], which was quite consistent with our findings, that higher T2 values of right crus II and higher PD value of left crus I/II have been found in ADHD compared to healthy controls. Whether the grey matter microstructure changes lead to functional connectivity changes haven’t been clarified. Moreover, focal gray matter regions signal changes correlated to attention concentration level were also found in our study, which indicated that the microstructure change in the specific brain regions was associated with ADHD.Conclusion
In summary, we characterized the T1, T2 and PD values of whole brain GM in treatment-naïve pediatric ADHD patient. which indicated that the microstructure change in the specific brain regions was associated with ADHD. All those results indicated that MR quantitative mapping might have the potential efficacy in the auxiliary diagnosis of ADHD.Acknowledgements
None.References
[1]. Thapar A and Cooper M.Attention deficit hyperactivity disorder[J].The Lancet,2016. 387(10024): 1240-1250.
[2]. Samea F, Soluki S, Nejati V, et al.Brain alterations in children/adolescents with ADHD revisited: A neuroimaging meta-analysis of 96 structural and functional studies[J].Neurosci Biobehav Rev,2019. 100: 1-8.
[3]. Bos DJ, Oranje B, Achterberg M, et al.Structural and functional connectivity in children and adolescents with and without attention deficit/hyperactivity disorder[J].J Child Psychol Psychiatry,2017. 58(7): 810-818.
[4]. Hoogman M, Bralten J, Hibar DP, et al.Subcortical brain volume differences in participants with attention deficit hyperactivity disorder in children and adults: a cross-sectional mega-analysis[J].Lancet Psychiatry,2017. 4(4): 310-319.
[5]. Stuber C, Morawski M, Schafer A, et al.Myelin and iron concentration in the human brain: a quantitative study of MRI contrast[J].Neuroimage,2014. 93 Pt 1: 95-106.
[6]. Does MD.Inferring brain tissue composition and microstructure via MR relaxometry[J].Neuroimage,2018. 182: 136-148.
[7]. Jiang WH, Duan KK, Chen JY, et al.Structural Brain Alterations and Their Association with Cognitive Function and Symptoms in Attention-Deficit/Hyperactivity Disorder Families[J].European Neuropsychopharmacology,2019. 29: 1189-1190.
Figures