2143
Association between interhemispheric functional connectivity (IFC) and brain structural volume in patients with AD, MCI and VD1The University of Hong Kong, Hong Kong, Hong Kong, 2Queen Mary Hospital, Hong Kong, Hong Kong, 3Imperial College London, London, United Kingdom
Synopsis
The findings demonstrated the interhemispheric functional connectivity correlates with brain regional volume.
Introduction
In the past decade, structural MRI has been used to aid in the diagnosis of AD, MCI and other forms of dementia[1]. Many studies demonstrated that when compare to healthy control (HC), patients with AD have a significant reduction in the volume of medial temporal lobe, including the hippocampus, entorhinal cortex, parahippocampal gyrus, subiculum and amygdala [2]. Through quantitative measurement of volume of regions-of-interest (ROI) in hippocampus, it is suggested that total brain and the hippocampal volume reduction can be a diagnostic factor for AD and MCI, and the rate of reduction can be an indicator to predict the disease progression[3].Method
81 participants (25 healthy controls HC, 16 AD, 28 MCI, 12 vascular dementia (VD)) were recruited to undergo structural MRI and Resting state functional MRI (rs-fMRI) scanning.Data Acquisition T1W Images MRI images were acquired using a Phillips Achieva 3T equipped with 32-channel phased-array head coil (Department of Diagnostic Radiology, the University of Hong Kong). A T1W MPRAGE (magnetization prepared rapid acquisition gradient-echo): repetition time [TR]=6.75ms, echo time [TE]=3.163ms, inversion time [TI]=844ms, flip angle = 8o, slice thickness = 1.2mm, 256 sagittal slices; acquisition matrix = 256 x 256, field of view = 256 x 256 mm2, voxel size = 1 x 1 x 1.2mm3, band width = 241Hz/pix. ) was obtained.
Resting State functional Images Each participants were asked to remain quiet and relax during the scan, with their eyes closed but not to fall asleep. Resting state functional MRI (rs-fMRI) images were obtained with following parameters (multi-echo echo planar imaging (EPI) sequence; 180 time points; TR=2000ms, TE=30ms, Flip angle = 90o, slice thickness=4mm, FOV = 230 x 230 mm2, acquisition matrix = 72 x 72, 36 slices, pixel dimension: 144 x 144 mm2, voxel size = 1.6 x 1.6 x 4mm3). In addition, MR angiography (MRA) of head, pseudo-continuous ASL (PCASL), susceptibility- and diffusion-weighted images were also acquired. The scanning time of each subject was 45 minutes in total.
Voxel Mirrored Homotopic Connectivity (VMHC) was calculated based on the method used by Kelly et al 2011 [4] and Zuo et al 2010 [5]. Volume of brain structures, including brain gyrus and sulcus and ventricles were assessed using Freesurfer (v. 7.1). Correlation between IFC and brain structural volume were calculated based on the Spearman’s correlation test, using SPSS (v.25.0).
Results
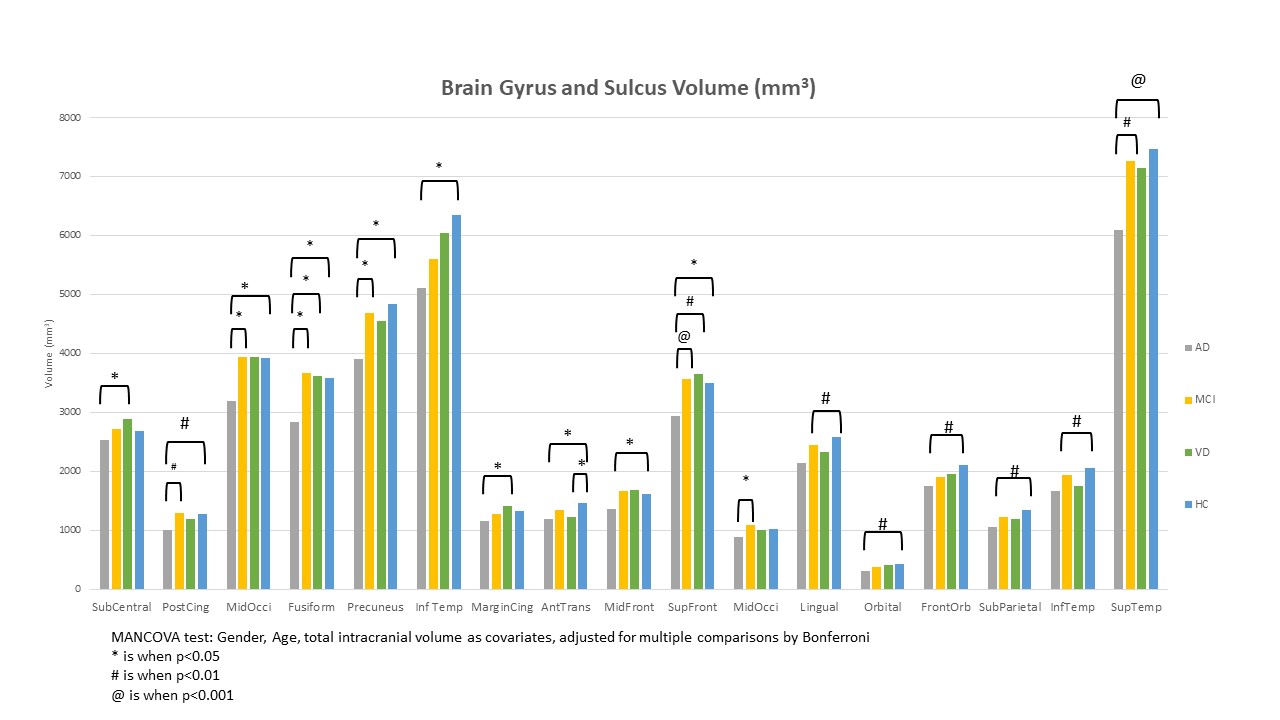
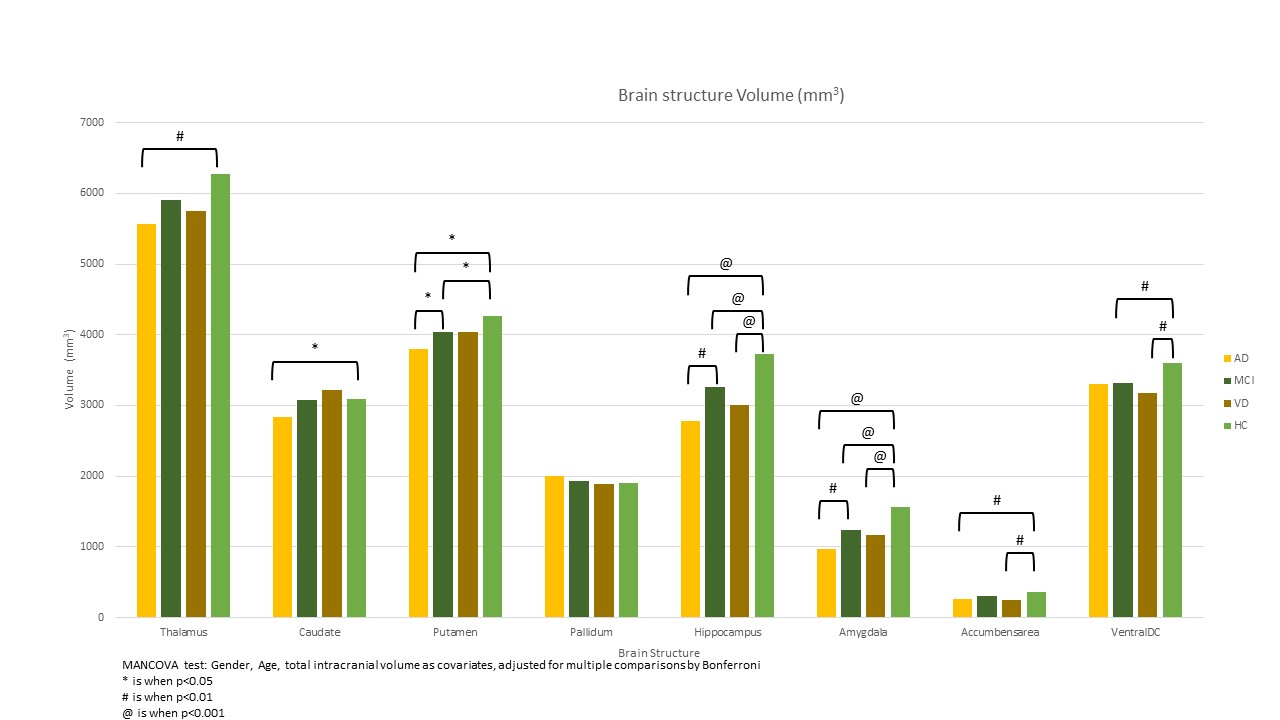
In brain volume analysis of gyrus and sulcus, AD showed significant atrophy at posterior cingulate dorsal gyrus, middle occipital gyrus, fusiform gyrus, precuneus, inferior temporal gyrus, anterior transverse gyrus, superior frontal sulcus, lingual gyrus, orbital sulcus, frontal orbital sulcus, sub-parietal sulcus, inferior temporal sulcus and superior temporal sulcus when compared to HC. For MCI, there were atrophy in most brain gyrus and sulcus, while there is no statistically difference from HC. Similarly, there were atrophy in most brain gyrus and sulcus in VD, however, only anterior transverse gyrus was statistically difference when compare to HC group.In view of brain structural volume, AD group demonstrated statistically significant atrophy in thalamus, hippocampus, amygdala, accumbens areas when compared to HC. VD showed similar results as AD when compared to HC group, with ventral diencephalon as an addition region of atrophy. For MCI, less severe atrophy was observed when compare to AD and VD toward HC. Compared to HC, VD showed significantly enlarged in lateral ventricle, inferior lateral ventricle, third ventricle, fourth ventricle, CSF and choroid plexus. While only lateral ventricle, inferior lateral ventricle and CSF has significantly enlarged for AD compared to HC. There is no statistically significant enlargement in ventricles of MCI group.
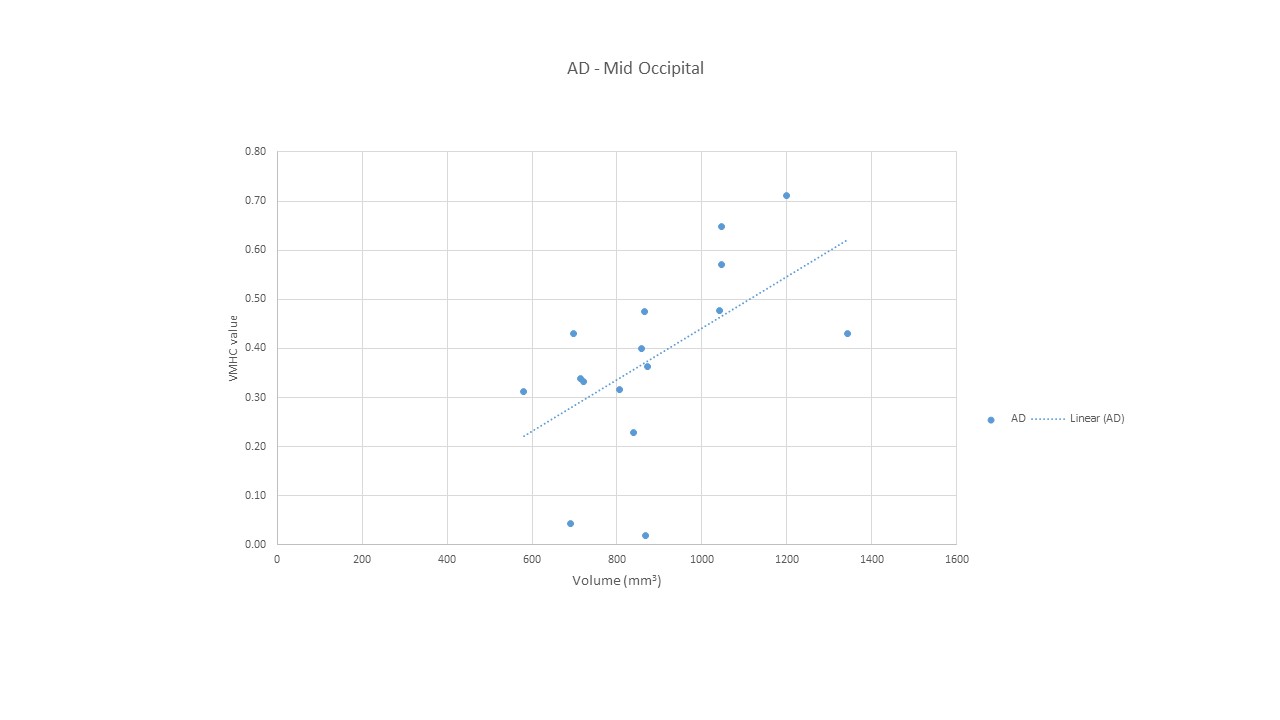
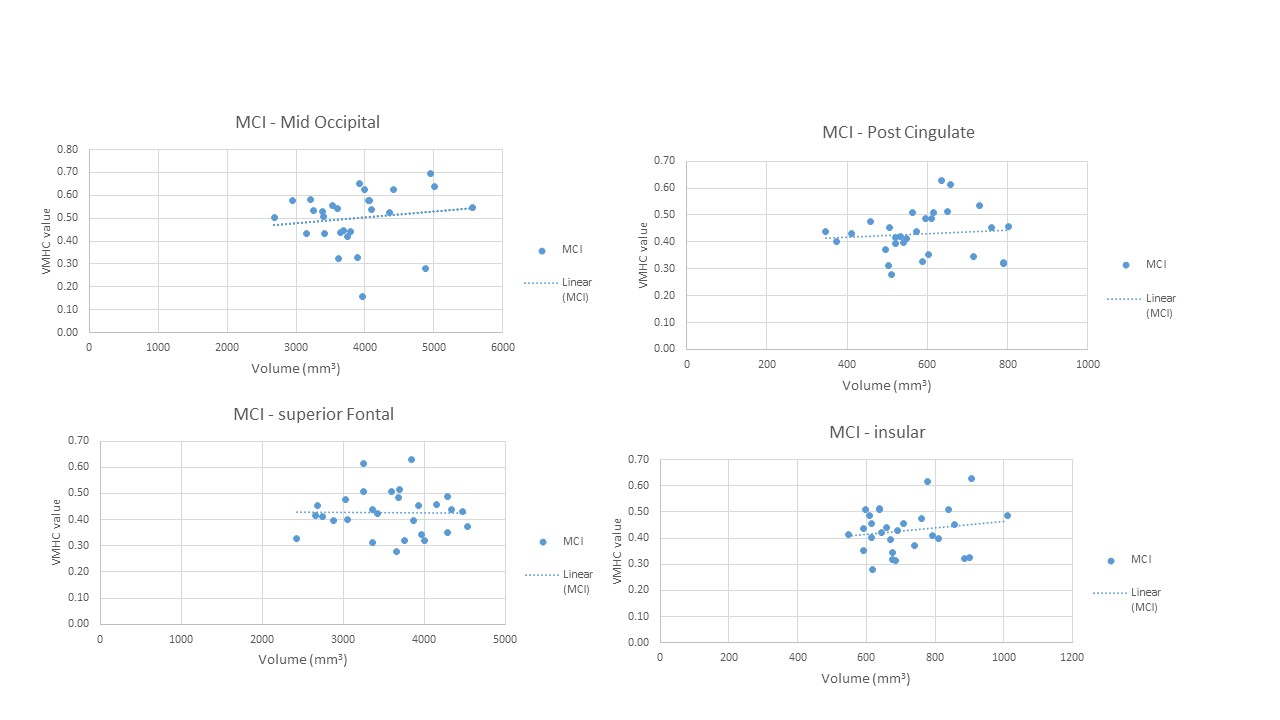
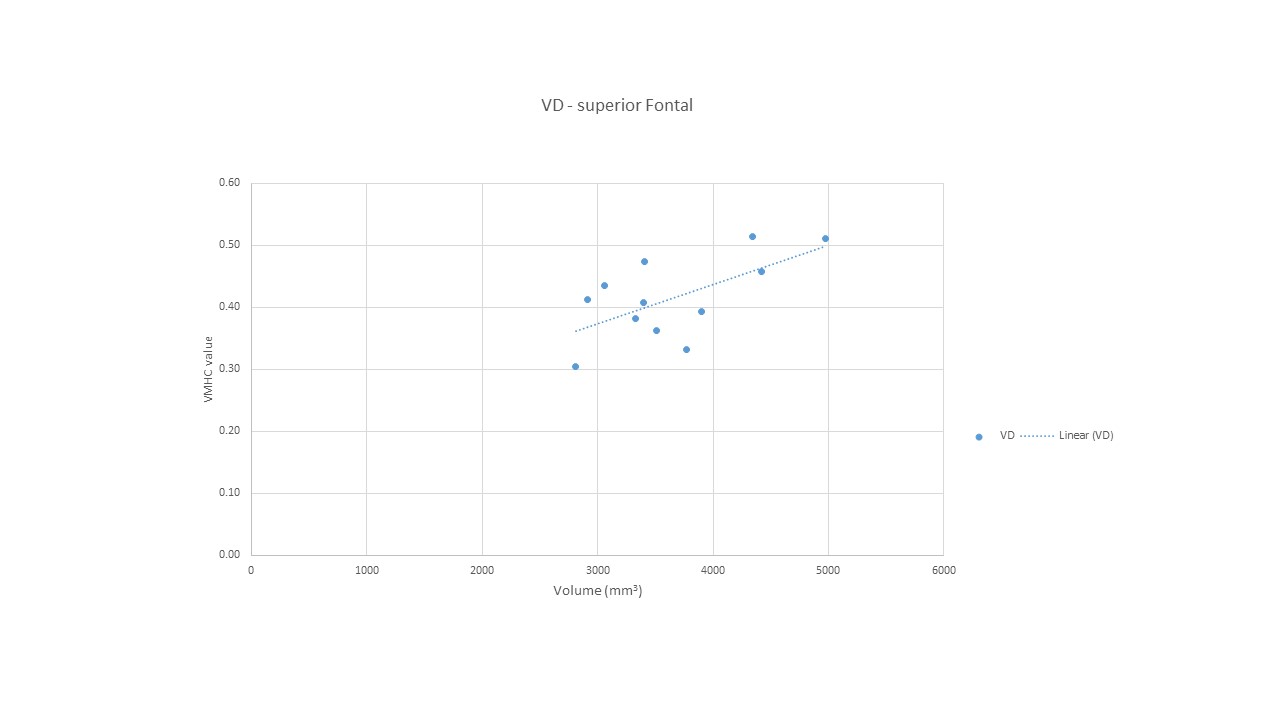
In correlation analysis between brain volume and corresponding interhemispheric functional connectivity, For AD, there is only one region – middle occipital gyrus showed significant positive correlation with between its volume and VMHC value, with r=0.692 (p=0.009); For MCI, there are four regions showed significant correlation with between its volume and VMHC value. For positive correlation, they are middle occipital gyrus with r=0.453 (p=0.023) and superior frontal gyrus with r=0.418 (p=0.028). For negative correlation, they are posterior cingulate with r=-0.464 (p=0.019) and Insular with r=-0.483 (p=0.028). For VD, only superior frontal gyrus showed significant positive correlation between its volume and VMHC value, with r=0.667 (p=0.05).
Conclusion
The findings demonstrated that brain atrophy is significant in AD and VD, and VD showed enlarged ventricles compared to HC. MCI showed less severe brain atrophy when compared to AD and VD towards HC. Also, the brain regional volume correlate to interhemispheric functional connectivity positively in AD and VD, suggested that attenuated IFC is related to brain atropy. For MCI, negative correlation were found that precuneus and insular, suggested that there is an increase in brain regional volume to compensate the reduction in IFC in these regions, where are the hub of default mode network.Acknowledgements
This study was supported by the State Key Laboratory of Brain and Cognitive Science, the University of Hong Kong.References
[1] N. Fayed, P. J. Modrego, G. R. Salinas, and J. Gazulla, “Magnetic resonance imaging based clinical research in Alzheimer’s disease,” J. Alzheimers Dis. JAD, vol. 31 Suppl 3, pp. S5-18, 2012, doi: 10.3233/JAD-2011-111292.
[2] P. Scheltens, N. Fox, F. Barkhof, and C. De Carli, “Structural magnetic resonance imaging in the practical assessment of dementia: beyond exclusion,” Lancet Neurol., vol. 1, no. 1, pp. 13–21, May 2002, doi: 10.1016/S1474-4422(02)00002-9.
[3] B. Dubois et al., “Research criteria for the diagnosis of Alzheimer’s disease: revising the NINCDS-ADRDA criteria,” Lancet Neurol., vol. 6, no. 8, pp. 734–746, Aug. 2007, doi: 10.1016/S1474-4422(07)70178-3.
[4] C. Kelly et al., “Reduced interhemispheric resting state functional connectivity in cocaine addiction,” Biol. Psychiatry, vol. 69, no. 7, pp. 684–692, Apr. 2011, doi: 10.1016/j.biopsych.2010.11.022.
[5] X.-N. Zuo et al., “Growing Together and Growing Apart: Regional and Sex Differences in the Lifespan Developmental Trajectories of Functional Homotopy,” J. Neurosci., vol. 30, no. 45, pp. 15034–15043, Nov. 2010, doi: 10.1523/JNEUROSCI.2612-10.2010.
Figures