2142
Assessment of White Matter Atrophy in Multiple Sclerosis Using Advanced Diffusion Weighted Imaging Models
Loredana Storelli1, Elisabetta Pagani1, Paolo Preziosa1,2, Massimo Filippi1,2,3,4,5, and Maria A. Rocca1,2,5
1Neuroimaging Research Unit, Division of Neuroscience, IRCCS San Raffaele Scientific Institute, Milan, Italy, 2Neurology Unit, IRCCS San Raffaele Scientific Institute, Milan, Italy, 3Neurorehabilitation Unit, IRCCS San Raffaele Scientific Institute, Milan, Italy, 4Neurophysiology Service, IRCCS San Raffaele Scientific Institute, Milan, Italy, 5Vita-Salute San Raffaele University, Milan, Italy
1Neuroimaging Research Unit, Division of Neuroscience, IRCCS San Raffaele Scientific Institute, Milan, Italy, 2Neurology Unit, IRCCS San Raffaele Scientific Institute, Milan, Italy, 3Neurorehabilitation Unit, IRCCS San Raffaele Scientific Institute, Milan, Italy, 4Neurophysiology Service, IRCCS San Raffaele Scientific Institute, Milan, Italy, 5Vita-Salute San Raffaele University, Milan, Italy
Synopsis
When investigating white matter (WM), its complex microstructure should be considered. Neurite Orientation Dispersion and Density Imaging (NODDI) and the constrained spherical deconvolution (CSD) are diffusion weighted imaging models that account for this complexity, compared to the commonly used MRI techniques. In this study, we applied volumetric, diffusion tensor, NODDI and CSD models to 86 patients with multiple sclerosis and 55 healthy controls at baseline and after 1-year of follow-up. The comparison of these techniques both globally and voxel-based showed that the CSD model was able to identify WM atrophy offering greater anatomical specificity and biological interpretability.
Introduction
Neurodegeneration is a significant pathological hallmark of multiple sclerosis (MS).1 Using MRI, gray matter (GM) atrophy demonstrated its prognostic value for the clinical evolution of the disease in respect to white matter (WM) atrophy.2-4 However, WM damage has been mainly assessed using volumetric measures or the diffusion tensor (DT) MRI model.5-7 In recent years, more advanced diffusion weighted imaging (DWI) models have been proposed to study the complex WM microstructure: Neurite Orientation Dispersion and Density Imaging (NODDI) and the constrained spherical deconvolution (CSD).8, 9 Aims of this study were: to study WM atrophy both cross-sectionally and longitudinally with advanced DWI techniques; to assess whether these new measures of WM atrophy would better explain clinical disability in comparison with the conventionally used metrics.Methods
86 patients with MS (43 relapsing-remitting [RR], 32 secondary progressive [SP] and 11 primary progressive MS) and 55 sex-matched healthy controls (HC) were enrolled. 60 MS and 22 HC performed a follow-up re-evaluation after one year from the inclusion. Brain 3D FLAIR, 3D T1-weighted MPRAGE and a multi-shell DWI were acquired at baseline and follow-up on a 3T Philips scanner, together with a clinical assessment. Pre-processing of DWI included correction for off-resonance, eddy current induced distortions and movement.10 The DT was estimated by linear regression using DWI data at b=700 and 1000 s/mm2, and maps of fractional anisotropy (FA) and mean diffusivity (MD) were derived.11 For NODDI model, intra- and extracellular volume fraction maps were computed, using the NODDI Matlab Toolbox and default parameters (http://www.nitrc.org/projects/noddi_toolbox).12 The intra-cellular volume (vic) was estimated according to:$$vic=(1-fiso )*ficvf $$
where fiso and ficvf were respectively the isotropic and intracellular volume fraction maps; while the extracellular volume fraction was computed as:
$$vec=(1-fiso )*(1-fic)$$
A fixel-based morphometry analysis was applied to estimate voxel-wise fiber bundle cross-section atrophy (FC) in MS patients against HC (http://www.mrtrix.org/).13 Each subject’s fiber orientation distribution (FOD) image was registered to the template (obtained by 10 HC and 10 age- and sex-matched RRMS) via an FOD-guided non-linear registration. For each fiber in the template mask, the overall volume change (Jacobian determinant) was estimated, giving the expansion or contraction in the perpendicular plane (FC). For both baseline and follow-up, we obtained global measures of WM damage (WM volume [WMV], FA, MD, vic, FC) averaged within the normal appearing WM of each subject, as well as voxel-based maps. All statistical comparisons were performed between HC and MS, HC and RRMS, RRMS and SPMS.
Results
Global MRI metrics showed lower brain tissue volumes and significantly altered DW metrics in MS compared to controls (p<0.001). These significant differences were also detectable in the comparisons among the different subgroups (HC vs RRMS, RRMS vs SPMS). In RRMS compared to HC, we found a significant FC atrophy of the cortico-spinal tract, splenium of the corpus callosum, optic radiation and the left cingulum (p-value<0.05, Figure 1). A significant FC reduction was found in SPMS compared to RRMS patients mainly in the middle cerebellar peduncles, cortico-spinal tract, splenium of the corpus callosum, anterior commissure and bilateral cingulum (p-value<0.05, Figure 1). All MS patients exhibited significant decreases in FA and increases in MD (p-value<0.05) in WM regions mainly associated with WM lesions (periventricular WM and corpus callosum), similarly to the Vic measure (although more circumscribed), as shown in Figure 2. The voxel-based morphometry showed significant WM atrophy of the splenium of the corpus callosum and the brainstem in MS compared to HC. However, FA, MD, vic and WMV showed no significant alterations when considering HC vs RRMS, RRMS vs SPMS. Only the global measure of FC identified a significant longitudinal WM atrophy in MS (p-value<0.05), even when considering the different phenotypes. Voxel-based analyses at follow-up confirmed the baseline results (Figures 3 and 4), with a degeneration mainly located in the splenium of the corpus callosum, anterior commissure and cingulum in progressive MS patients. Globally, only FA and FC showed a significant correlation (R=-0.55 and -0.4 respectively) with the Expanded Disability Status Scale (EDSS), both at baseline and at follow-up.Discussion
Advanced DWI methods could be applied in MS for a fiber-specific study of the complex WM microstructure. Considered voxel-averaged in the WM, vic and FC did not show significant improvements in diversifying HC and MS patients (even when considering different subgroups). However, in the assessment of longitudinal variations, only FC measure was able to reveal a significant global WM degeneration in MS patients compared to HC, associated to disability. On the other hand, voxel-based analyses clearly confirmed the ability of the FC measure to detect atrophy in more specific and meaningful WM tracts (both at baseline and follow-up), in respect to the other measures. By applying this diffusion method, it was possible to identify and compare specific fiber-bundle atrophy quantitatively between groups.Conclusions
The application of advanced DWI methods showed the presence of WM neurodegeneration since the early stages of MS. In particular, the fiber-based findings allowed substantial atrophy changes to be detected and offered greater anatomical specificity and biological interpretability by identifying tract-specific differences.Acknowledgements
Funding. This study has been partially supported by FISM—Fondazione Italiana Sclerosi Multipla—cod. 2018/R/16 and financed or cofinanced with the “5 per mille” public fundingReferences
1. Lassmann H. Multiple Sclerosis Pathology. Cold Spring Harb Perspect Med 2018;8. 2. Damjanovic D, Valsasina P, Rocca MA, et al. Hippocampal and Deep Gray Matter Nuclei Atrophy Is Relevant for Explaining Cognitive Impairment in MS: A Multicenter Study. AJNR Am J Neuroradiol 2017;38:18-24. 3. Roosendaal SD, Bendfeldt K, Vrenken H, et al. Grey matter volume in a large cohort of MS patients: relation to MRI parameters and disability. Mult Scler 2011;17:1098-1106. 4. Filippi M, Preziosa P, Copetti M, et al. Gray matter damage predicts the accumulation of disability 13 years later. Neurology 2013;81:1759-1767. 5. Parisi L, Rocca MA, Mattioli F, et al. Patterns of regional gray matter and white matter atrophy in cortical multiple sclerosis. J Neurol 2014;261:1715-1725. 6. Pierpaoli C, Barnett A, Pajevic S, et al. Water diffusion changes in Wallerian degeneration and their dependence on white matter architecture. Neuroimage 2001;13:1174-1185. 7. Rocca MA, Parisi L, Pagani E, et al. Regional but not global brain damage contributes to fatigue in multiple sclerosis. Radiology 2014;273:511-520. 8. Jeurissen B, Tournier JD, Dhollander T, Connelly A, Sijbers J. Multi-tissue constrained spherical deconvolution for improved analysis of multi-shell diffusion MRI data. Neuroimage 2014;103:411-426. 9. Roine T, Jeurissen B, Perrone D, et al. Informed constrained spherical deconvolution (iCSD). Med Image Anal 2015;24:269-281. 10. Andersson JLR, Graham MS, Drobnjak I, Zhang H, Filippini N, Bastiani M. Towards a comprehensive framework for movement and distortion correction of diffusion MR images: Within volume movement. Neuroimage 2017;152:450-466. 11. Behrens TE, Woolrich MW, Jenkinson M, et al. Characterization and propagation of uncertainty in diffusion-weighted MR imaging. Magn Reson Med 2003;50:1077-1088. 12. Schneider T, Brownlee W, Zhang H, Ciccarelli O, Miller DH, Wheeler-Kingshott CG. Sensitivity of multi-shell NODDI to multiple sclerosis white matter changes: a pilot study. Funct Neurol 2017;32:97-101. 13. Raffelt DA, Tournier JD, Smith RE, et al. Investigating white matter fibre density and morphology using fixel-based analysis. Neuroimage 2017;144:58-73.Figures
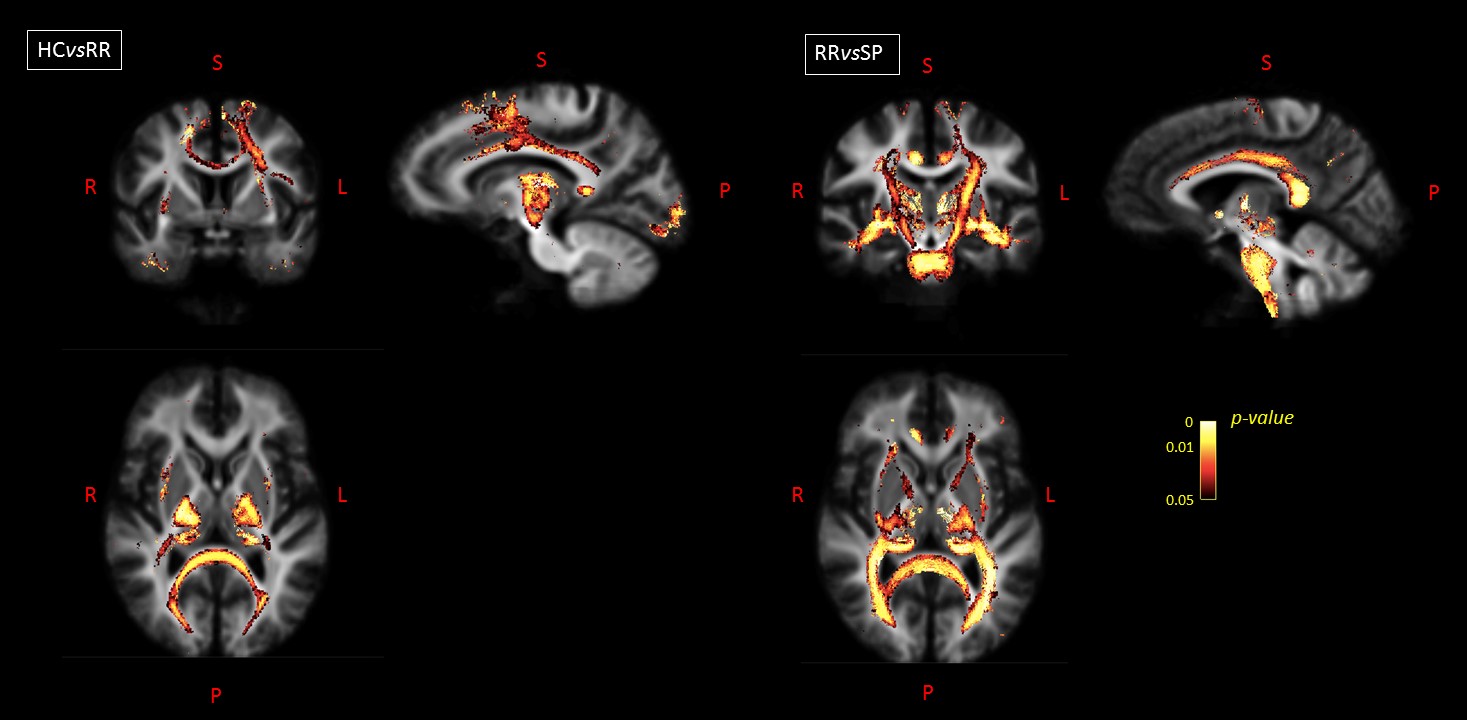
Figure
1. For baseline
visit: on the left, fibers with a significantly decreased FC value in RRMS
patients compared to HC are shown in axial, sagittal and coronal sections, with
fixels colored by FWE-corrected p-value.
On the right, fibers with a significantly decreased FC value in SPMS compared
to RRMS patients are shown in axial, sagittal and coronal views. HC=healthy
controls; RR=relapsing-remitting; SP=secondary progressive; R=right; L=left;
S=superior; P=posterior.
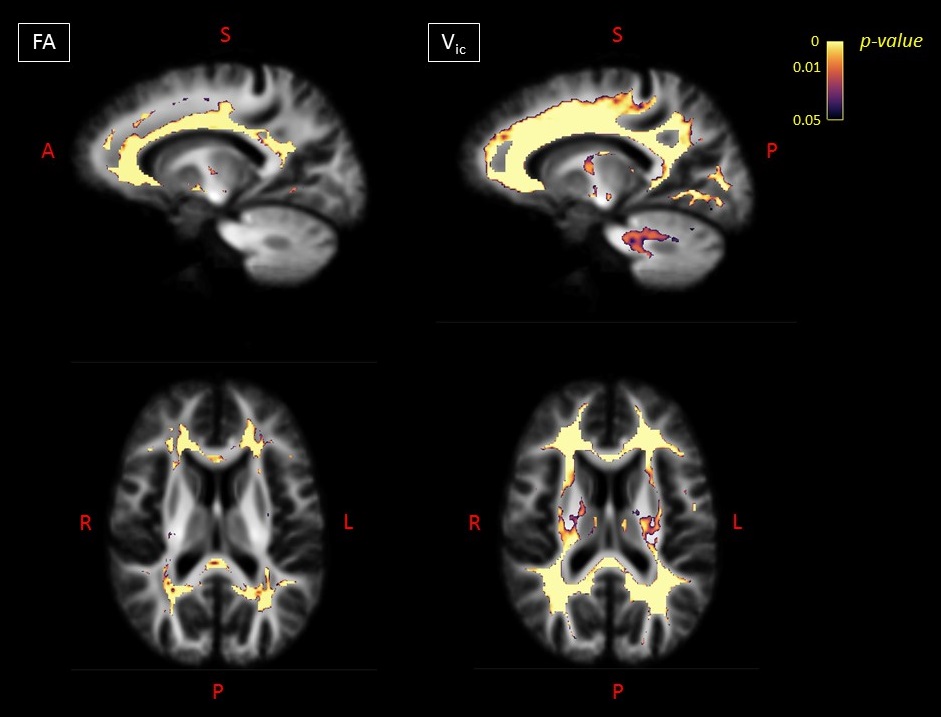
Figure
2. For baseline
visit: on the left, voxels exhibiting a significant (FWE-corrected p-value < 0.05) decrease in FA in MS
patients compared to HC in sagittal and axial views. On the right, voxels
exhibiting a significant (FWE-corrected p-value
< 0.05) decrease in vic in MS patients compared to HCs in
sagittal and axial views. FA=fractional anisotropy; Vic=intra-cellular
volume; A=anterior; S=superior; P=posterior; R=right; L=left.
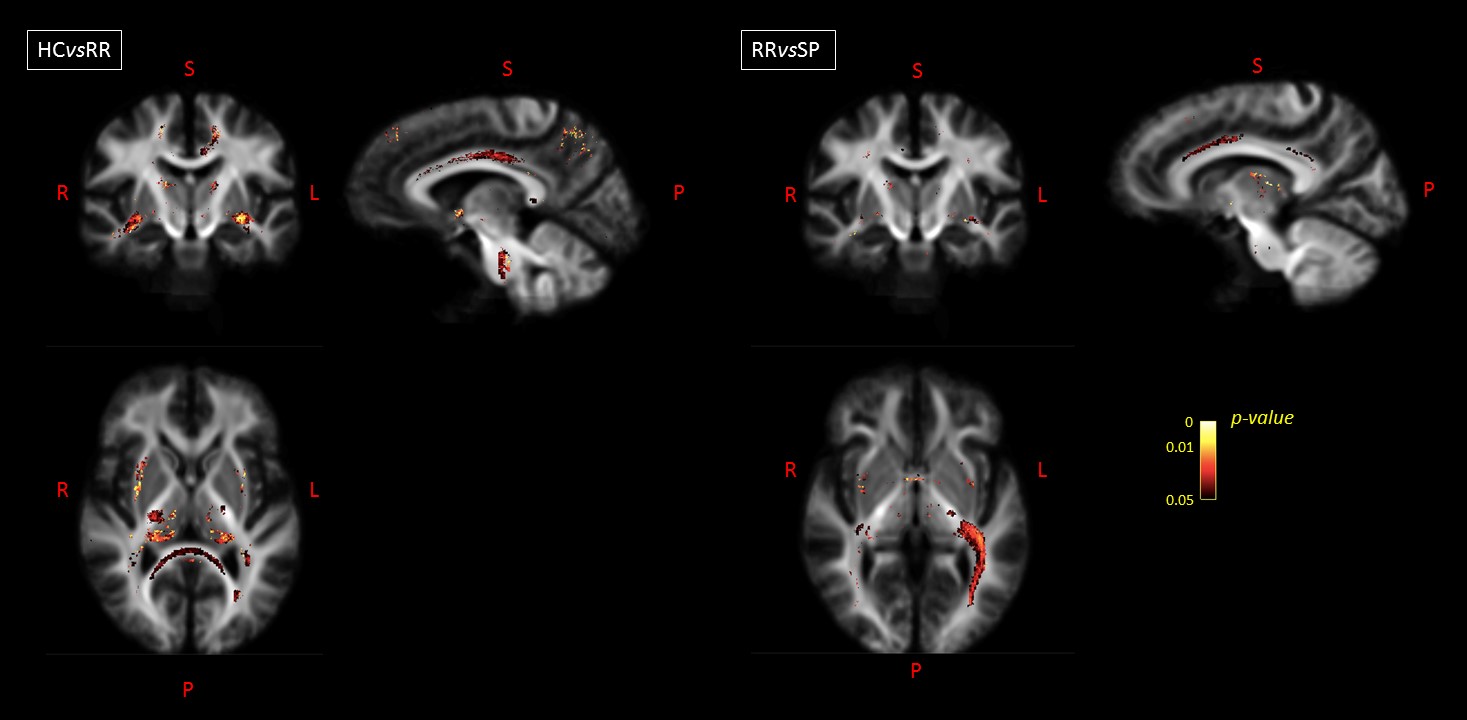
Figure
3. Longitudinal
variations: on the left, fibers with a significantly decreased FC value in RRMS
patients compared to HC are shown in axial, sagittal and coronal sections, with
fixels colored by FWE-corrected p-value.
On the right, fibers with a significantly decreased FC value in SP compared to RR
MS patients are shown in axial, sagittal and coronal views. HC=healthy controls;
RR=relapsing remitting; SP=secondary progressive; R=right; L=left; S=superior;
P=posterior.
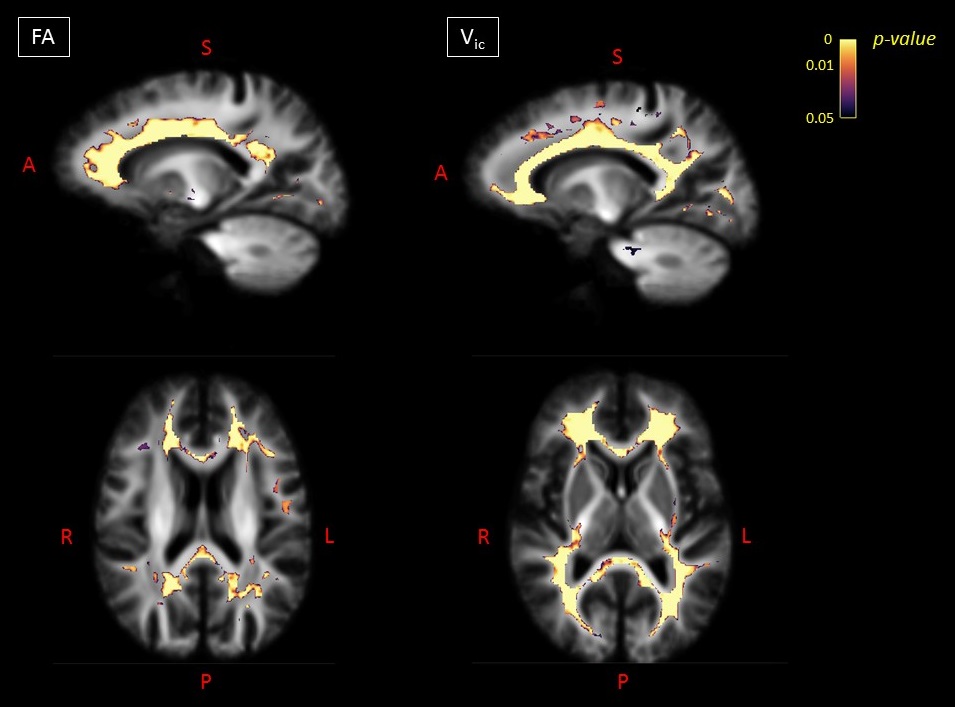
Figure
4. For the
follow-up visit: on the left, voxels exhibiting a significant
(FWE-corrected p-value < 0.05)
decrease in FA in MS patients compared to HC in sagittal and axial views. On
the right, voxels exhibiting a significant (FWE-corrected p-value < 0.05) decrease in vic in MS patients
compared to HCs in sagittal and axial views. FA=fractional anisotropy; Vic=intra-cellular
volume; A=anterior; S=superior; P=posterior; R=right; L=left.