2141
Regional Liver Function Pre- and Post-Resective Liver Surgery in Patients
Christian Simonsson1,2, Markus Karlsson1, Nils Dahlström1, Peter Lundberg1,2, Wolf Claus Bartholomä1,2, Gunnar Cedersund2,3, Per Sandström4, and Anna Lindhoff Larsson34
1Department of Radiation Physics, Radiology, Linköping University, Linköping, Sweden, 2Center for Medical Image Science and Visualization (CMIV), Linköping University, Linköping, Sweden, 3Department of Medical Engineering, Linköping University, Linköping, Sweden, 43Department of Surgery, Department of biomedical and clinical sciences, Linköping University, Linköping, Sweden
1Department of Radiation Physics, Radiology, Linköping University, Linköping, Sweden, 2Center for Medical Image Science and Visualization (CMIV), Linköping University, Linköping, Sweden, 3Department of Medical Engineering, Linköping University, Linköping, Sweden, 43Department of Surgery, Department of biomedical and clinical sciences, Linköping University, Linköping, Sweden
Synopsis
A range of severe liver diseases are identified only in very late stages. At a late stage, the only remaining treatment may be resective liver surgery. The resection can lead to serious complications if the remnant tissue fails to match the requirement of liver function. Therefore, it is valuable to accurately measure both regional and global liver function to better predict the outcome of the surgery. Here we use DCE-MRI to show that there are differences in Gadoxetate uptake both between patients and regional difference between the adjacent segments before and after resective surgery.
Introduction
A range of severe liver diseases are identified only in very late stages, and they are associated with relatively subtle clinical symptoms. At a late stage, the only remaining treatment may be resective liver surgery. The resection can lead to serious complications if the remnant tissue fails to match the requirement of liver function. Therefore, it is valuable to accurately measure both regional and global liver function to better predict the outcome of the surgery. Here, we investigated to possibility of using DCE-MRI to better describe regional liver function measured using gadoxetate contrast agent uptake in each segment, pre- and post- resective surgery for patients with different forms of liver cancer.Methods
Patients were aged 42-76 y, BMI ranged between 22-30. The subjects had a wide range of conditions, including metastases (HCC, B-cell lymphoma, colon, rectal, and medullary thyroid cancer, etc.), and thus resective surgery ranged from relatively minor to extended procedures. Four patients obtained postoperative chemotherapy, one recurrence, and the 90 days mortality in the cohort was two.Patients (n=13 fasting) with liver tumours were examined by MRI within 3-5 days of resective surgery using DCE-MRI, following a bolus injection of a hepatocyte specific contrast agent Gd-EOB-DTPA (Gadoxetate). Many of these very ill patients declined to perform a post-surgical research examination due to a very heavy physical and mental load, nevertheless four of the patients were examined within 3-5 days after surgery. The local ethics committee approved this study, and written informed consent was obtained from all patients.
To further investigate the hepatocyte uptake function, we trained our previously published mechanistic model [1] of hepatocyte Gadoxetate uptake on the R1 data (converted to Gadoxetate concentration) for each patient. For each patient, the model was trained to fit data for all Couinaud segments (and also the mean of three spleen ROIs) using a ‘non-linear mixed effect’ (NLME) approach. The model could then quantify the influx (kin) and efflux (keff) of Gadoxetate for each segment for all patients. As a comparison, we also used a phenomenological measure of late hepatobiliary uptake and blood plasma clearance. Signal intensity (SI) measurements from liver (from ROIs in each of the eight Couinaud segments) and three spleen ROIs were used to calculate the quantitative liver-spleen contrast ratio LSC, see Eq. 1, for t= 10 or 20 minutes after Gadoxetate injection.
LSC = SIliver(t)/ SIspleen(t) (Eq.1)
Results
The analysis using the uptake-model as well as the LSC calculation (see Fig 5) was done for all 13 patients. The patients (denoted pat1-4) that underwent the post-surgery MRI had different kinds of resections; Pat1 underwent extended (Fig2), Pat2 underwent major and Pat3-4 underwent minor resections. Shown in Fig 3 is the uptake-model fit to each patient using the individual time-resolved hepatocyte Gadoxetate concentration data. As is shown, the dynamic profiles were very different between patients, but they also varied between the pre (green) and post (orange) examinations. For the post-surgery the hepatocyte Gadoxetate concentration seems to be higher especially for Patients 1 and 2, which reflected the large extent of these resections. The differences can also be seen in Fig 1d, showing higher bilirubin concentration post-resection for Pat1. For Pat1 differences of Gadoxetate concentration in segments 6-7 is much lower in the pre-resective data.Shown in Fig 4 is a comparison between influx kin of hepatocyte Gadoxetate for pre- and-post surgery. The parameter-value of kin for pat1-2 decreased significantly between pre-and post-surgery. The same pattern can be observed in Fig 5 showing a decrease in the liver- to spleen contrast ratio (LSC) measurement both using the 10- and 20-min images for all patients Pat(1-4). Shown in figure 4, in white dots in the ‘Pre-column’ is all the patients the only did the pre-surgery MRI investigation.
Discussion
Differences could be observed between pre- and post-surgical examinations using both methods. The LSC measurements in particular showed a downward trend for all patients. The same behavior could be observed in Pat1-2 for the influx rate parameter, but not in pat3 and 4. The dynamics and amount of Gadoxetate uptake was very much related the volume of resection. The difference in the dynamic behavior of the uptake is particularly interesting, for example the post-surgery data for pat1 peaks early and then hits low plateau which is very different from pre-surgery data at which a plateau was reached more slowly. This we interpret as a faster release reflected by the efflux (keff) which was magnitudes higher for pat1 post-surgery. Also, an additional observation was that the co-transporter bilirubin seems to be inversely correlated to hepatocyte Gadoxetate concentration. Gadoxetate and bilirubin uses the same hepatocyte transporter (OATP1) to which bilirubin has higher transport affinity. High bilirubin therefore contributes to the observed lower Gadoxetate concentration in patients, which underwent more severe resections, or that had a poor uptake at baseline.In conclusion, we have observed dramatic differences between pre- and post surgery depending on the severity of disease as well as the extent of surgery. Moreover, to gain additional understanding of the differences in uptake dynamics between patients and segments, the model could be developed by adding additional effects on transport, such as bilirubin uptake via OATP1.
Acknowledgements
No acknowledgement found.References
[1] Forsgren MF, Karlsson M, Dahlqvist Leinhard O, Dahlström N, Noren B, Romu T, Ignatova S, Ekstedt M, Kechagias S, Lundberg P, Cedersund G, Model-inferred mechanisms of liver function from magnetic resonance imaging data: Validation and variation across a clinically relevant cohort. PL oS Comp Biol, June 2019.Figures
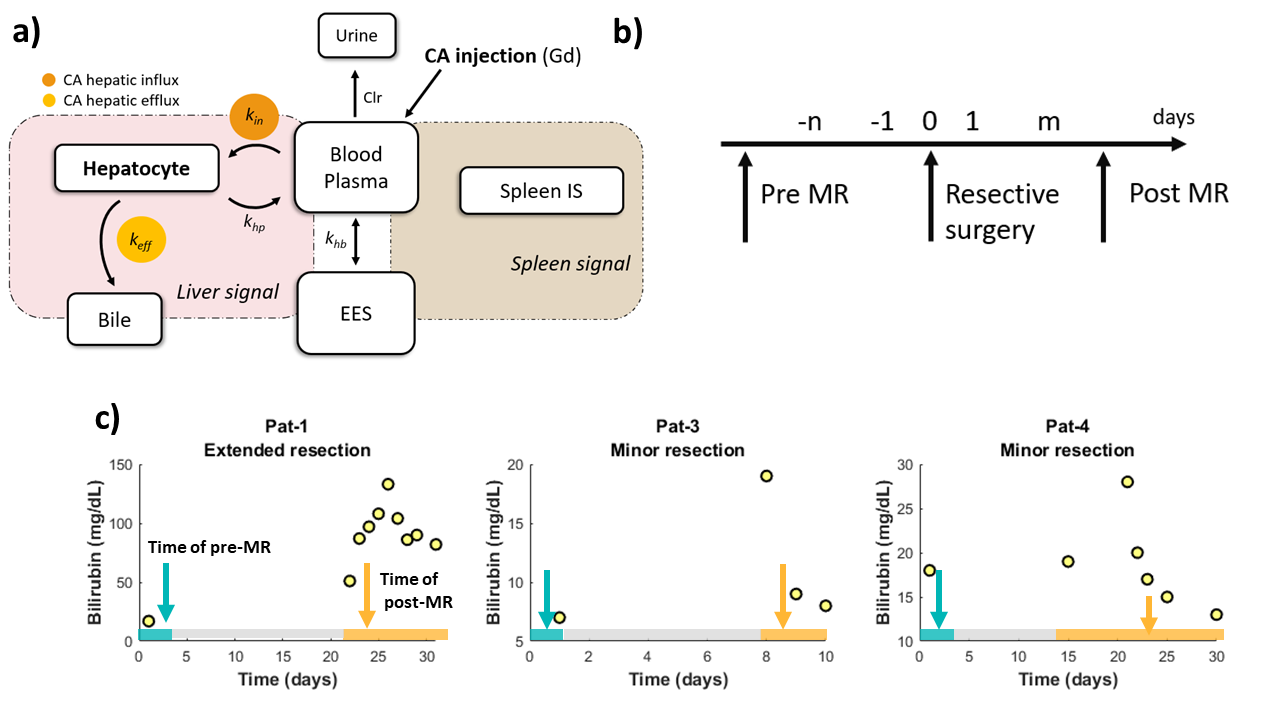
Fig 1. a) The mechanstic Gadoxetate
uptake model. Shown here, is a schematic over the model structure. The kin and keff model parameters represent the hepatic influx and efflux and are highlighted in orange. b) The study setup. Showing the time-points for the pre- and post resective surgery MRI examinations. c) Showing serum level blirubin for three of the patients that underwend both the pre- and post resective surgery MRI examinations.
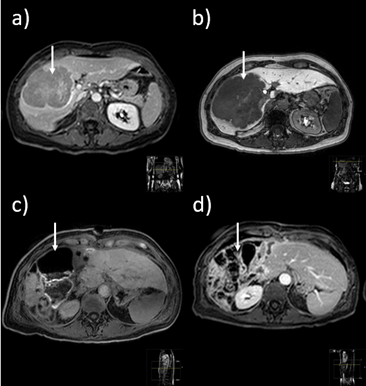
Fig 2. DCE-MRI images for the patients (pat1) that underwend extended resctive surgery. a) Anatomy image pre-resective surgery. b) Pre-resective surgery DCE-MRI image 3 minutes after bolus injection of Gadoxetate. c) Post-resective surgery DCE-MRI image 23 minutes after bolus injection of Gadoxetate. Here we can see that a large resection have been made. d) Post-resective surgery DCE-MRI image 3 minutes after bolus injection of Gadoxetate.
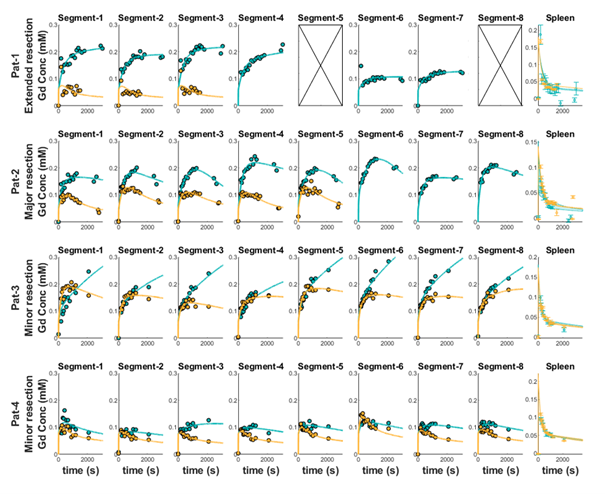
Fig 3. The Gadoxetate
uptake model fitted to hepatic Gadoxetate concentration data (calculated from DCE-MRI images) for the four patients that underwent both pre- and post resective surgery MRI examinations. The model simulation are the green line (pre-surgery) and the orange line (post-surgery). The datapoints are green (pre-surgery) and orange (post-surgery). The column to the far right is the model fit to the mean spleen data for each of the four patients.
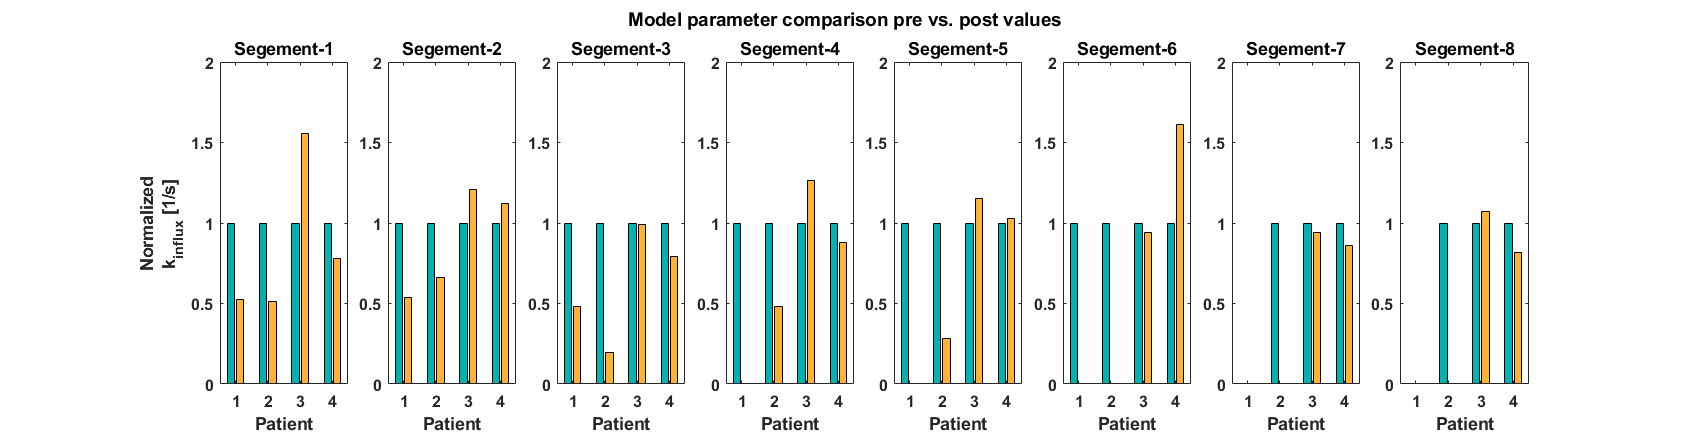
Fig 4. Comparison of the kin parameter values for each segemnt for pre and post resective surgery.
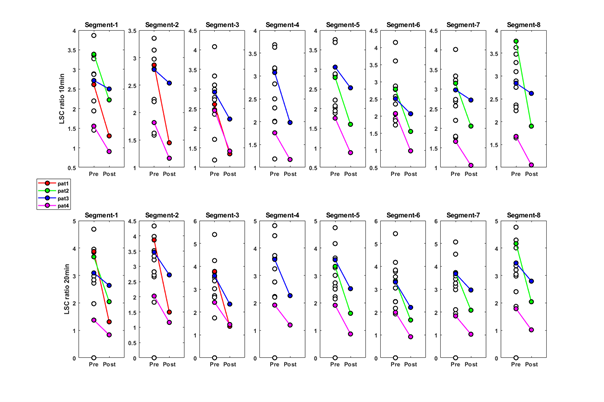
Fig 5. The quantitative
liver-spleen contrast ratio LSC calculated for all patients at 10 and 20 minutes. The colored dots and lines depicts the change in LSC values for the four patients that underwent both pre- and post resective surgery MRI examinations. As can be seen there is an reduction in LSC value for all four patients after surgery. The white dots represent the patients that only underwent the pre-resective surgery MRI examination.