2140
Study of Gd-EOB-DTPA T1mapping in quantitatively staging hepatic fibrosis in a rabbit model1Department of Radiology, third Affiliated Hospital of Soochow University & Changzhou First People's Hospital, Changzhou, China, 2Philips Healthcare, Shanghai, China
Synopsis
To explore parameters obtained by Gd-EOB-DTPA T1 mapping and extracellular volume fraction in evaluating hepatic fibrosis (HF) in a rabbit model. The HF model was established by carbon tetrachloride (CCl4).Rabbits underwent pathological examination to determine the HF stage using the metavir classification system. Parameters including T1native, T110 min, T120 min, ECV10 min and ECV20 min were measured and compared among the different HF stages using spearman correlation coefficients and receiver operating characteristic curve. The AUC of T120 min was higher than that of other quantitative parameters. T1 mapping parameters and ECV fraction are closely associated with HF progression.
Introduction
HF( hepatic fibrosis)is the common basis of chronic liver disease[1]. Although liver biopsy is the gold standard for clinical diagnosis of HF, 25%-40% of patients will have pain, 0.3%-0.6% of patients will have bleeding, and severe cases can even lead to death[2]. (gadolinium ethoxybenzyl diethylenetriamine pentaacetic acid, Gd-EOB-DTPA) has both extracellular space and hepatocyte contrast agent characteristics [3]. Gd-EOB-DTPA T1 mapping can not only reflect the distribution of contrast agent by directly measuring the change of T1 value before and after enhancement, but also reflect the change of extracellular volume by indirectly measuring the change of extracellular volume fraction (ECV) during HF[4-5]. This study intends to explore the value of Gd-EOB-DTPA T1 mapping imaging technology quantitatively evaluate HF.Methods
Animal modelOne hundred rabbits were randomly divided into two groups: the HF group (n=80) and the control group (n=20). The HF model was established by carbon tetrachloride (CCl4) in our experiments, whereas control rabbits received a subcutaneous injection of normal saline.
MRI experiment
MR scan using Philips Ingenia 3.0 T superconducting magnetic resonance scanner. At the 4th, 5th, 6th, and 15th weekends, 20 rabbits in the HF group and 5 rabbits in the control group were randomly selected for axial liver MRI scan: ①Axial T1WI; repetition time/echo time=400/18 ms, flip angle=90 °, layer thickness = 4 mm, layer spacing = 0.4 mm. ②Using the modified Look-Locker sequence to obtain T1 mapping images before enhancement and 10 and 20 minutes after enhancement: repetition time/echo time = 3/1 ms, flip angle = 20°, layer thickness = 4 mm, layer spacing = 0.4 mm.
Data analysis
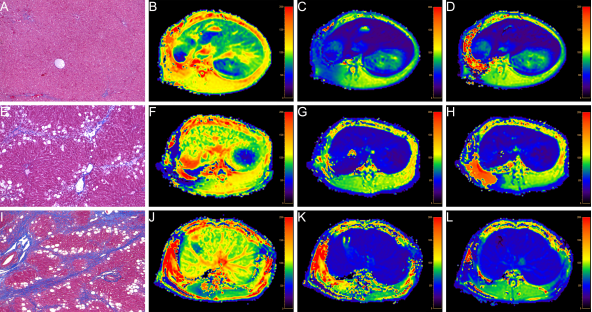
All images are transmitted to the Philips workstation. Two doctors in the field of abdominal imaging research independently analyze MR images under the premise of double-blind. In case of differences, they will be resolved through discussion. After avoiding hepatic blood vessels, bile ducts, and liver edges on the T1native, T110 min, and T120 min images, delineate ROIs on the left, middle, and right lobes of the liver. The area of the ROI is 15-20 mm2. The average value of the obtained parameters is used as the final liver Quantitative parameter values of T1native, T110 min, and T120 min. Finally, obtain the ECV parameter value through the formula, ECV=(1/LT1post-1/LT1native)/(1/AT1post-1/AT1native)×(1-HCT), where T1native is the liver T1 value before enhancement, and T1post is the post-enhancement (10, 20 min) T1 value, AT1native is the T1 value before abdominal aorta enhancement, AT1post is the T1 value after abdominal aorta enhancement (10, 20 min), and HCT is hematocrit.
All statistical analyses were performed in SPSS and MedCalc software. Kolmogorov-Smirnov test whether the measurement data conform to the normal distribution. Spearman correlation was used to analyze the correlation between the quantitative parameter values (T1native, T110 min, T120 min, ECV10 min, ECV20 min) and HF staging. The LSD method of one-way analysis of variance was used to compare the differences in quantitative parameter values between HF stages. The ROC curve method was used to analyze the value of each quantitative parameter in the differential diagnosis of HF. P<0.05 means the difference is statistically significant.
Results
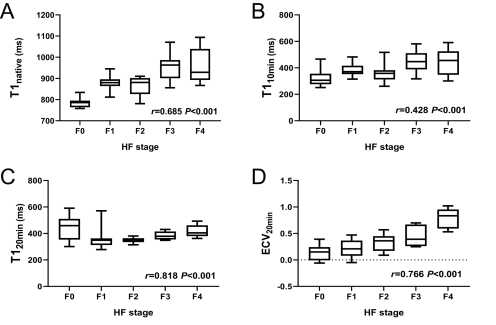
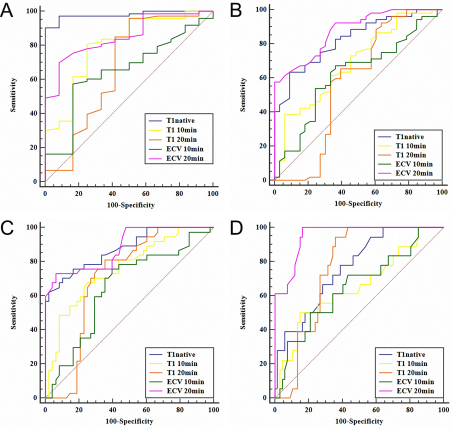
T120 min and ECV20 min were significantly positively correlated with the progression of HF (r=0.818, 0.766, P<0.001), T1native and T110 min had a moderate positive correlation with the progression of HF (r=0.685, 0.428, P<0.001), and ECV10 min showed a weak correlation (r=0.278, P=0.01). Except for the F1 vs F2 and F3 vs F4 phases, the T1native differences in the other HF groups were statistically significant (P<0.05). There was no significant difference in T110 min in F0 vs F2, F1 vs (F2, F3, F4), and F3 vs F4 (P>0.05). The difference in T110 min in the other groups was statistically significant (P<0.05); T120 min can effectively identify the rest of the HF groups except F0 vs F1; except for the significant difference in ECV10 min in F0 vs F4 (P<0.05), there is no statistically significant difference in ECV10 min in the other groups. For the ECV20 min value, except for the F0 vs F1, F2 vs F3 stage ECV20 min value, there was a statistical difference (P>0.05), and the ECV20 min value of the other groups were statistically significant (P<0.05). T120 min differential diagnosis AUC of ≥F1, ≥F2, ≥F3, ≥F4 were 0.90, 0.93, 0.93, 0.92, respectively, which were overall higher than ECV 20 min (AUC=0.85, 0.89, 0.89, 0.95) and T1native (AUC=0.98, 0.81, 0.85, 0.76), T110 min (AUC=0.80, 0.68, 0.76, 0.66) and ECV10 min (AUC=0.65, 0.65, 0.66, 0.65).Conclusion
Gd-EOB-DTPA-based enhanced T1 mapping imaging quantitative parameters and ECV values are closely related to the progress of HF, and have great diagnostic and differential diagnostic value for diagnosis and staging HF.Acknowledgements
This work was part of Surface project of National Natural Science Foundation of China (Quantification of iron deposition in diabetic nephropathy using by MRI ).References
[1] Parola M, Pinzani M. Liver fibrosis: Pathophysiology, pathogenetic targets and clinical issues[J]. Molecular aspects of medicine, 2019 ,65(2);65:37-55.
[2] Czeczok TW, Van Arnam JS, Wood LD, et al. The Almost-Normal Liver Biopsy: Presentation, Clinical Associations, and Outcome[J]. Am J Surg Pathol, 2017, 41(9):1247-1253.
[3] Ning J, Yang Z, Xie S, et al. Hepatic function imaging using dynamic Gd-EOB-DTPA enhanced MRI and pharmacokinetic modeling[J]. Magn Reson Med, 2017, 78(4):1488-1495.
[4] Heidenreich JF, Weng AM, Donhauser J, et al. T1- and ECV-mapping in clinical routine at 3 T: differences between MOLLI, ShMOLLI and SASHA[J]. BMC Med Imaging, 2019, 19(1):59.
[5] Piechnik SK, Neubauer S, Ferreira VM. State-of-the-art review: stress T1 mapping-technical considerations, pitfalls and emerging clinical applications[J]. MAGMA, 2018, 31(1):131-141.
Figures