2139
Quantitative Assessment of Liver Function by using Hepatocyte Fraction based on Gd-EOB-DTPA-Enhanced MRI1the Third People’s Hospital of Nantong, Nantong, China, 2Philips Healthcare, Shanghai, China
Synopsis
The purpose of this study was to assess the ability of hepatocyte fraction on Gd-EOB-DTPA-enhanced MRI for the quantitative evaluation of liver function. We used Look-Locker sequences to acquire T1 mapping images pre and post-contrast at 20 minutes after Gd-EOB-DTPA administration. T1 relaxation times (T1pre and T1post) of the liver, reduction rates of T1 relaxation times (rrT1), hepatocyte fraction (HeF) and KHep were measured. Our study showed that T1post, rrT1, HeF and KHep vlaues based on Gd-EOB-DTPA-enhanced T1 mapping MRI are efficient diagnostic tools for the quantitative evaluation of liver function.
INTRODUCTION
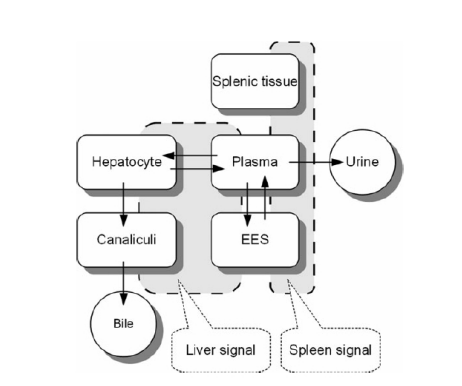
Assessment of the liver function is an essential procedure for preventing hepatic failure and for the medical management of patients with hepatic dysfunction. Gadoxetic acid (Gd-EOB-DTPA) is a hepatocyte-specific contrast agent for MRI of the liver, uptake and metabolism of Gd-EOB-DTPA is related to hepatocyte function1. The purpose of this study was to assess the ability of hepatocyte fraction on Gd-EOB-DTPA-enhanced MRI for the quantitative evaluation of liver function.Our study based on a simple pharmacokinetic model2( Fig.1) and the ΔR1 values to calculate.R1(t) = 1 / T1(t) t: time after contrast injection (min)
ΔR1 = [ R1(t) - R1(0) ]
Hepatocyte fraction (HeF) = ΔR1Hepatobilitary / (ΔR1Hepatobilitary+ΔR1BloodEES)
KHep = (ΔR1Hepatobilitary / ΔR1BloodEES) / t
rrT1=[(T1pre-T1post)/T1pre]*100%
PURPOSE
To assess the ability of hepatocyte fraction on Gd-EOB-DTPA-enhanced MRI for the quantitative evaluation of liver function.METHODS
This retrospective study included 79 patients with chronic viral hepatitis B, and divided into two subgroups by using the indocyanine green retention test (ICG R15) as follows: 51 patients with ICG R15≤20% and 28 patients with ICG R15>20%. All patients were performed non-enhanced and Gd-EOB-DTPA enhanced MRI of liver. Look-Locker sequences with exactly the same scan parameters and geometry position (the level of porta hepatis) were performed pre and post-contrast at 20 minutes after Gd-EOB-DTPA administration. Two readers independently identified and measured T1 relaxation times (T1pre and T1post) of the liver, reduction rates of T1 relaxation times (rrT1), hepatocyte fraction (HeF) and KHep, two regions of interest (ROIs) were separately placed in both lobes of the liver, then calculated the averages as the final results. Interreader agreement was evaluated by using intraclass correlation coefficient (ICC). Independent samples t test was performed to compare T1pre, T1post, rrT1, HeF and KHep values for ICG R15≤20% and ICG R15>20% groups. Pearson correlation analysis was used to analysis the correction between T1pre, T1post, rrT1, HeF, KHep values and ICG R15. ROC analyses were done to differentiate the diagnostic performance of T1pre, T1post, rrT1, HeF and KHep values between ICG R15≤20% and ICG R15>20% groups.RESULTS
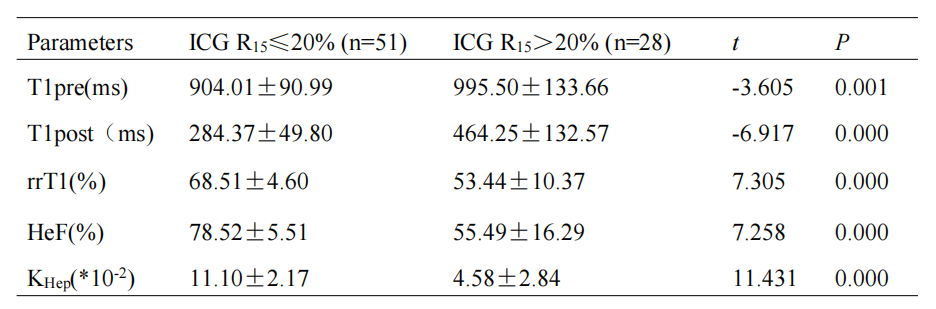
1.ICC of the two observers with T1pre, T1post, rrT1, HeF and KHep values were 0.978(0.965-0.986), 0.996(0.994-0.997), 0.996(0.994-0.997), 0.997(0.995-0.998) and 0.997(0.995-0.998), respectively. Interreader agreements were substantial to almost perfect.2.T1pre, T1post, rrT1, HeF and KHep values of ICG R15≤20% and ICG R15>20% groups were shown in table 1.
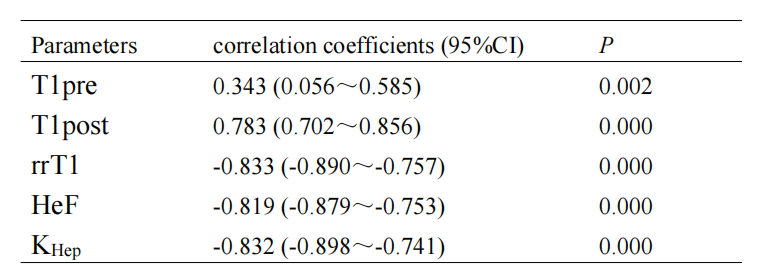
3.Correlation between T1pre, T1post, rrT1, HeF, KHep values and ICG R15 were shown in table 2.
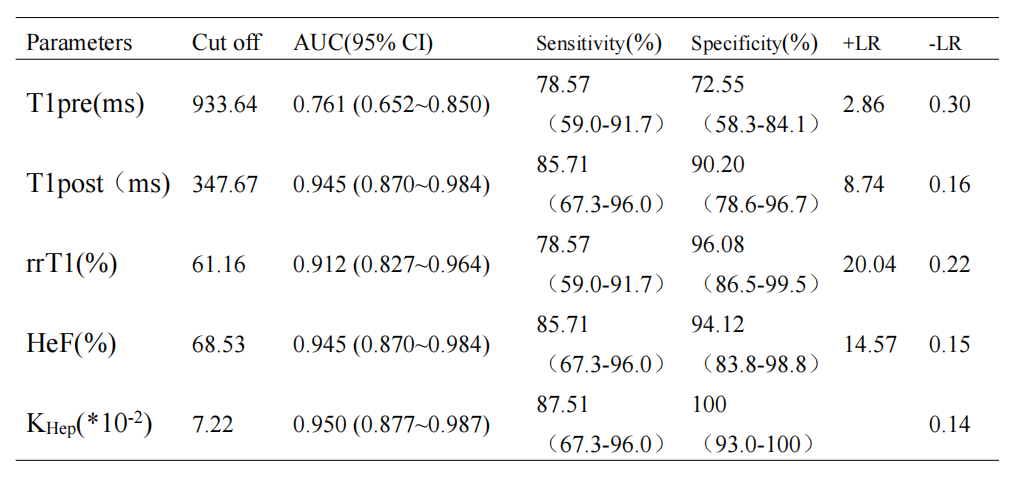
4.Diagnostic performance for T1pre, T1post, rrT1, HeF and KHep values in assessing ICG R15>20% groups by ROC analyses were shown in table 3.
The AUC of T1pre was significantly lower than other parameters (P<0.05). There were no significantly different among the AUC of T1post, rrT1, HeF and KHep (P>0.05). KHep had the highest AUC, sensitivity and specificity.
DISCUSSION
Gd-EOB-DTPA can be specifically taken up by hepatocytes and excreted through the biliary tract, the intracellular transport mechanisms of Gd-EOB-DTPA are mediated by organic anion-transporting polypeptide 1 (OATP1), the reduced Gd-EOB-DTPA uptake may be either due to a decreased number of normal hepatocytes in cirrhotic liver or due to decreased expression of OATP1 or diminished OATP1 activity on the surface of hepatocytes3-4. Hepatocyte fraction was not affected by blood and extracellular extravascular space (EES)2, reflected the ability of hepatocytes uptake and were relevant to OATP1. Previous study showed that hepatocyte fraction was useful for the staging of liver fibrosis and liver function5-7.Our study showed that T1pre and T1post of ICG R15≤20% groups were significantly lower than ICG R15>20% groups, rrT1, HeF and KHep values were significantly higher in ICG R15≤20% groups than ICG R15>20% groups. The correction coefficients between T1pre, T1post, rrT1, HeF, KHep and ICG R15 were 0.343, 0.783, -0.833, -0.819 and -0.832, respectively. The AUC of T1pre, T1post, rrT1, HeF and KHep values in assessing ICG R15>20% groups were 0.761, 0.945, 0.912, 0.945 and 0.950, respectively, T1pre had a significantly lower AUC than other parameters, and KHep had the highest AUC, sensitivity and specificity.
CONCLUSIONS
Hepatocyte fraction based on Gd-EOB-DTPA- enhanced T1 mapping MRI is an efficient diagnostic tool for the quantitative evaluation of liver function.Acknowledgements
noneReferences
[1] Katsube T, Okada M, Kumano S, et al. Estimation of liver function using T1 mapping on Gd-EOB-DTPA-enhanced magnetic resonance imaging[J]. Invest Radiol, 2011, 46(4): 277-283.
[2] Dahlqvist Leinhard O, Dahlström N, Kihlberg J, et al. Quantifying differences in hepatic uptake of the liver specific contrast agents Gd-EOB-DTPA and Gd-BOPTA: a pilot study[J]. Eur Radiol, 2012, 22(3): 642-653.
[3] Tsuda N, Harada K, Matsui O. Effect of change in transporter expression on gadolinium-ethoxybenzyl-diethylene triamine pentaacetic acid-enhanced magnetic resonance imaging during hepatocarcinogenesis in rats[J]. J Gastroenterol Hepatol, 2011, 26(3): 568-576.
[4] Ba-Ssalamah A, Bastati N, Wibmer A, et al. Hepatic gadoxetic acid uptake as a measure of diffuse liver disease: Where are we? [J]. J Magn. Reson. Imaging, 2017, 45(3): 646-659.
[5] Pan S, Wang XQ, Guo QY. Quantitative assessment of hepatic fibrosis in chronic hepatitis B and C: T1 mapping on Gd-EOB-DTPA-enhanced liver magnetic resonance imaging[J]. World J Gastroenterol. 2018, 24(18): 2024-2035.
[6] Yoon JH, Lee JM, Kang HJ, et al. Quantitative assessment of liver function by using gadoxetic acid–enhanced MRI: hepatocyte uptake ratio[J]. Radiology, 2019, 290(1): 125-133.
[7] Liu MT, Zhang XQ, Lu J, et al. Evaluation of liver function using the hepatocyte enhancement fraction based on gadoxetic acid-enhanced MRI in patients with chronic hepatitis B[J]. Abdom Radiol, 2020, 45(10): 3129-3135.
Figures