2138
T1 reduction rate with Gd-EOB-DTPA to determine liver function in MRI – comparison between 1.5T and 3T in a cross-sectional study1Radiology, Inselspital, University of Bern, Bern, Switzerland, 2Visceral Surgery and Medicine, University of Bern, Inselspital, Bern, Switzerland, 3Cardiology, University of Bern, Inselspital, Bern, Switzerland
Synopsis
This study demonstrates that the MRI T1 reduction rate, based on T1 mapping before and after GD-EOB-DTPA, allows an accurate analysis of liver function and may be used interchangeably at 1.5T and 3T without image post-processing. T1 reduction rate was able to distinguish patients with no liver disease, patients with CLD and patients with liver cirrhosis Child A-C from one another.
Introduction
T1 mapping allows quantification of T1 relaxation time in milliseconds and is used to determine the amount of liver fibrosis and inflammation. Another very interesting application of T1 mapping is determining the liver function by calculating the T1 reduction rate before and after administration of GD-EOB-DTPA (Primovist®). One major limitation of T1 mapping is its dependency on MRI field strength and different values at 1.5T and 3T. However, the relaxivity of GD-EOB-DTPA is similar at both field strengths (1) and we therefore hypothesized that the relative T1 reduction rate (T1 pre contrast – T1 post contrast/ T1 pre contrast) might be interchangeably used at 1.5T and 3T in a clinical setting. The aim of this study was to compare MRI T1 reduction rates between 1.5T and 3T to determine liver function in a large cross-sectional comparative study.Methods
In this retrospective, IRB-approved cross-sectional comparative study a total of 264 consecutive patients with liver MRI and T1 mapping before and 20 minutes after intravenous (i.v.) GD-EOB-DTPA administration (132 on 1.5T, 132 on 3T) between 09/2018 and 07/2019 were included. For T1 mapping, a shortened modified Look-Locker inversion recovery (shMOLLI) single breath-hold sequence was used with an echo time of 1.01 ms, a repetition time of 740 ms, an inversion time of 225 ms and a flip angle of 35°. The field-of-view was 384 mm2 with a matrix of 154 x 192 pixels, an 8-mm slice thickness, and a breath-hold time per slice of 7 s with a total scan time per sequence of 1 min 37 s. Parametric T1 maps were generated automatically on the scanner. Of the 264 patients, 69 patients had no CLD and 195 had CLD, among which 126 had liver cirrhosis. The patients with liver cirrhosis were divided into a group of 60 with Child-Pugh Class A, a group of 47 with Child-Pugh Class B and a group of 19 with Child-Pugh Class C. The T1 reduction rate was calculated as (native T1 – post contrast T1) / native T1 and compared between 1.5T and 3T in every patient group using the Mann-Whitney U test with Bonferroni correction. The predictive value of the T1 reduction rate and cutoff values to predict CLD and cirrhosis Child A-C were determined by receiver operating characteristic (ROC) analysis. A p-value <0.05 was defined as statistically significant.Results
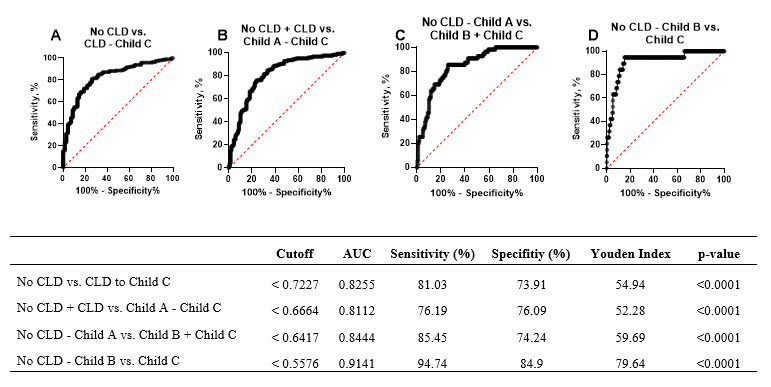
T1 reduction rates showed no significant difference between 1.5T and 3T in all patient groups. For the no CLD group, the reduction rate was 0.75 vs. 0.77 (p=0.623); for the CLD group, it was 0.69 vs. 0.70 (p>0.999); for the Child A group, it was 0.65 vs. 0.65 (p>0.999), for the Child B group, it was 0.61 vs. 0.56 (p=0.311); and for the Child C, it was 0.47 vs. 0.49 (p>0.999). T1 reduction rate showed a good predictive value for CLD (AUC=0.83) and cirrhosis Child A (AUC=0.81), Child B (AUC=0.84) and Child C (AUC=0.91), all with p-values <0.05. Differentiation between the no CLD and CLD vs. cirrhosis groups was possible using T1 reduction rates with a sensitivity of 81%, specificity of 65% and AUC of 0.78 using a cutoff value of 0.72.Discussion
This study demonstrates the interchangeably use MRI T1 reduction rates at 1.5T and 3T. In opposite to the T1 relaxation time, which is dependent on the MRI field strength, the T1 reduction rate did not change between 1.5T and 3T. The T1 reduction rate therefore represents a useful noninvasive imaging biomarker for liver function at both 1.5T and 3T, differentiating different patient groups without CLD, CLD and liver cirrhosis Child Pugh A-C from another. Our results are in accordance with the recent literature. Most studies were conducted on 3T scanners using the MOLLI sequence (3), a similar look-locker sequence from another vendor (4, 5) and a volumetric interpolated breath-hold examination (VIBE) with variable flip-angle (FA) method (6, 7). The results obtained with lock-locker techniques from other vendors were comparable, showing a T1 reduction rate of 0.71 in healthy volunteers (Liu et al.), and studies that used a different variable flip-angle method showed a T1 reduction rate of 0.67 in patients without CLD (8). Only one study, which was performed by Yang et al., used T1 mapping at 1.5T using a dual flip-angle VIBE sequence, and a similar T1 reduction rate of 0.70 was obtained (9). The noninvasive gold standard for grading liver fibrosis is MR elastography (10). ROC analysis revealed that the predictive value of the T1 reduction rate to discriminate between patients without CLD and patients with CLD or cirrhosis (AUC=0.78) and to discriminate between patients with and without liver cirrhosis (AUC=0.79) was lower in our study than in MR elastography studies (11). Nevertheless, the T1 reduction rate may represent a useful and easily available MRI-based method to grade liver function when MR elastography equipment is not available.Acknowledgements
This project was funded by the Swiss National Science Foundation (SNF) grant # 320030_188591.References
1. Rohrer M, Bauer H, Mintorovitch J, Requardt M, Weinmann H-J. Comparison of Magnetic Properties of MRI Contrast Media Solutions at Different Magnetic Field Strengths. Investigative radiology. 2005;40(11):715-24.
2. Obmann VC, Mertineit N, Marx C, et al. Liver MR relaxometry at 3T - segmental normal T1 and T2* values in patients without focal or diffuse liver disease and in patients with increased liver fat and elevated liver stiffness. Scientific reports. 2019;9(1):8106.
3. Yoon JH, Lee JM, Paek M, Han JK, Choi BI. Quantitative assessment of hepatic function: modified look-locker inversion recovery (MOLLI) sequence for T1 mapping on Gd-EOB-DTPA-enhanced liver MR imaging. European radiology. 2016;26(6):1775-82.
4. Liu MT, Zhang XQ, Lu J, et al. Evaluation of liver function using the hepatocyte enhancement fraction based on gadoxetic acid-enhanced MRI in patients with chronic hepatitis B. Abdominal radiology (New York). 2020;45(10):3129-35.
5. Pan S, Wang XQ, Guo QY. Quantitative assessment of hepatic fibrosis in chronic hepatitis B and C: T1 mapping on Gd-EOB-DTPA-enhanced liver magnetic resonance imaging. World journal of gastroenterology. 2018;24(18):2024-35.
6. Verloh N, Utpatel K, Zeman F, et al. Diagnostic performance of Gd-EOB-DTPA-enhanced MRI for evaluation of liver dysfunction: a multivariable analysis of 3T MRI sequences. Oncotarget. 2018;9(91):36371-8.
7. Haimerl M, Utpatel K, Verloh N, et al. Gd-EOB-DTPA-enhanced MR relaxometry for the detection and staging of liver fibrosis. Scientific reports. 2017;7:41429. 8. Kim JE, Kim HO, Bae K, Choi DS, Nickel D. T1 mapping for liver function evaluation in gadoxetic acid-enhanced MR imaging: comparison of look-locker inversion recovery and B(1) inhomogeneity-corrected variable flip angle method. European radiology. 2019;29(7):3584-94.
9. Yang L, Ding Y, Rao S, et al. Staging liver fibrosis in chronic hepatitis B with T(1) relaxation time index on gadoxetic acid-enhanced MRI: Comparison with aspartate aminotransferase-to-platelet ratio index and FIB-4. Journal of magnetic resonance imaging : JMRI. 2017;45(4):1186-94.
10. Guglielmo FF, Venkatesh SK, Mitchell DG. Liver MR Elastography Technique and Image Interpretation: Pearls and Pitfalls. Radiographics : a review publication of the Radiological Society of North America, Inc. 2019;39(7):1983-2002.
11. Singh S, Venkatesh SK, Wang Z, et al. Diagnostic performance of magnetic resonance elastography in staging liver fibrosis: a systematic review and meta-analysis of individual participant data. Clinical gastroenterology and hepatology : the official clinical practice journal of the American Gastroenterological Association. 2015;13(3):440-51.e6.
Figures