2137
Detection of liver fibrosis in a Rat NASH Model using water specific T1 mapping with Gadoxetic Acid -enhanced MRI1Shenzhen Institutes of Advanced Technology, Chinese Academy of Sciences, Shenzhen, China, 2Shenzhen College of Advanced Technology,University of Chinese Academy of Sciences, Shenzhen, China, 3Peking University People's Hospital, Beijing, China
Synopsis
The severity of live fibrosis is one of the most important prognostic factors for the long-term outcomes of Nonalcoholic steatohepatitis (NASH). Early and precise diagnosis is of crucial importance for the disease management of NASH patients. In this work, we detected the liver fibrosis using water specific T1 mapping with Gadoxetic Acid -enhanced MRI in a rat NASH model induced by methionine-choline deficient (MCD) diet. The study revealed that the reduction rates of water-T1 relaxation time before and after Gd-EOB-DTPA administration might be a useful tool to stage the mild and moderate live fibrosis in rat NASH model.
Introduction
The severity of live fibrosis is one of the most important prognostic factors for the long-term outcomes of Nonalcoholic steatohepatitis (NASH) and strongly associated with the overall mortality in patients with Nonalcoholic fatty liver disease (NAFLD). Liver fibrosis in patients with mild and moderate stages (rather than cirrhosis) has the potential to be reversed with effective treatment[1]. Therefore, early and precise diagnosis is of crucial importance for the disease management of NASH patients. However, liver biopsy is currently the only accepted gold standard for patients with liver fibrosis. The purpose of this study was to assess the diagnostic performance of Gadoxetic Acid (Gd-EOB-DTPA) enhanced T1 mapping in the staging of liver fibrosis in a rat NASH model induced by methionine-choline deficient (MCD) diet which with mild, moderate or severe liver fibrosis.Methods
Animal ModelA total of 100 Male Wistar rats weighing 100g were obtained from Beijing Vital River Laboratory Animal Technology Co., LTD. Animals received care in accordance with the Guidance Suggestions for the Care and Use of Laboratory Animals and were used under protocols approved by Shenzhen Institutes of Advanced Technology, Chinese Academy of Sciences Animal Care and Use Committee. Rats were fed a standard chow ad libitum (Control) or a methionine-choline deficient (MCD) diet (Research Diets Inc., A02082002BR) for 2, 4, 5, 6, 8 weeks, respectively (n = 20 each, 5 control group and 15 MCD group). At the end of the feeding, animals were anesthetized by isoflurane for MRI scan and then euthanized with pentobarbital sodium (150 mg/kg) for collecting the liver samples stored at -80℃.
MRI Examination and Image Analysis
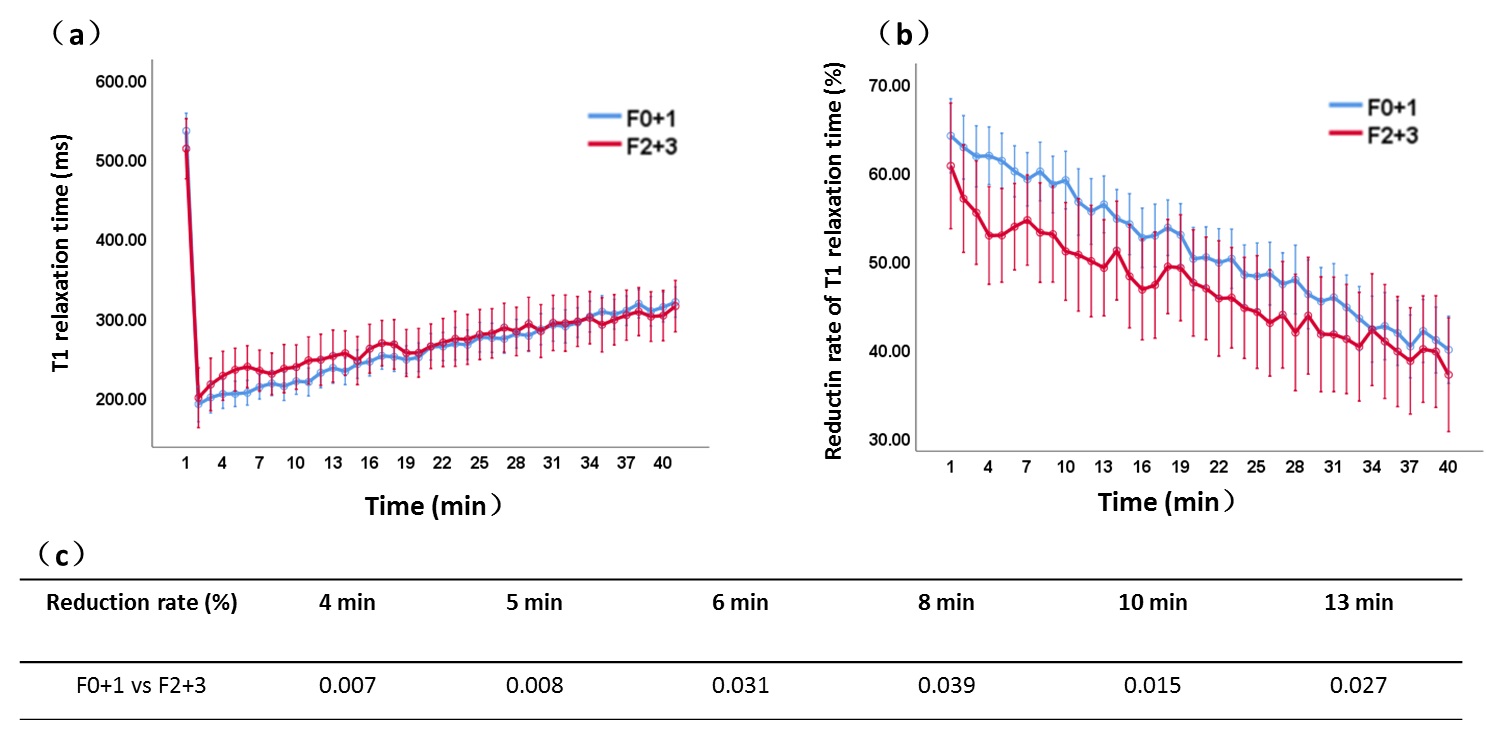
MRI was performed using a 3.0 T clinical MR scanner (uMR790, Shanghai United imaging healthcare, Shanghai, China) combined with a twelve-channel small animal coil for signal acquisition. Rats were anesthetized with isoflurane and their abdomens were secured with a belt to decrease respiratory motion. All images were obtained with free breathing. The MRI examinations included multi-echo variable flip angle GRE sequence and Dual Refocusing Echo Acquisition Mode (DREAM) B1 mapping sequence. A 2D DREAM sequence was performed for each rat before injection of contrast agents with: TR = 6.9ms, TE = 2.24ms, slice thickness = 5mm, bandwidth = 600 Hz/pixel. Simultaneous fat fraction imaging and T1 quantification was realized by a single-slice Transverse 2D multi-echo GRE sequence with variable flip angles. Images were acquired with parameters: TR= 20.5 ms, TE = 3.45/4.92/6.39/7.86/9.33/10.8 ms, slice thickness = 2mm, flip angle = 3°/7°/11°/15°, bandwidth = 900 Hz/pixel, number of averages = 10. The acquisition time of the sequence was 1 minute. This sequence was performed before and continuously after tail vein injection of Gd-EOB-DTPA (0.125 mmol/kg; Primovist; Bayer Healthcare, Berlin, Germany) for 40 min. T1 relaxometry was conducted in the water components separated from the multiple echo GRE data using chemical shift encoded imaging technique. The reduction rate of water-T1 relaxation time between pre- and post-contrast enhancement at each time was calculated using the following definition:
Reduction rate (%) = [(T1pre -T1post) / T1pre)] * 100
where T1pre is the T1 relaxation time before Gd-EOB-DTPA administration and T1post is the T1 relaxation time after Gd-EOBDTPA administration.
Histological and Pathological analysis
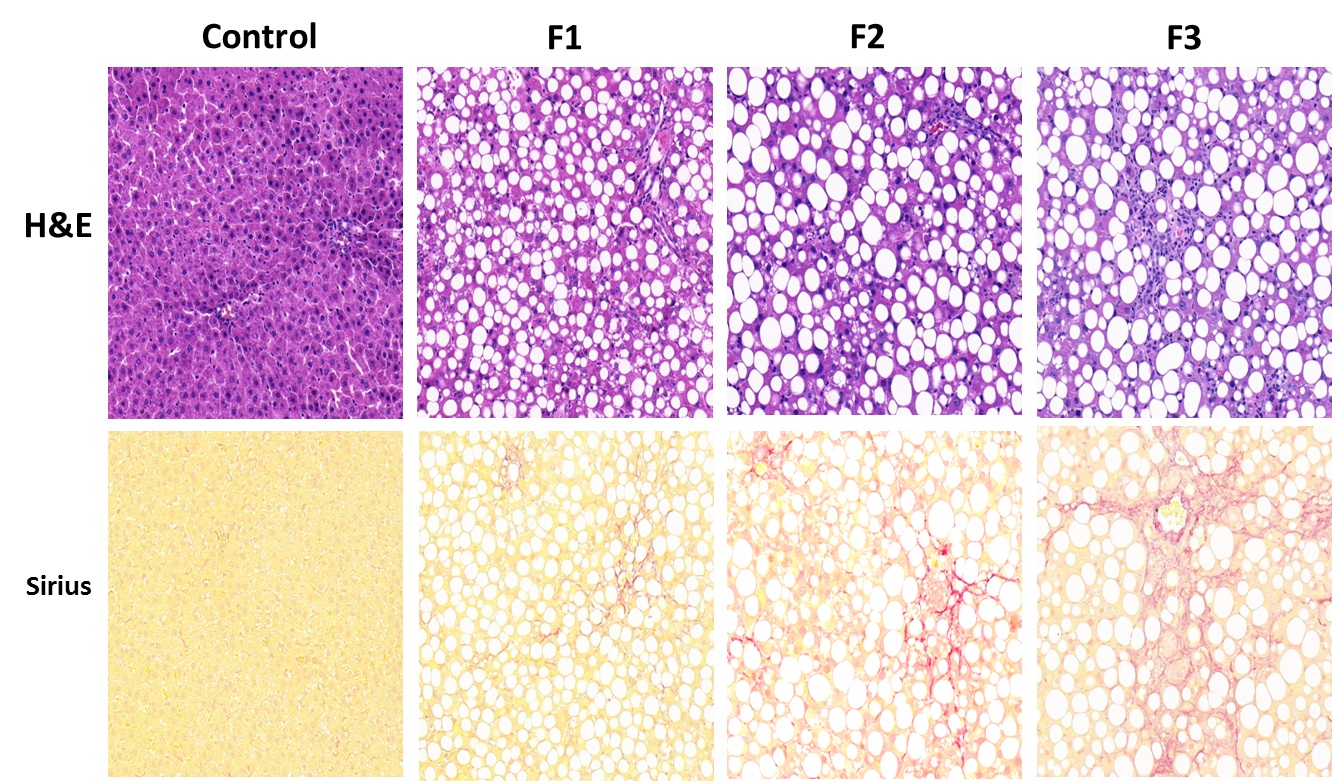
All animals were humanely killed after MR examination and the livers were removed quickly and subsequently fixed by 10% formalin for paraffin section. Hematoxylin-eosin (HE) and Sirius red staining were performed to observe the hepatic pathologic structure and liver fibrosis. All pathologic specimens were reviewed by a pathologist and the fibrosis stage (“F” grade) was evaluated using the NASH Clinical Research Network (CRN) published the NAFLD activity scoring system[2]. The degree of fibrosis was assessed using a scale ranging from 0 to 3.
Results
A total of 58 MCD diet rats were included in the experiments and the typical histological sections shown in fig.1. All of the MCD diet rats showed severe liver steatosis and mild to severe hepatocyte inflammation and fibrosis. According to the pathological analysis, the F0 (n =24) and F1(n=19) were grouped into mild liver fibrosis group (F0+1) and F2(n=11) and F3 (n=4) were grouped as moderate liver fibrosis.The pre- and post water-T1 relaxation time of liver after 40 min Gd-EOB-DTPA administration showed in fig.2a. There was no significant differences between mild liver fibrosis group (F0+1) and moderate liver fibrosis group (F2+3). However, the reduction rate of T1-relaxation time were significantly lower for the moderate fibrosis group than the mild fibrosis group between 4-5 minutes (p<0.01),which was shown in fig.2b-c.
Discussion and Conclusions
In this study, the T1 of water component (water-T1) in liver was measured from the multiple echo GRE sequence under variable flip angle excitation with accurate B1+ correction. Compared to previous studies, the T1 derived by our method avoided the interference from the fat component, which was common and hard to be fully suppressed in the animal with liver steatosis. Our study revealed that the reduction rates of water-T1 relaxation time before and after Gd-EOB-DTPA administration might be a useful tool to stage the mild and moderate live fibrosis in rat NASH model. In the future, we will further explore the relationship between the dynamics of water-T1 with Gd-EOB-DTPA, liver fibrosis and the hepatocyte inflammation.Acknowledgements
No acknowledgement found.References
[1].Sheka AC, et al. Nonalcoholic Steatohepatitis: A Review. JAMA. 2020 Mar 24;323(12):1175-1183
[2].Kleiner DE, et al. Design and validation of a histological scoring system for nonalcoholic fatty liver disease. Hepatology. 2005 Jun;41(6):1313-21
Figures