2136
The diagnostic performance of Gd-EOB-DTPA-enhanced MRI based T1HBP value for liver function assessment1Department of Magnetic Resonance, LanZhou University Second Hospital, Lanzhou, China, 2Philips Healthcare, Xi’an, China
Synopsis
The correlation between T1 relaxation times of hepatobiliary phase (T1HBP) and indocyanine green retention at 15min (ICG R15), as well as transient elastrography (TE) still need to be confirmed. This study evaluates the correlation among T1HBP, ICG R15 and TE. Our research showed that T1HBP had significant correlation with ICG R15 and TE. The above results demonstrated that T1HBP may be a promising radiography biomarker for liver function assessment.
Introduction
Liver function assessment plays a vital role in clinical practice, especially for surgeons predicting future remnant liver function after partial hepatectomy. The Child-Pugh classification and ICG R15 have been the most used methods to estimate total liver function in the clinic[1]. MRI based Gadolinium ethoxybenzyl diethylenetriamine penta-acetic acid (Gd-EOB-DTPA) and Ultra Sound based TE technologies have recently come into use to assess liver lesions and function[2,3]. Previous studies[4-6] focus on the signal intensity of liver fibrosis or liver cirrhosis to estimate liver function. Nevertheless, there are few studies assess the relationship among T1HBP, ICGR15 and TE. Therefore, the purpose of this study was to investigate the diagnostic value of Gd-EOB-DTPA enhanced MRI based T1HBP for liver function evaluation.Methods
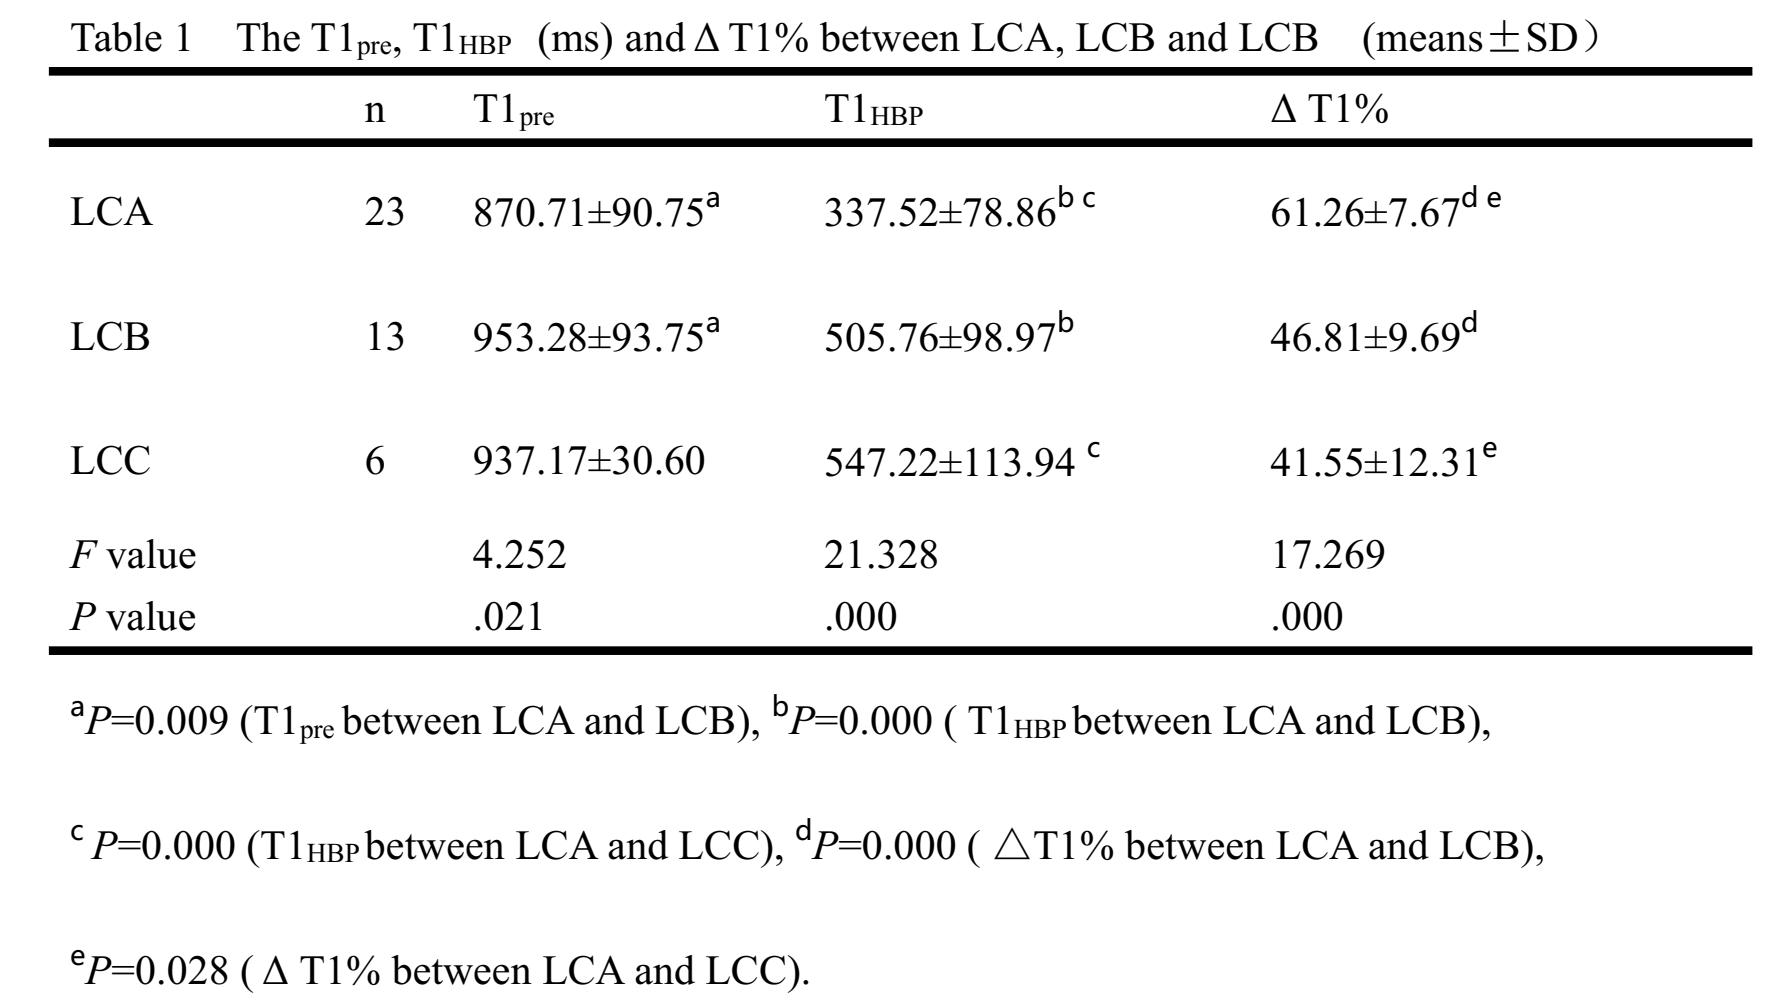
Forty-two patients with Gd-EOB-DTPA enhancement examination were acquired from a 3T scanner (Ingenia CX, Philips Healthcare, the Netherlands). They were divide into three groups. They were 23 cases of Child-Pugh A (LCA), 13 cases of Child-Pugh B (LCB) and 6 cases of Child-Pugh C (LCC). MOLLI(Modified Look-Locker Inversion Recovery)sequence was used to perform T1 mapping scan at the proximal hepatis hilar level before enhancement and hepatobiliary phase. All the obtained data were measured by Philips IntelliSpace Portal workstation to extract T1 relaxation times before enhancement and hepatobiliary phase (T1pre/T1HBP). The user defined three ROIs were drawn manually on T1 mapping images. In addition, the relative reduction rate of T1 relaxation time of pre-enhanced and hepatobiliary phase were calculated using the following equation: ΔT1% = (T1pre-T1HBP) ×100%/T1pre. One Way ANOVA was applied to compare related parameters among different liver function groups. In addtion, Child-Pugh B and C have common therapeutic schemes clinically. Therefore, in this study, we combined the Child-Pugh B+C into one group. Area Under Curve (AUC) was calculated to evaluate the diagnostic performance of T1pre, T1HBP, and ΔT1% between Child-Pugh A and Child-Pugh B+C. Spearman correlation coefficient was used to analyze the correlation among T1pre, T1HBP and ΔT1% with ICGR 15% and TE.Results
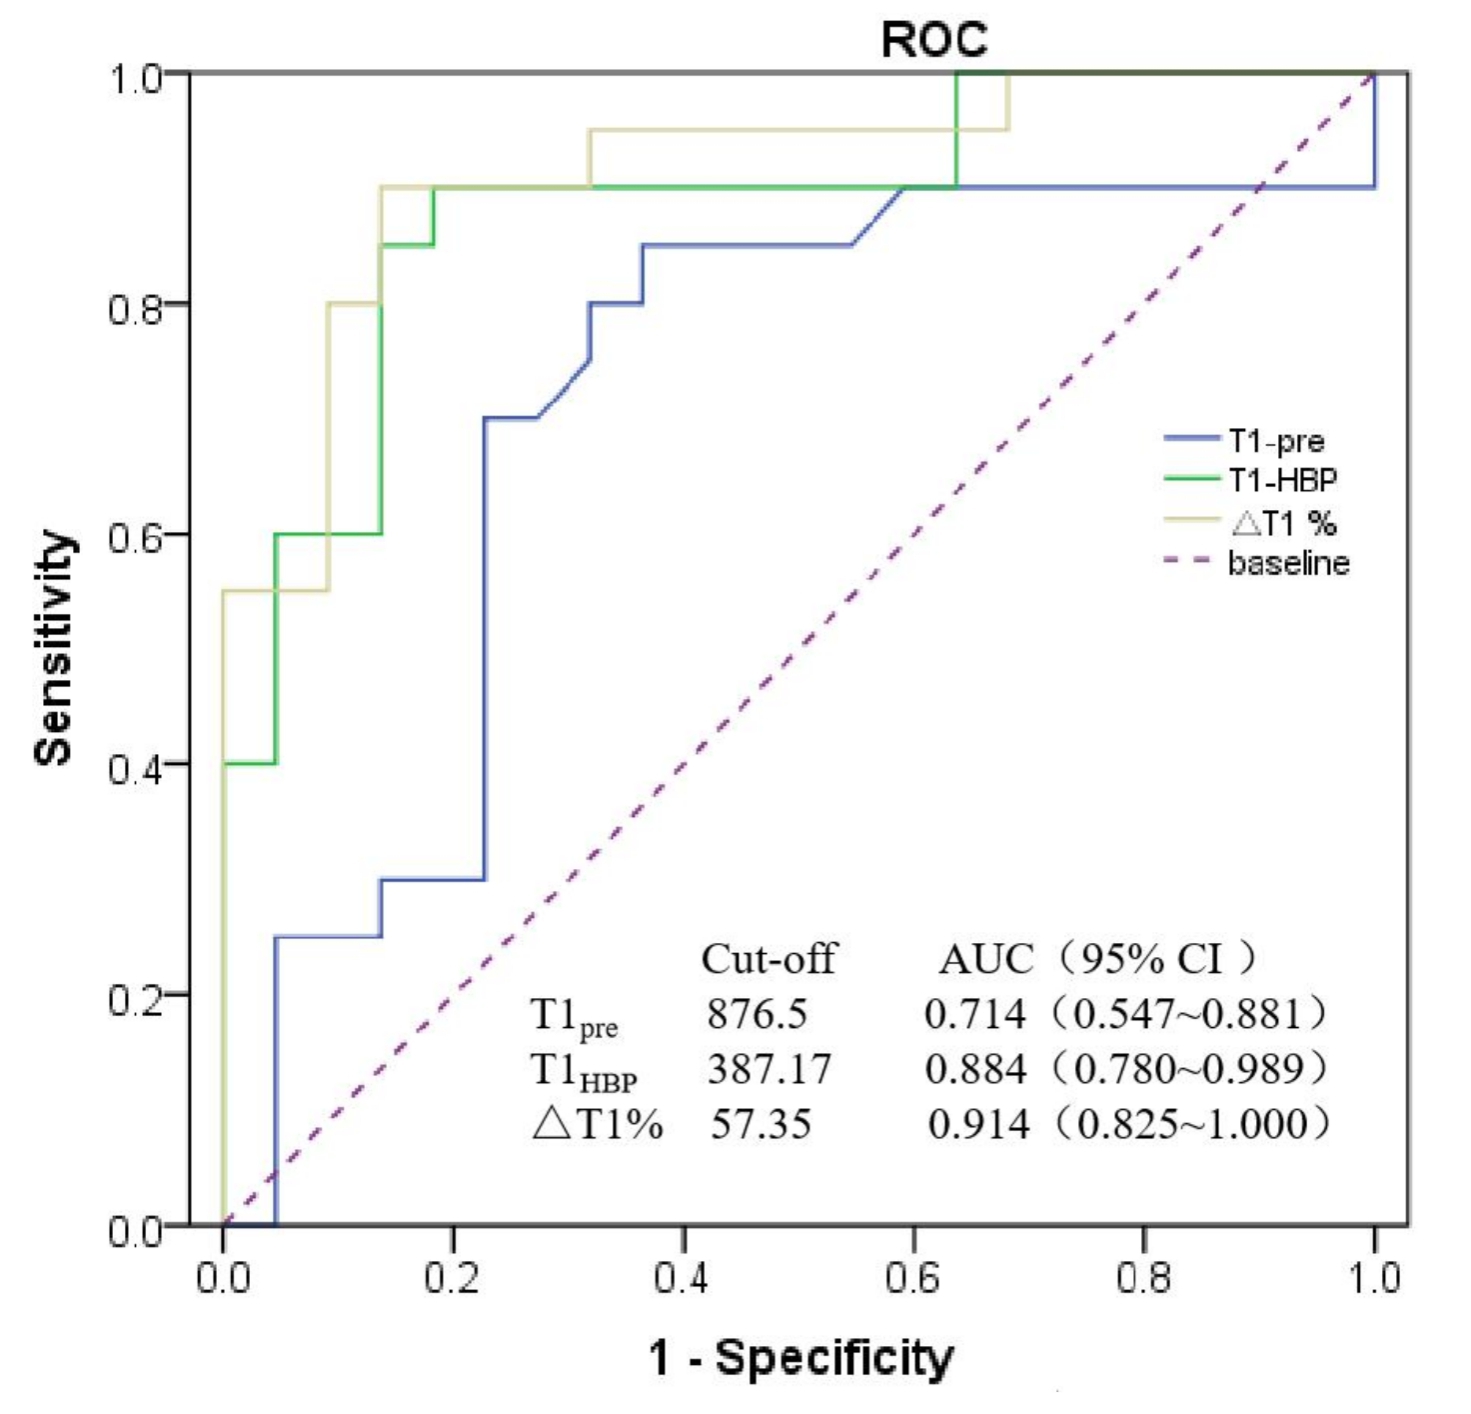
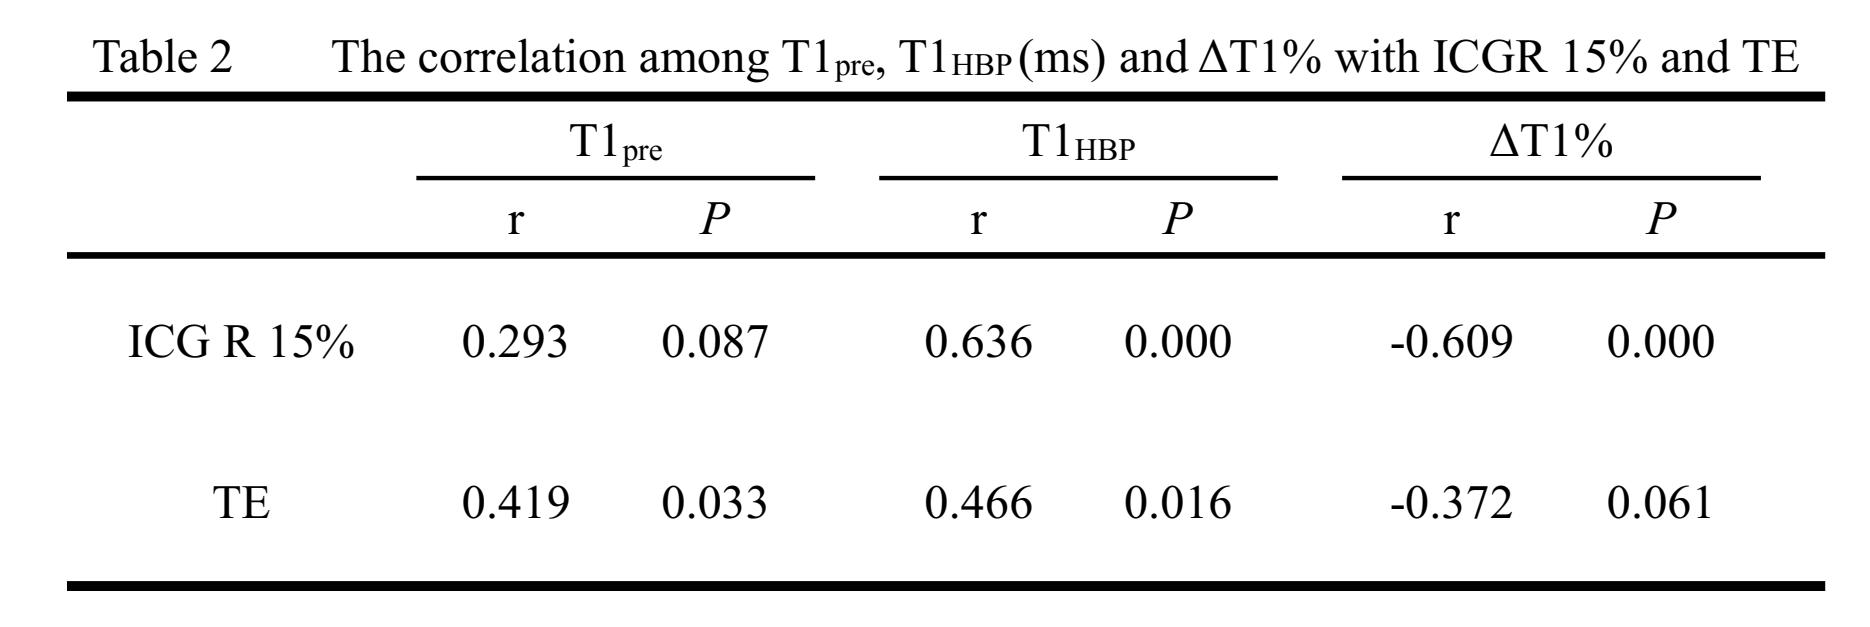
T1HBP and ΔT1% were significance difference between LCA and LCB, LCA and LCC (P<0.05). No significance difference was found between LCB and LCC groups (P>0.05). T1pre was only significant higher in LCA than in LCB (P<0.05), see Table 1. The AUC of T1pre, T1HBP and ΔT1% in Child-Pugh B+C were 0.714, 0.884, 0.914 respectively (see Fig 1). The sensitivity of T1pre, T1HBP, and ΔT1% in identifying Child-Pugh B+C was 85%, 90%, 90% respectively. The specificity of T1pre, T1HBP, and ΔT1% in identifying Child-Pugh B+C was 63.6%, 81.8%,86.4% respectively. T1pre was no correlation with ICGR 15% (P>0.05). T1HBP was significantly correlated with ICGR 15% (r = 0.636, P<0.05). ΔT1% was negatively correlated with ICGR 15% (r = -0.609, P<0.05). T1pre and T1HBP were positively correlated with TE (r = 0.419, r = 0.466, P<0.05). ΔT1% was not correlated with TE (P>0.05), see Table 2.Discussion
With T1pre and T1HBP increased while ΔT1% decreased with the progress of liver cirrhosis, our results stay the same with previous reports[3-5]. Compared with AUC of T1pre and T1HBP, ΔT1% has higher value in Child-Pugh B+C. T1HBP has significant correlation with ICG R15 and TE comparing with ΔT1%. As easy to measure, T1HBP suggested to be a more effective indicator to evaluate liver function. Further study will include a larger size of samples to prove T1HBP as the first choice on imaging indicators for quantitative evaluation of liver function.Conclusion
This study showed that T1HBP had a higher correlation with ICG R15 and TE, which were commonly used to estimate total liver function in the clinic. In summary, T1HBP may be a promising radiography biomarker for liver function assessment.Acknowledgements
This research was supported by the Lanzhou Chengguan District Science and Technology Plan Project (Grant No. 2019SHFZ0037).References
[1] Pan S, Wang XQ, Guo QY. Quantitative assessment of hepatic fibrosis in chronic hepatitis B and C: T1 mapping on Gd-EOB-DTPA-enhanced liver magnetic resonance imaging. World J Gastroenterol. 2018; 24(18):2024-2035.
[2] Staniszewski M, Klose U. Improvement of Fast Model-Based Acceleration of Parameter Look-Locker T1 Mapping. Sensors (Basel). 2019; 19(24):5371.
[3] Frulio N, Trillaud H. Ultrasound elastography in liver. Diagnostic and Interventional Imaging. 2013; 94(5):515-534.
[4] Katsube T, Okada M, Kumano S, Hori M, Imaoka I, Ishii K, et al. Estimation ofliver function using T1 mapping on Gd-EOB-DTPA-enhanced magnetic resonance imaging. Investig Radiol. 2011; 46:277–83.
[5] Hoffman DH, Ayoola A, Nickel D, Han F, Chandarana H, Shanbhogue KP. T1 mapping, T2 mapping and MR elastography of the liver for detection and staging of liver fibrosis. Abdom Radiol (NY). 2020; 45(3):692-700.
[6] Verloh N, Utpatel K, Zeman F, et al. Diagnostic performance of Gd-EOB-DTPA-enhanced MRI for evaluation of liver dysfunction: a multivariable analysis of 3T MRI sequences. Oncotarget. 2018;9(91): 36371-36378.
Figures