2135
Temporal diffusion spectroscopy with oscillating gradient echoplanar MRI : signal to noise and ADC repeatability in mice liver.1Center of research on inflammation (UMR1149), Inserm - Université de Paris, Paris, France, 2Beaujon hospital radiology departement, APHP, Paris, France
Synopsis
Temporal diffusion spectroscopy using oscillating encoding gradients enables assessing tissue microstructure at a user-selected, arbitrary spatial scale. It has been demonstrated that this method is feasible with OGSE-EPI sequence. To study its robustness an OGSE-EPI sequence was implemented and repeatability and signal to noise ratio were assessed with two radiofrequency hardware setups and with or without respiratory gating. The effect of OGSE frequency was assessed for the pure diffusion coefficient (D) and for the apparent diffusion coefficient (ADC). Using a 4-channel surface coil and respiratory gating when measuring ADC at 100 Hz, the optimal repeatability coefficient (28%) was obtained.
Introduction
Diffusion-weighted imaging (DWI) probes the diffusion properties of water, which are modulated by the microstructure of biological tissues1,2. Conventionally, ADC is obtained with pulsed gradient spin echo sequences, and lacks specificity due to the integrated influences of several spatial scales. In temporal diffusion spectroscopy, oscillating encoding gradients are used, which enables to assess tissue microstructure at a user-selected, arbitrary spatial scale. Typically, scales smaller than the diameter of a single cell are achievable1,3. Oscillating gradient spin echo (OGSE) methods have been implemented with spin echo4, fast spin echo5 or echoplanar imaging (EPI)6. OGSE has been used for estimating hepatocyte size7, nuclear size changes after anticancer therapy5,8,9, and hepatocellular nodule characteristics in liver cirrhosis4.Although measurement of hepatocyte cell size has been demonstrated to be feasible with OGSE-EPI, studies of the robustness of this method in mice are lacking. Here, an OGSE-EPI sequence was implemented and the repeatability and signal to noise ratio (SNR) were assessed with two radiofrequency hardware setups and with or without respiratory gating. The effect of OGSE frequency was assessed for the pure diffusion coefficient (D) and for the apparent diffusion coefficient (ADC).
Methods
SequenceAn OGSE sequence was programmed with an EPI readout, by inserting oscillating gradients symmetrically on either side of the refocusing pulse. The double-sinusoid waveform proposed by Does2, was implemented.
Sequence parameters
All experiments were carried out on a 7T, 300mT/m Bruker system equipped with either a volume coil or a combination of a volume transmit coil and an actively decoupled, 4-channel surface coil array for reception. Acquisitions were performed consecutively with and without respiratory gating. The desired b-values (0, 200, 300 and 400 s/mm² for the ADC and 200, 300 and 400 s/mm² for the D) were obtained by varying the gradients amplitude at a constant echo time, which on our system was minimally 52.8 ms. Other sequence parameters were: TR = 5 s, matrix size = 96 x 64, FOV = 40 x 40 mm, spatial resolution = 0.42 x 0.63 mm2, slice thickness = 1mm, NEPI shots = 8, Number of averages = 2, with spectral-selective fat suppression. Two frequencies were tested (100 and 150 Hz). Scan time per b-value was 1 min 20 s and 3 min 40 s without and with respiratory gating, respectively.
Image analysis
ADC and D values were retrieved by a linear regression of the log of the signal versus b-values (monoexponential fit). Signal to noise ratio at b = 400 s/mm² was estimated with the standard deviation of the subtraction of the two available image averages as noise estimation.
Repeatability study
In all tested conditions, the MRI acquisitions were repeated twice during a single anesthesia in a group of five healthy mice (after appropriate ethical authorization) Repeatability was estimated with Bland-Altman tests and coefficients of repeatability (standard deviation (%) * 1.9610) were calculated.
Results
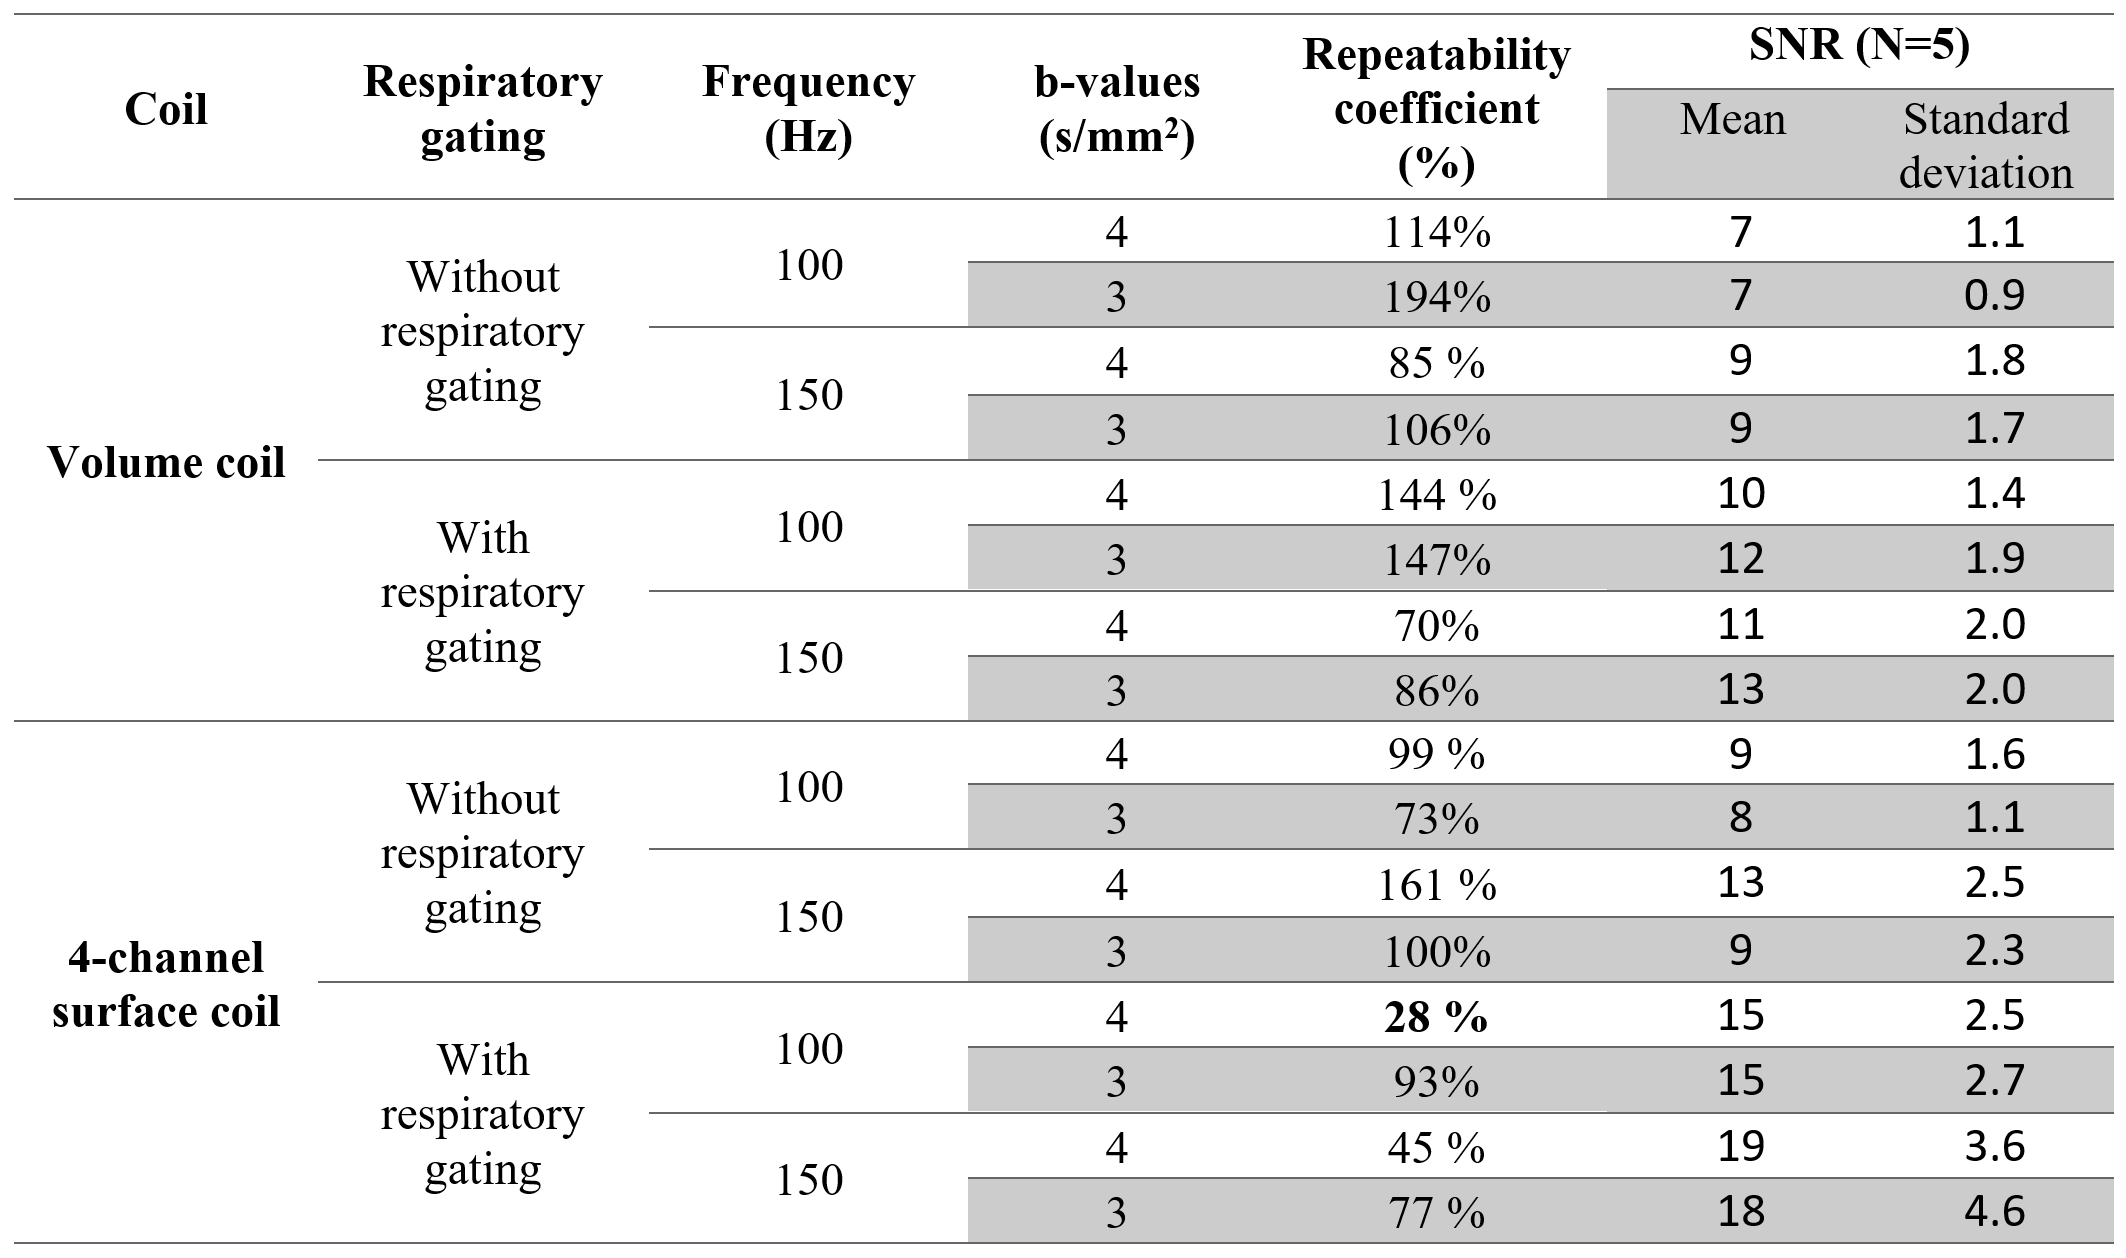
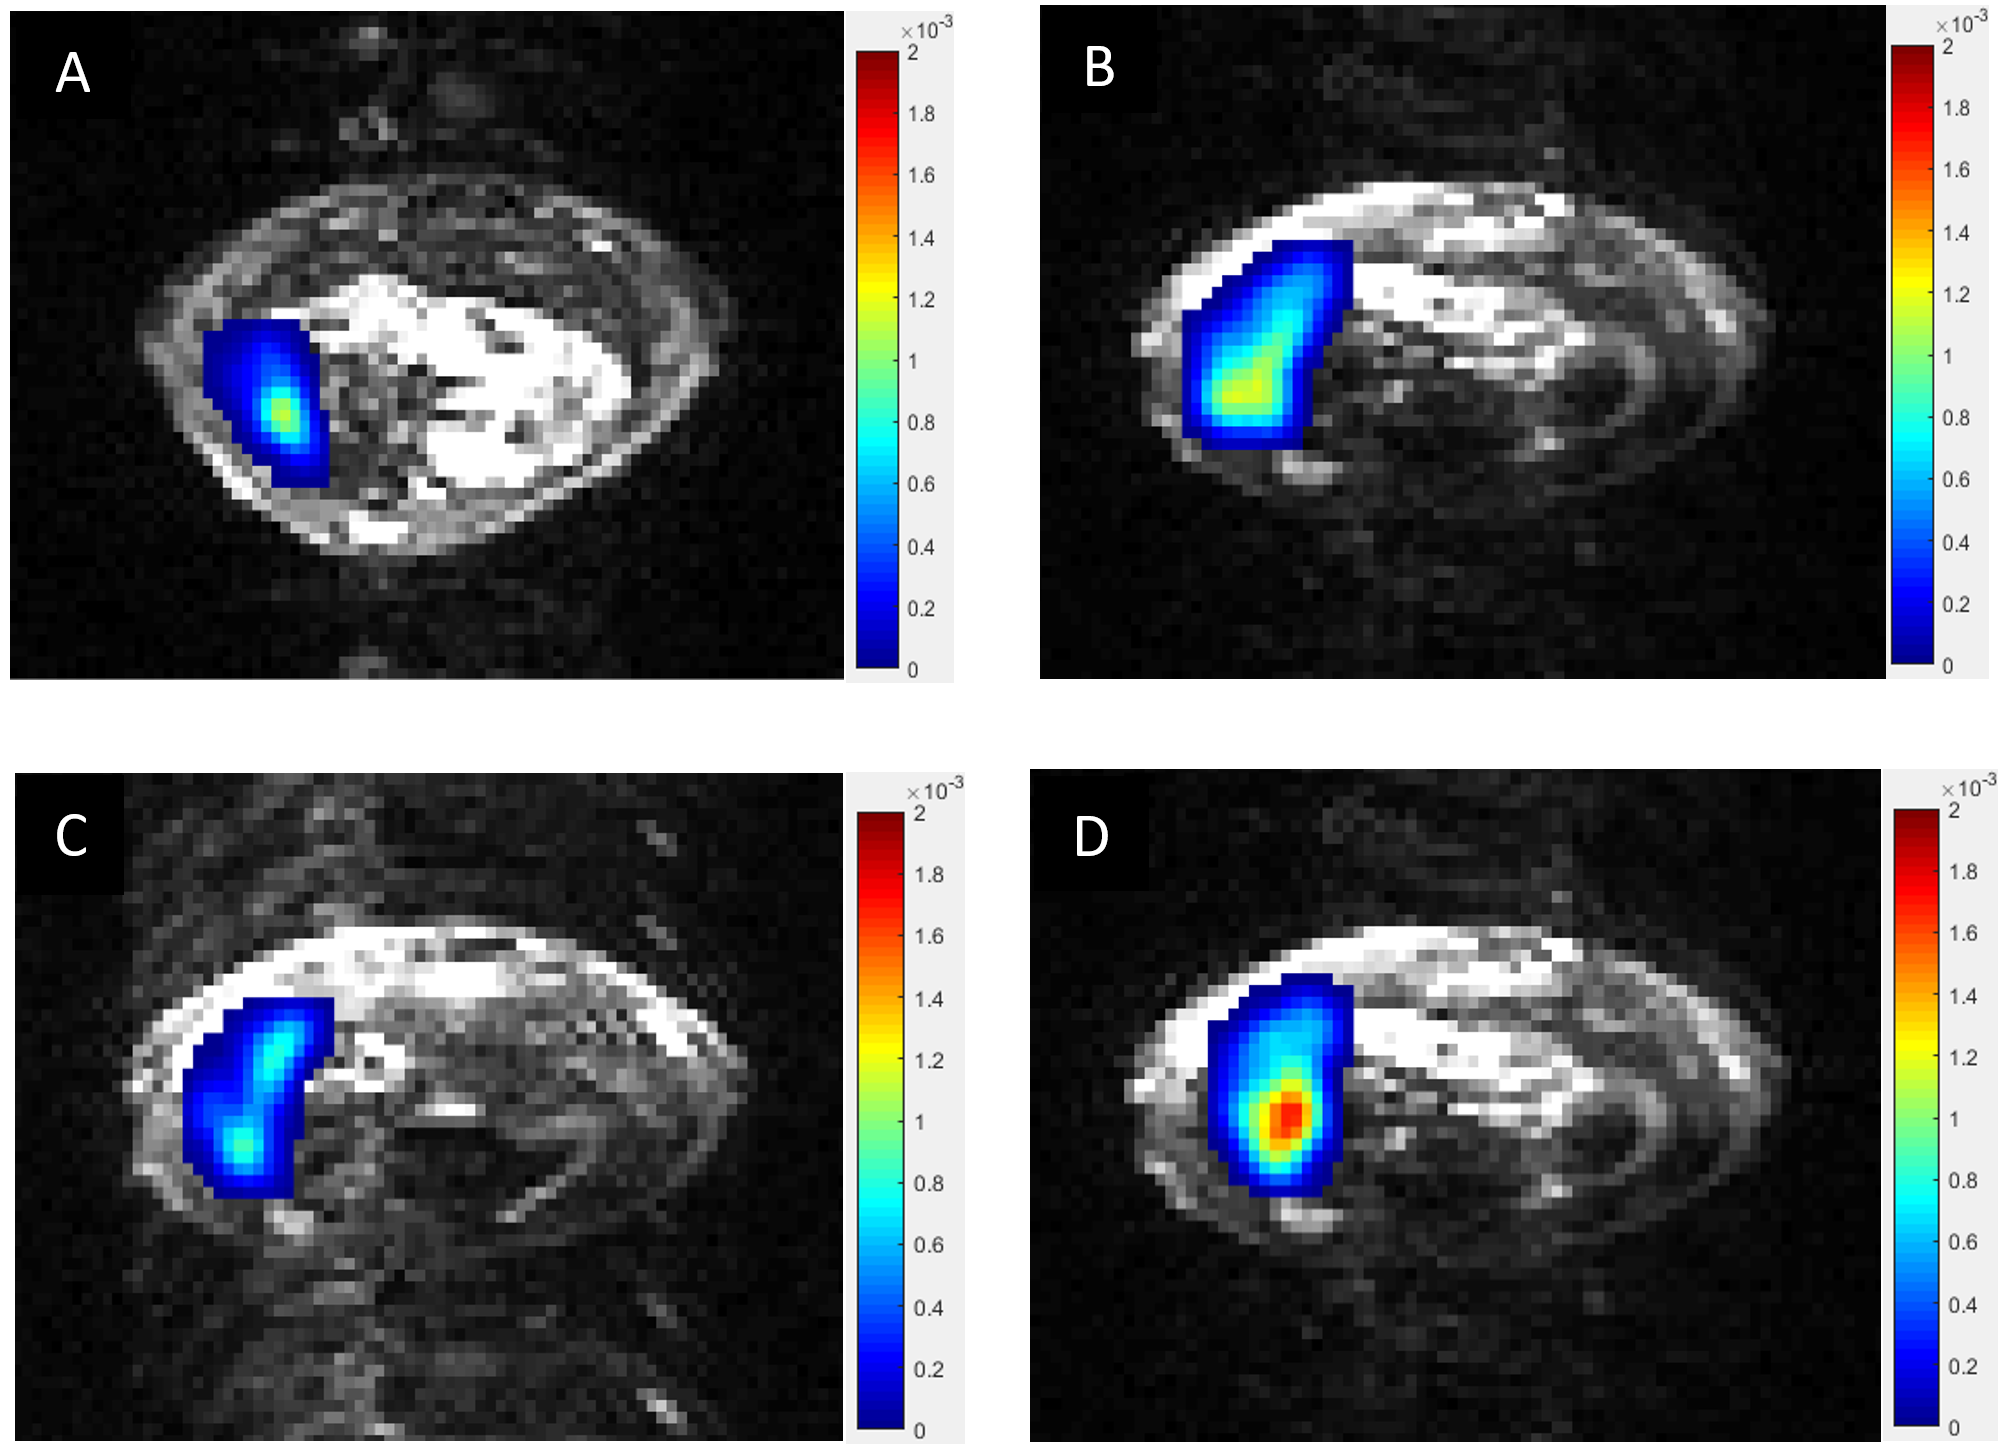
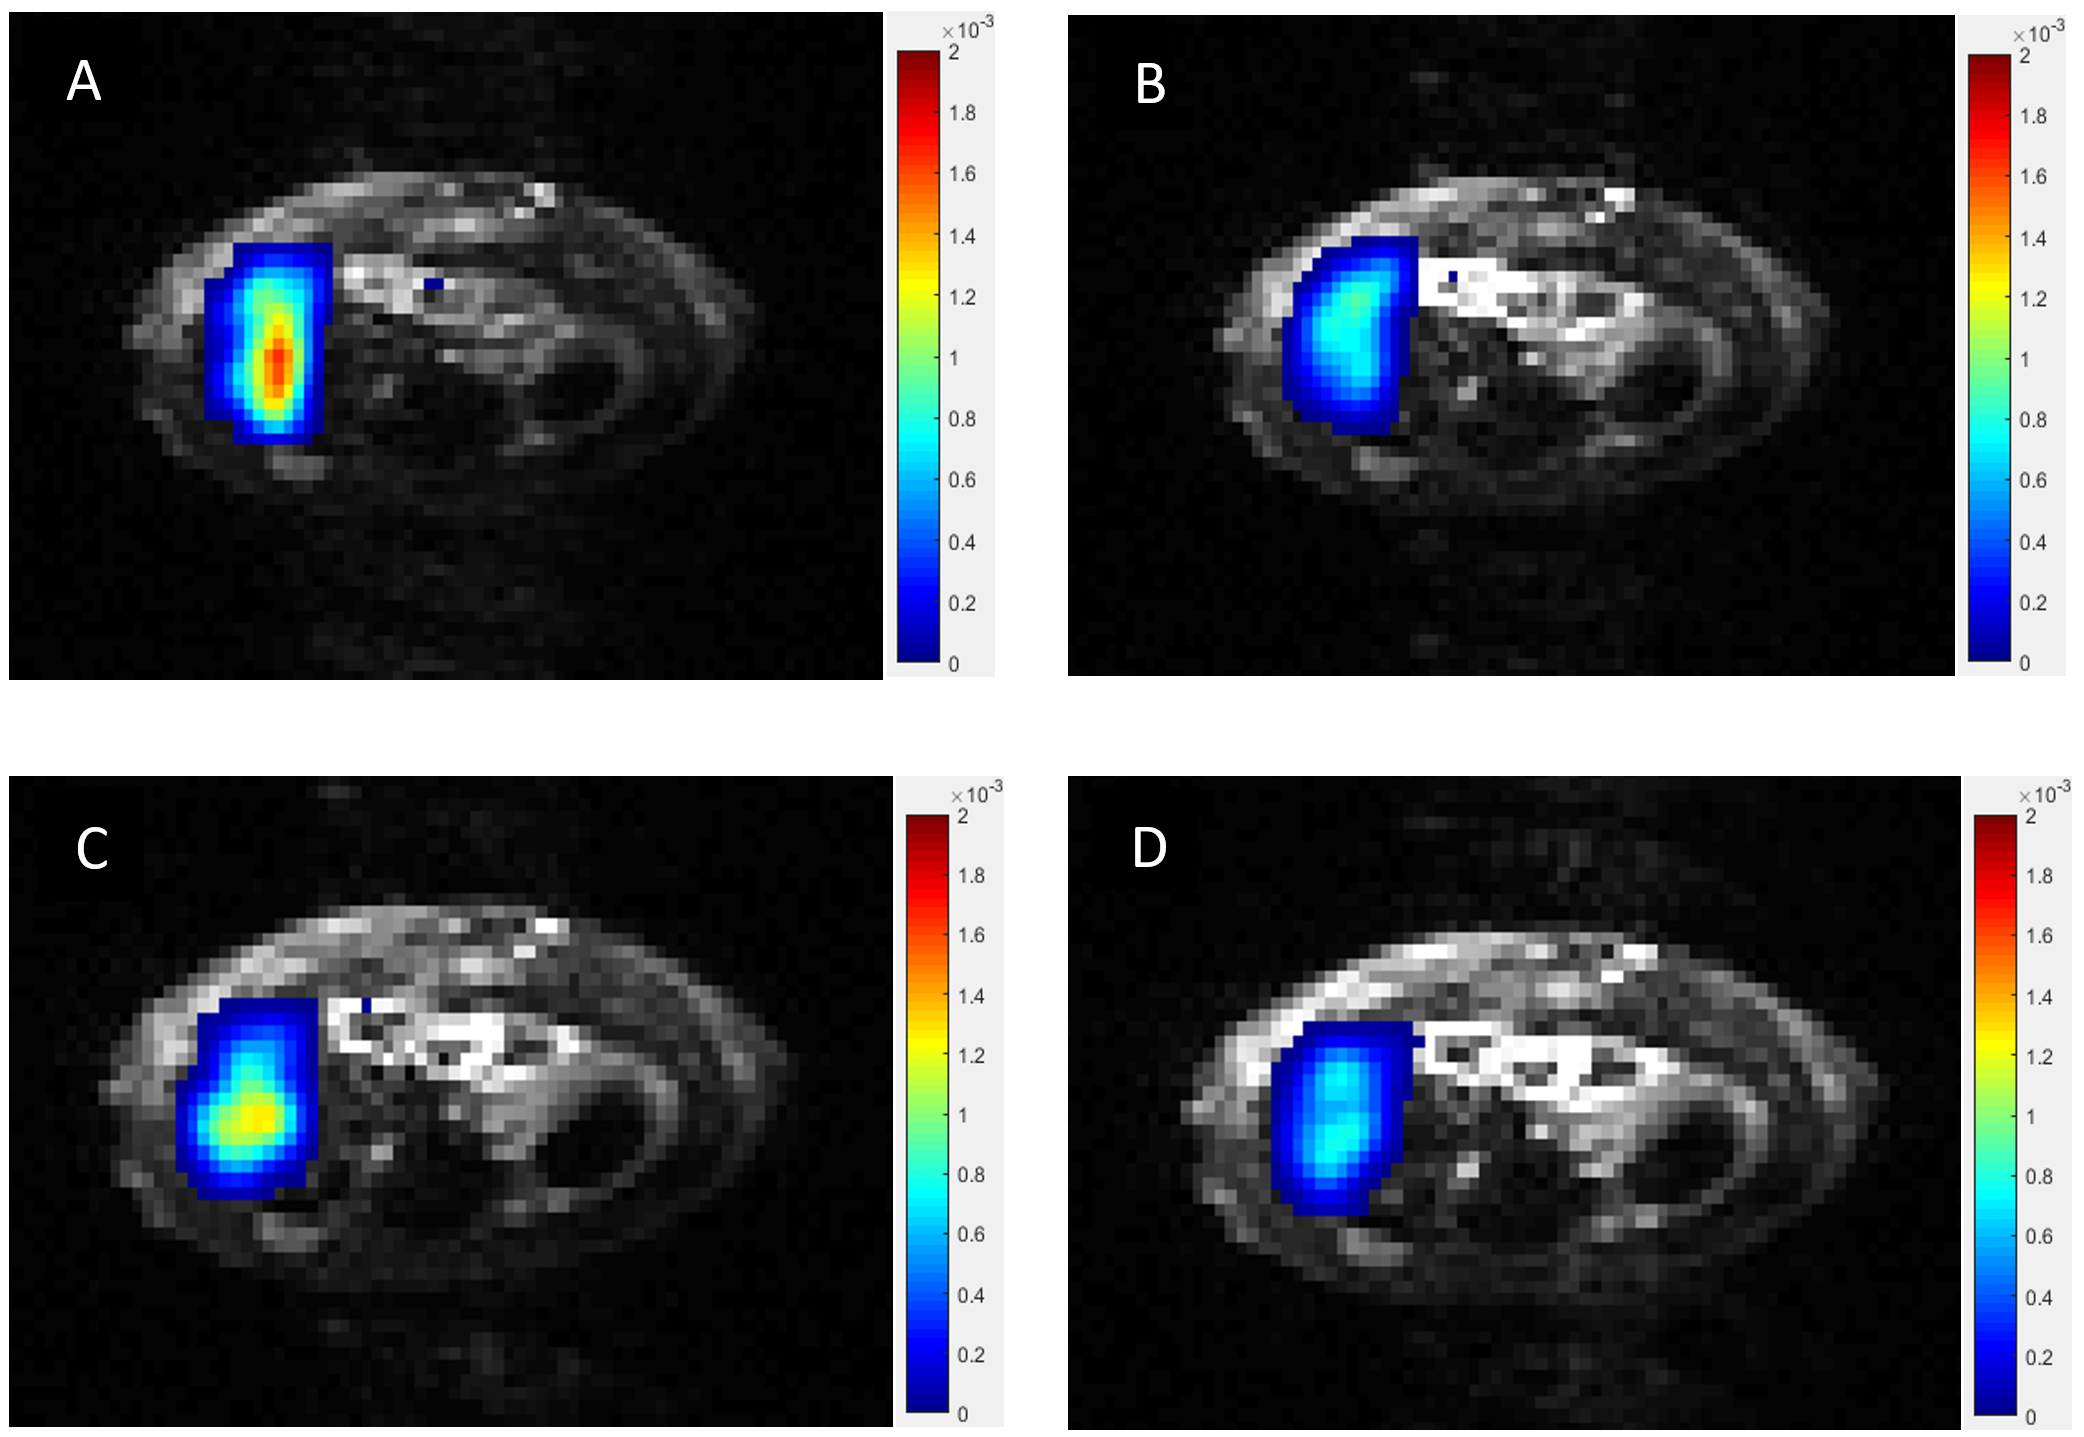
Repeatability coefficient and SNR values were better (i.e smaller repeatability coefficient and higher SNR) when using the 4-channel surface coil than when using the volume coil in 7 of 8 tested combinations (Table 1). Volume coil images had larger sensitivity area while surface coil images had higher signal magnitudes (figure 1). Repeatability coefficient and SNR values were better when using respiratory gating in 6 of 8 and 8 of 8 tested combinations respectively. Visually, respiratory gating had an important effect on image quality (figure 1). SNR values were better at 150 Hz in 8 of 8 tested combinations. Also when measuring ADC (with four b-values), we obtained better repeatability coefficient and SNR values than when measuring D (three b-values) in 6 of 8 tested combinations (figure 2). The optimal repeatability coefficient was 28% obtained using the 4-channel surface coil and respiratory gating when measuring ADC at 100 Hz.Discussion
Gains in repeatability were achieved by increasing the image SNR using a 4-channel surface coil. Despite the slight TR variability introduced by respiratory gating, it was found that a better repeatability was achieved than without respiratory gating, where the TR is strictly defined by the MR sequence, but where animal breathing perturbs the acquisitions. In Jiang et al.[7], acquisitions were performed with respiratory gating. A better repeatability was obtained for ADC. This could be explained by the greater number of b-values or the introduction of high signal b0 images to the ADC fit.Conclusion
The OGSE sequence with EPI readout is applicable at 7T in vivo in mice. The proposed acquisition conditions using 4-channel parallel coil, respiratory gating and 4 b-values enable to optimize the repeatability of the measurement.Acknowledgements
This work was funded in part by the Agence Nationale de la Recherche Investissements d’avenir programme ANR-17- RHUS-0009 (Quid-NASH).
Authors wish to thank the Inserm UMS34 platform FRIM (Federation of Research on imaging and multimodality).
This work was funded in part by the Agence Nationale de la Recherche AAPG programme ANR-20-CE19-0005-01 (STEDI-NASH).
References
1. Xiaoyu Jiang, e.a., In vivo magnetic resonance imaging of treatment-induced apoptosis. Scientific Reports, 2019.
2. Mark D. Does, e.a., Oscillating Gradient Measurements of Water Diffusion in Normal and Globally Ischemic Rat Brain. Magnetic Resonance in Medicine 2003.
3. Junzhong Xu, e.a., Quantitative Characterization of Tissue Microstructure withTemporal Diffusion Spectroscopy. J Magn Reson Imaging, 2009.
4. Mathilde Wagner, e.a., Comparison of Pulsed and Oscillating Gradient Diffusion-Weighted MRI for Characterizing Hepatocellular Nodules in Liver Cirrhosis: ex vivo Study in a Rat Model. J. MAGN. RESON. IMAGING, 2019.
5. Junzhong Xu, e.a., Characterizing Tumor Response to Chemotherapy at Various Length Scales Using Temporal Diffusion Spectroscopy. PlosOne, 2012.
6. Xiaoyu Jiang, e.a., In vivo imaging of cancer cell size and cellularity using temporal diffusion spectroscopy. Magnetic Resonance in Medicine, 2017.
7. Xiaoyu Jiang, e.a., Mapping hepatocyte size in vivo using temporal diffusion spectroscopy MRI. Magnetic Resonance in Medicine, 2020.
8. Xiaoyu Jiang, e.a., Quantification of Cell Size Using Temporal Diffusion Spectroscopy. Magnetic Resonance in Medicine, 2016.
9. Colvin, e.a., Earlier detection of tumor treatment response using magnetic resonance diffusion imaging with oscillating gradients. Magn Reson Imaging, 2011.
10. Anneloes E. Bohte, e.a., MR Elastography of the Liver: Defining Thresholds for Detecting Viscoelastic Changes. Radiology, 2013.
Figures