2132
Gradient non-linearity correction in liver DWI using motion compensated diffusion encoding waveforms1Department of Diagnostic and Interventional Radiology, Technical University of Munich, Munich, Germany, 2Philips Healthcare, Best, Netherlands, 3Philips Healthcare, Hamburg, Germany
Synopsis
Despite its strong clinical significance in lesion detection and tumor staging, liver DWI remains challenged by its strong sensitivity to motion effects. Motion-compensated diffusion encoding schemes have been recently proposed to improve DW liver signal homogeneity especially in the left liver lobe, a region typically affected by cardiac motion. In addition, a simplified gradient non-linearity correction scheme has been proposed for usage with standard pulsed gradient spin echo (pgse) diffusion encoding waveforms. The present work investigates the usage of this gradient nonlinearity correction algorithm with different motion compensated diffusion encoding gradient waveforms in the context of coronal ADC mapping in the liver.
Purpose
Diffusion-weighted imaging (DWI) remains a valuable tool in liver lesion detection and there is an ongoing interest in ADC mapping for tumor staging and therapy monitoring1,2. However, cardiac motion remains a major source of intravoxel dephasing and ADC overestimation, especially in the left liver lobe. Motion-compensated diffusion encoding designs have been proposed as alternatives in overcoming the low efficiency of cardiac triggering in removing the effect of cardiac motion from liver DWI3-10. Gradient nonlinearity, a problem exhibited by clinical MRI systems, is another source of ADC estimation errors. Conventional computation of b-values assumes the linearity of the gradients. Gradient nonlinearity can lead to errors in b-value calculation and therefore errors in estimated diffusion parameters such as ADC11. A simplified correction algorithm has been proposed to correct for gradient nonlinearity induced errors in b-values when using Stejskal-Tanner pulsed gradient spin echo (pgse) diffusion encoding gradients11. The present work investigates the usage of the gradient nonlinearity correction algorithm with different motion compensated diffusion encoding gradient waveforms in the context of coronal ADC mapping in the liver.Methods
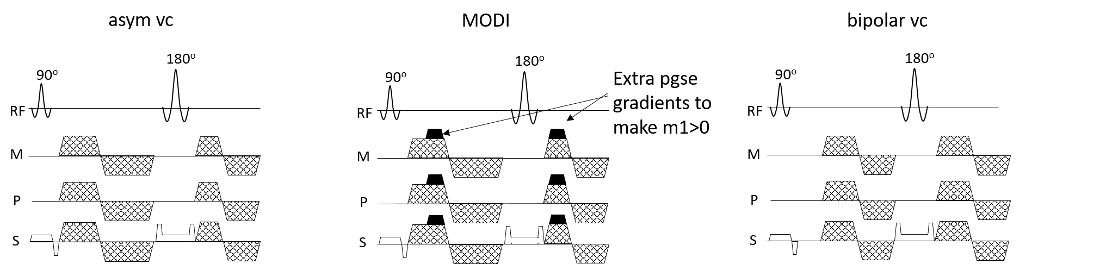
Motion Compensated WaveformsThe sequence diagrams for the motion compensated waveforms are shown in Figure 1. The symmetric bipolar waveform (bipolar vc) sets the first moment of the diffusion encoding gradients $$$(\int{m1\,=\,tG(t)})$$$ to zero. However, since the symmetric bipolar design is not optimal in terms of echo time, an asymmetric bipolar design was implemented in order to reduce the echo time (asym vc)10. As these m1 nulled waveforms can cause vessels to appear bright in a diffusion weighted image even at high b-values, a small amount of m1 was added to the diffusion encoding gradients to give the MODI waveform9. The addition of m1 in the MODI waveform was done at low b-values by adding small pgse gradients on top of the existing gradients, and at the largest b-value used this was done by adjusting the relative lengths of each of the existing lobes until the desired value of m1 was achieved9.
Gradient nonlinearity correction
The gradient nonlinearity correction (gnl) was done as in Malyarenko et al11,12, where correction maps are computed based on the gradient design coefficients provided by the vendors. The corrected b-value map is then obtained from $$b_c^k({\bf{r}})\,=\,b_n^k({\bf{r}})C^k({\bf{r}}),$$ where $$$b_c^k({\bf{r}})$$$ is the corrected spatially dependent b-value map for each diffusion direction k, $$$b_n^k({\bf{r}})$$$ is the nominal b-value and $$$C^k({\bf{r}})$$$ is the correction map.
MR Measurements
Phantom measurements were carried out for all waveforms. Fifteen axial slices were acquired with a voxel size of $$$3\,x\,3\,x\,6$$$mm3 and a 4mm slice gap. b-values of $$$[0,\,300,\,600]$$$s/mm2 were used for the ADC calculation, with 2 averages per b-value and 3 orthogonal diffusion encoding directions along the readout (RO), phase encoding (PE) and slice selection (SS) directions. $$$TE\,=\,60\,/\,88\,/\,88\,/\,94\,$$$ms for pgse, asym vc, MODI m1$$$\,=\,0.1$$$s/mm and bipolar vc respectively. TR$$$\,=\,8000$$$ms for all waveforms. In vivo measurements were carried out in 4 subjects. In subjects with bright liver signal the same diffusion directions, resolution and echo times as the phantom were used, but with b-values of $$$[200,\,600]$$$s/mm2 and corresponding averages of $$$[3,\,4]$$$. For subjects with not as bright liver signal, the diffusion directions $$$([-0.5\,-1\,-1],\,[1\,0.5\,-1],\,[1\,-1\,0.5])$$$ were used, which gave echo times of $$$53\,/\,80\,/\,80\,/\,90\,$$$ms for pgse, asym vc, MODI m1$$$\,=\,0.1$$$s/mm and bipolar vc respectively. For each subject, scans with cardiac and respiratory triggering, as well as scans with only respiratory triggering, were performed.
Results
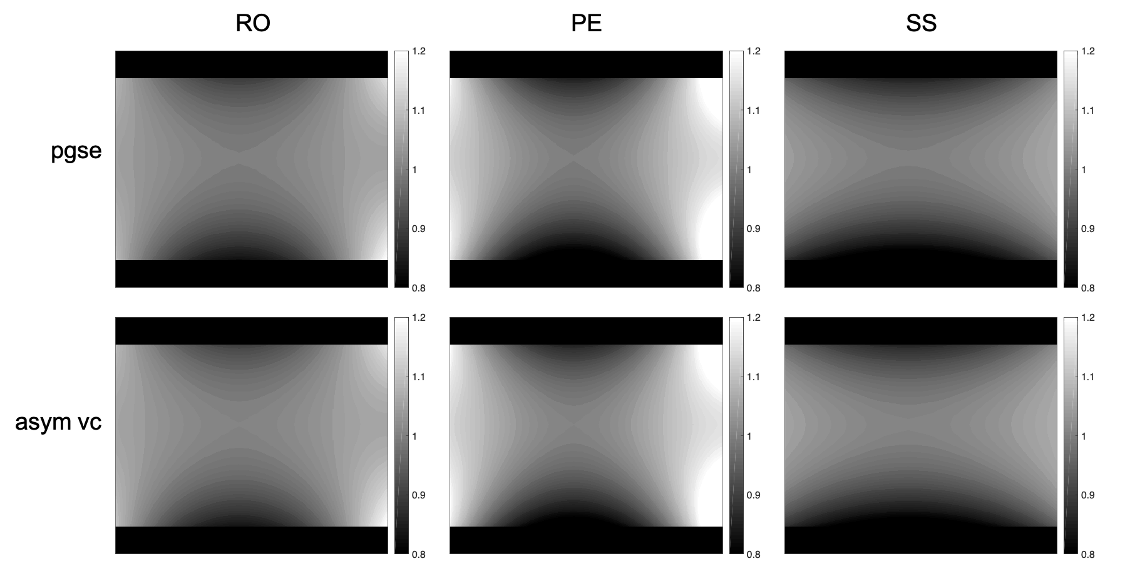
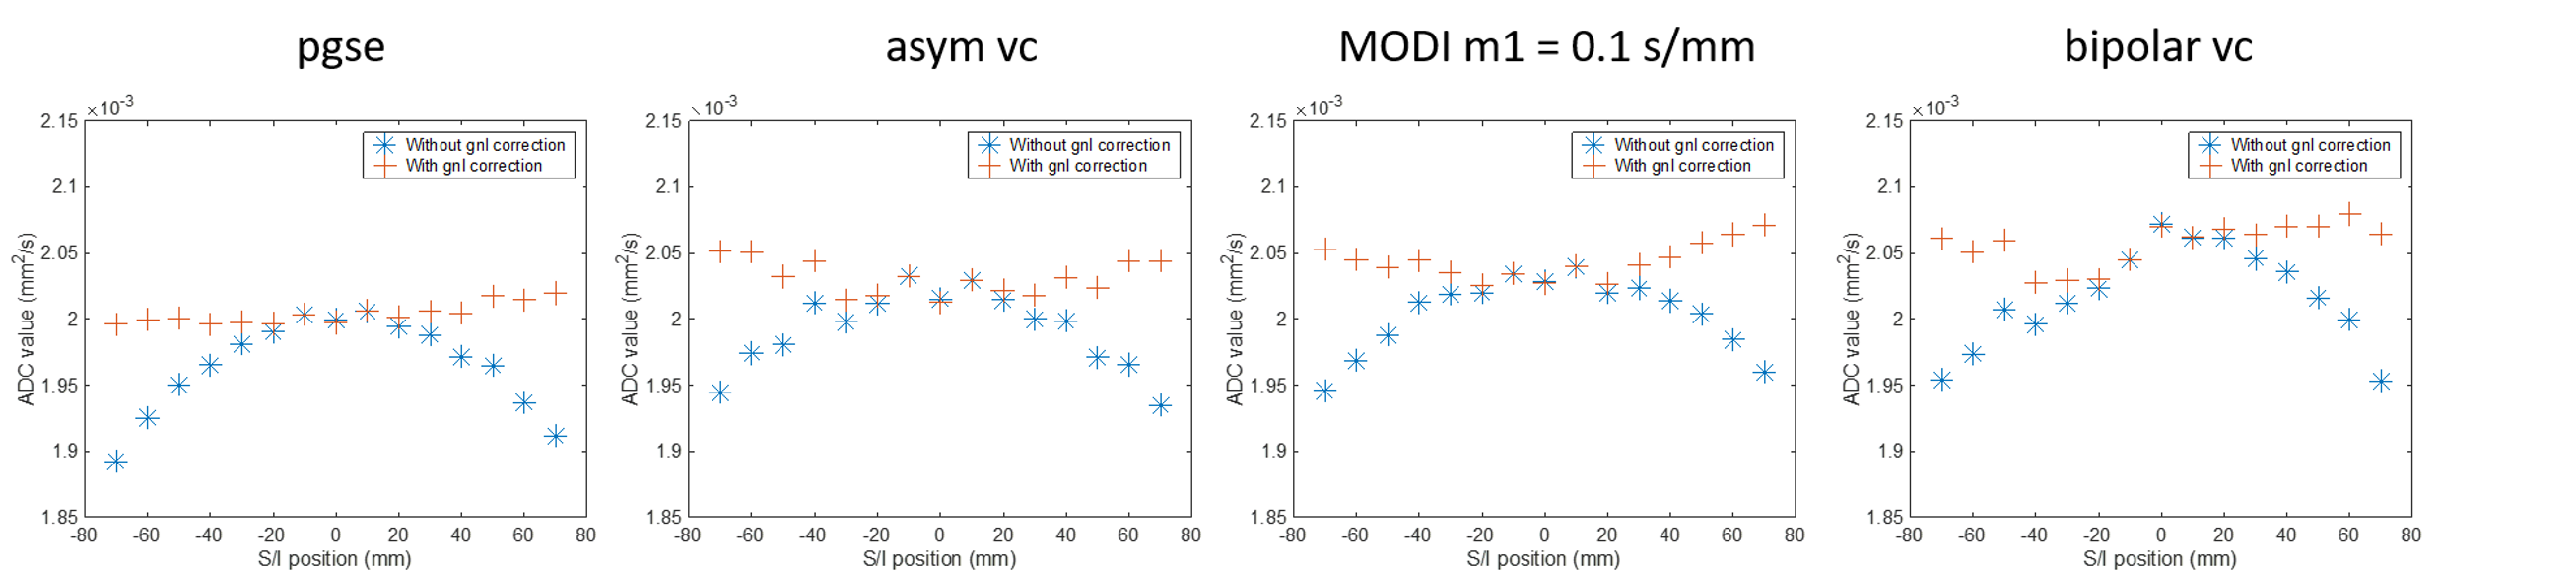
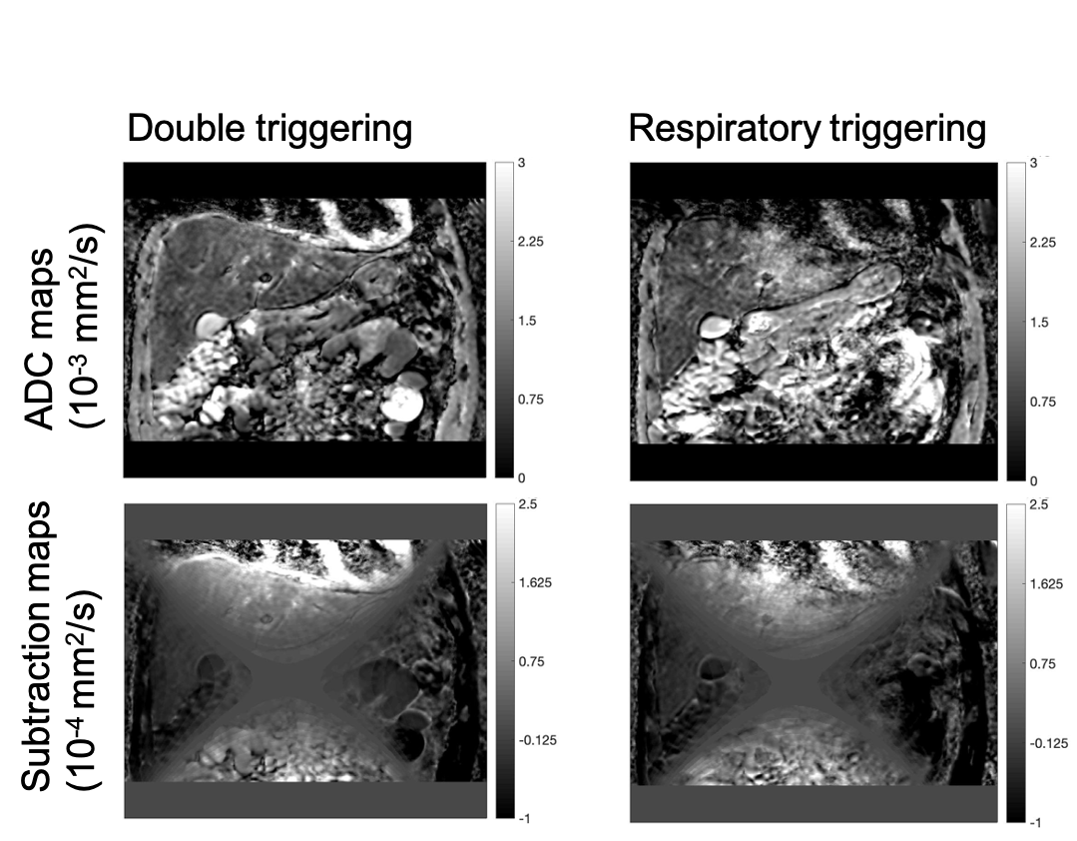
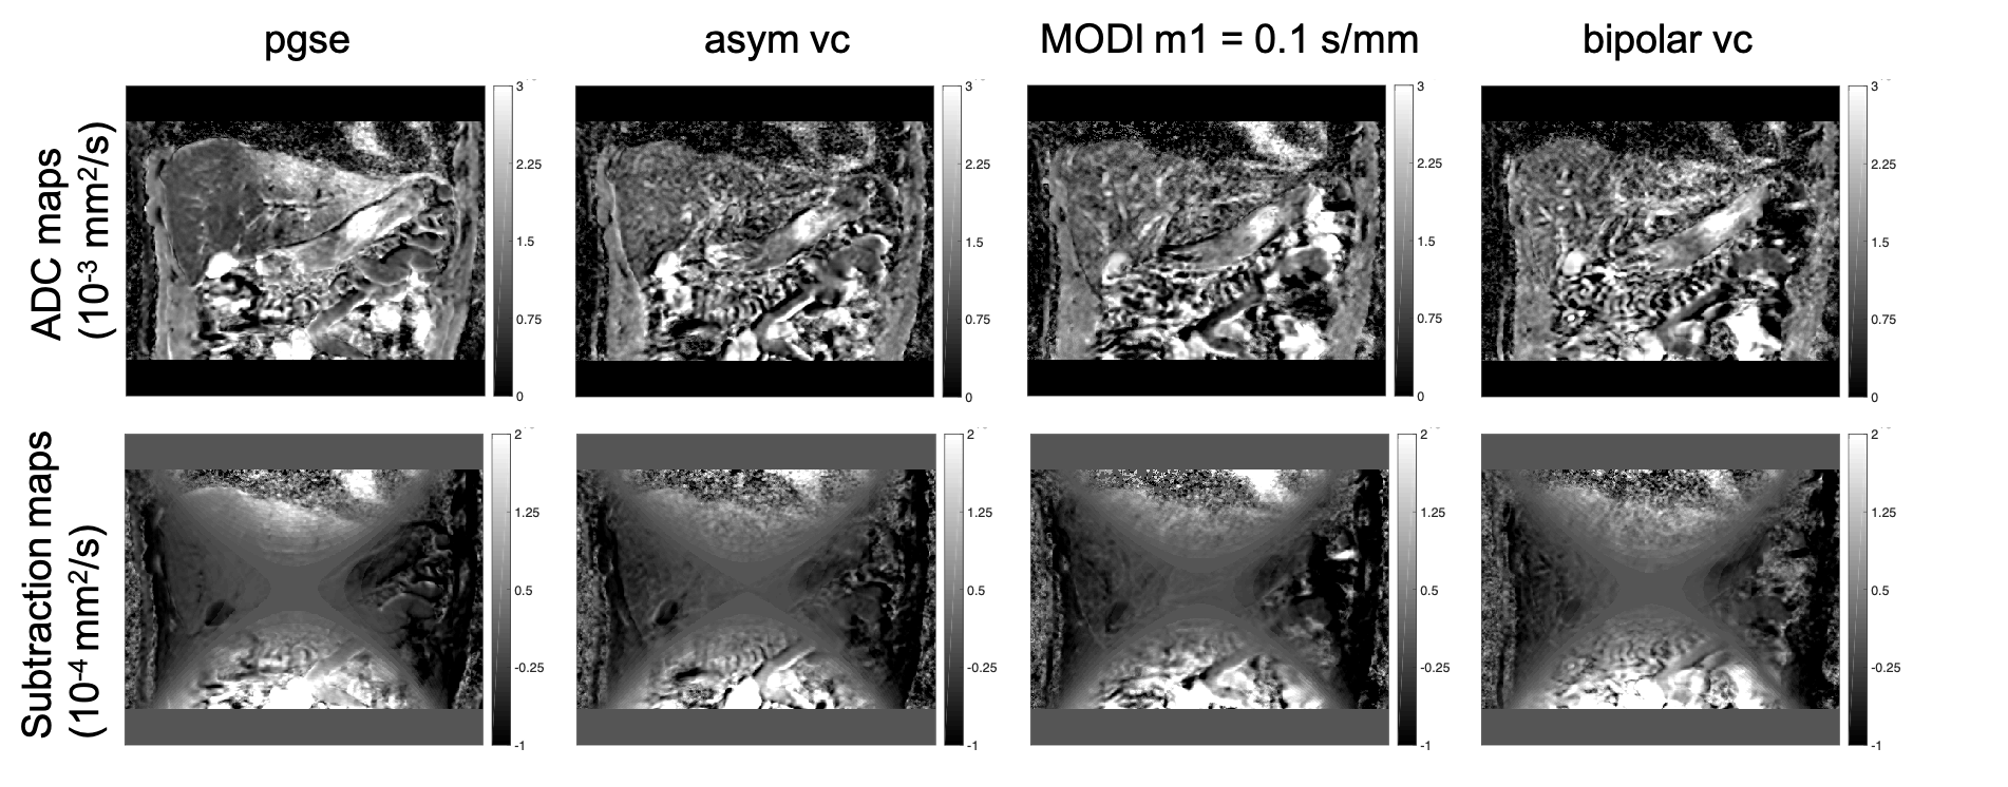
Figure 2 shows the correction maps for the pgse and asym vc waveforms. The correction maps between the two waveforms only differ by a small constant offset since the method used to calculate the correction maps applies to both waveforms. Figure 3 shows the estimated ADC for the phantom validation. Even though the ADCs from the motion compensated waveforms have a larger variation than pgse, all of the corrected ADCs show a flattening of the characteristic parabolic shape from the uncorrected ADC maps. Figure 4 shows the ADC maps and subtraction maps (corrected ADC – uncorrected ADC) for the pgse waveform with double triggering and only respiratory triggering. In the left liver lobe, the overestimated ADC due to motion is more severe in the respiratory triggered case. From the subtraction maps it can be seen that in the left liver lobe region, the gnl correction increases the already overestimated ADC even further. Figure 5 shows the ADC and subtraction maps for all waveforms with respiratory triggering. Even though the SNR is lower for the motion compensated waveforms, the left liver lobe ADC is not as overestimated as pgse, and the subtraction maps show a smaller difference between the gnl corrected and non-corrected ADCs in this region.Discussion & Conclusion
The b-factor correction maps are very similar between the different waveforms, due to the scaling of the b-value with the square of the gradient amplitude. The gnl correction, which was previously shown to improve ADC bias with the standard pgse waveform, also works well for motion compensated waveforms, as shown in the phantom experiment. Due to the spatially dependent characteristics of gradient nonlinearity and motion, there are regions with a synergistic effect between the gnl correction and motion-induced ADC overestimation, such as in the left liver lobe of a coronal scan.Acknowledgements
The present work was supported by Philips Healthcare. The authors would like to thank Thomas Chenevert and Dariya Malyarenko for helpful discussions.References
1. Namimoto T, Yamashita Y, Sumi S, et al. Focal liver masses: characterization with diffusion-weighted echo-planar MR imaging. Radiology 1997; 204:739-744.
2. Ichikawa T, Haradome H, Hachiya J, et al. Diffusion-weighted MR imaging with a single-shot echoplanar sequence: detection and characterization of focal hepatic lesions. Am J Roentgenol 1998; 170:397-402.
3. Aliotta E, Wu HH, Ennis DB. Convex optimized diffusion encoding (CODE) gradient waveforms for minimum echo time and bulk motion compensated diffusion weighted MRI. Magn Reson Med 2017; 77:717–729
4. Peña-Nogales Ó, de Luis-Garcia R, Hernando D, et al. Optimal design of motion-compensated diffusion gradient waveforms. Proc. Intl. Soc. Mag. Reson. Med. 25 (2017) Abstract 3340
5. Peña-Nogales Ó, Zhang Y, Wang X, de Luis-Garcia R, Aja-Fernández S, Holmes J. H., Hernando D. Optimal Diffusion-weighting Gradient Waveform Design (ODGD): Formulation and Experimental Validation. Proc. Intl. Soc. Mag. Reson. Med. 26 (2018) Abstract 1615
6. Van AT, Cervantes B, Karampinos DC, et al. Partial velocity-compensated diffusion encoding for combined motion compensation and residual vessel signal suppression in liver DWI. Proc. Intl. Soc. Mag. Reson. Med. 26 (2018) Abstract 0079
7. Majeed W, Kalra P, Kolipaka A. Motion Compensated, Optimized Diffusion Encoding (MODE) Gradient Waveforms. Proc. Intl. Soc. Mag. Reson. Med. 26 (2018) Abstract 1614
8. Peña-Nogales Ó, Zhang Y, Wang X, de Luis-Garcia R, Aja-Fernández S, Holmes J. H., Hernando D. Optimized Diffusion-Weighting Gradient Waveform Design (ODGD) formulation for motion compensation and concomitant gradient nulling. Magn. Reson. Med. 2018;00:1–15. https://doi. org/10.1002/mrm.27462
9. Zhang Y, Peña-Nogales Ó., Holmes JH, Hernando D. Motion‐robust and blood suppressed M1‐optimized diffusion MR imaging of the liver. Magn Reson Med. 2019;00:1–10. https://doi.org/10.1002/mrm.27735
10. McTavish S, Van AT, Peeters J, Ogino T, Hock A, Rummeny E, Braren R, and Karampinos DC. Partial velocity-compensated optimized diffusion encoding for combined motion compensation and residual vessel signal suppression in liver ADC mapping. Proc. Intl. Soc. Mag. Reson. Med. 27 (2019) Abstract 1709
11. Malyarenko DI, Ross BD, and Chenevert TL, Analysis and Correction of Gradient Nonlinearity Bias in Apparent Diffusion Coefficient Measurements Magnetic Resonance in Medicine 71:1312–1323 (2014)
12. Malyarenko DI, Pang Y, Wilmes LJ, Tan ET, Kirsch JE, Sénégas J, Jacobs MA, Newitt DC, and Chenevert TL, Correction of nonuniform diffusion weighting in DWI using vendor-provided gradient characteristics Proc. Intl. Soc. Mag. Reson. Med. 25 (2017) Abstract 1780
Figures